

Highlights
-
•
Virtual/remote customer inspection & feedback recorded during production of an aircraft.
-
•
SIE model for feedback prioritization (ranking) and categorization.
-
•
Graphical representation of the evaluation data to facilitate visualization.
-
•
Calculation of the percentage of improvements to a module.
-
•
Modular architecture for navigation & traceability of feedback & evaluation data.
Keywords: Aircraft production, Aircraft assembly, Augmented reality, Feedback evaluation, Remote integration, Virtual customer inspection
Abstract
This paper proposes a systematic approach for gathering requirements during production through customers’ remote access to the partially and fully assembled aircraft and its modules. The paper also proposes an evaluation and management of these recorded requirements and their utilization in the development of an aircraft. Modular product architecture is used for the modular organization of the product, product-service, and production system for the gathering, evaluation and management of feedback for product development perspectives. A mobile and wearable augmented reality system is used to virtually walk through the partially or fully manufactured product and to compare the status of the production with the product model to be produced. Change requests are captured as customer feedback. The knowledge thus acquired can be overlaid (augmented) on the real product, i.e. the aircraft. This approach is able to record the dynamic requirements of targeted customers. These changes can be carried out in the current version of the aircraft, and also incorporated into future versions. The implementation using case studies is presented for gathering feedback during assembly as well as for evaluating and managing the recorded feedback for exemplary modules (cabin and galley) of an aircraft. The use of the evaluation results in the development of an aircraft is also presented in the paper.
1. Introduction
The economy is changing rapidly with strong budgetary pressures. Therefore, companies aim at reducing costs and increasing customer satisfaction. They need to be aware of the prevailing economic trends and living standards for the product markets and countries in order to make more accurate and effective plans for product development.
The frugal strategy by removing unimportant functions/features and cutting costs is able to adapt household goods to market needs and the changing behaviour of customers (Berger, 2013, Bhatti et al., 2013, Ucler et al., 2006, Zeschky et al., 2011). The frugal innovation of investment goods such as aircraft and production systems is studied in the ProRegio project (ProRegio, 2017).
Customers usually define the aircraft request (configuration) based on the intended usage of the aircraft in operation e.g. short or long distance flights, and airline business models e.g. low-cost carriers or legacy carriers (Wensveen, 2007, Wensveen and Leick, 2009). These business model practices can vary slightly depending on the customer’s geographical location (e.g. head-up-displays are more likely to occur on Chinese aircraft than on European aircraft due to local regulations).1 The duration between placing the requirements for an aircraft and its delivery is quite long e.g. 12–18 months, as it depends on the availably of production slots. Some of the requirements defined in the proposal phase may change during this period, depending on market trends and customer requests (Belkadi et al., 2016). Components and modules in an aircraft are governed by predefined configurations. Deviation in the configuration can potentially have an impact on time as well as cost and can also disrupt production and supply of parts. Small deviations (for example placements of placards and markings) occur in production and may be requested by the customer.
These changes of requirements can arise during customer inspection on the ongoing production of an aircraft. At the present time, this is done by invitation: customers are invited (three to four times from the start of the assembly to the delivery of the aircraft) for physical visits to the production site to validate the assembled modules and manufactured product. The production has to respect these customer inspection activities and plan the ongoing production operations in accordance with these visits (referred to as physical customer inspections). The inspection personnel (a person from the manufacturer company who assists a customer during the inspection and feedback recording) collect feedback and pass it to the planning personnel. The physical customer inspections and the current way of collecting feedback are expensive and can impact production and delay feedback analysis and its effect on product development.
To address the challenges listed above, this paper proposes a unique way of gathering feedback during production through virtual customer inspections (VCI) instead of physical customer inspections. A formal and structured approach is used for VCI and for recording and evaluating the feedback. The recorded feedback is assessed and can be adopted in the product development in order to improve both customer satisfaction and request management. This approach uses modular product architecture (Belkadi et al., 2016, Belkadi et al., 2016b, Gupta et al., 2017a) for a modular organization of the product, product-service and production system for the recording, evaluation and management of feedback for product development. This investigation and its potential future implementation are taking place at the Airbus final assembly sites (Aircraft manufacturer as a case study).2
The innovative aspects of this paper are (i) feedback gathering through customer integration into the production line using remote access via an augmented reality system (referred to as remote customer inspection), (ii) feedback gathering and evaluation in a formal and structured manner, and (iii) utilization of feedback in the product development i.e. design and production in a formal and structured manner. The paper is divided into sections covering the current state of the art on customer feedback, a proposed framework, VCI and feedback recording, a feedback evaluation model, feedback management and use of feedback, a discussion and conclusion.
2. Literature review
This section reviews the current state of the art in four categories, (i) Tools and technologies available for virtual customer inspections, (ii) Customer feedback and perception, (iii) Customer feedback evaluation methods, and (iv) Product architecture and modularity for feedback management in the product development.
2.1. Tools and technologies available for virtual customer inspections
One of the first commercial systems offering an affordable and rather light-weight system was the i-boro of SN Technics GmbH (SN, 2017). The i-boro was a wearable computer system developed by SN with a head-mounted system by Xybernaut and proprietary processing and camera units (Fig. 1). The system was based on an Intel Pentium M processor and was one of the smallest and best performing audio and video transmission systems at the end of the 1990s. In 2010, based on previous experience (Bürgy, Glotzbach, Hildebrand, Tonn, & Ziegert, 2007), teXXmo Mobile Solution GmbH & Co. KG (Buergy, Vogt, & Seitz, 2012) provided the hardware for a similar system, commercialized by Brückner Group GmbH (2017). This system, called TRAVIS Callisto, helped to serve and maintain machinery from remote locations. It was designed to transmit audio and video information via WiFi while still being comfortable to wear (Fig. 1). It was important during the design of the Callisto to comply with all personal safety and security regulations.
Fig. 1.

i-boro by SN Technics (a) (SN, 2017), Brückner Callisto (b) (Brückner, 2017).
Fraunhofer (Kleiber, Weltjen, Alexander, & Schlick, 2012) developed a system with remote AR, which shows that an AR-based system as part of a telecollaboration system helps to navigate faster through repair and maintenance processes (Fig. 2). The setup comprises a mobile phone (SmartPhone) as a viewing client and a faster computer for the processing. Furthermore, the video feed of the mobile phone can be seen at the remote location to provide further instructions. Beeware GmbH (SODALIS, 2017) provides telemaintenance systems based on a tablet computer (Fig. 2). The system offers an audio and video stream and has a head-mounted camera solution. With a carrying case, mounted on the forehead of the user, the system can be operated hands-free. The Beeware system comprises mostly of standard industrial-grade computing components, which makes it affordable and fulfils the requirements of industrial applications.
Fig. 2.

Vehicle engine, enhanced by remote AR content (a) (Kleiber et al., 2012), Beeware Sodalis (b) (SODALIS, 2017).
Daqri offers a wearable system in two forms, a helmet solution and smart glasses (Fig. 3) (Daqri, 2017). This system is capable of running AR applications as well as offering remote expert sessions. Additionally, the system offers a thermal camera and a depth tracker to recognize the environment.
Fig. 3.

Daqri Smart Glasses and Daqri Smart Helmet (Daqri, 2017).
The systems described above all lead in the direction of VCI. However, they do not fulfil all requirements, such as remote assistance, augmented reality with spatial mapping and recording customer feedback from a remote location.
2.2. Customer feedback and perception
Since Porter’s work in the 1980s (Porter, 1979), value is commonly used to determine the opportunity of a business model (Osterwalder & Pigneur, 2010), and more generally to evaluate the performance of a process or a product.
The term “value” has different definitions and attributes depending on the stakeholder. Here we focus on the customer and use Woodruff (1997): customer value (also referred to as feedback) is the customer’s perceived preferences for product attributes, attribute performances, consequences of use, goals and purposes in use situation of the product. This customer consideration is one of the four perspectives described by Kaplan and Norton (1992) for their Balanced Scorecard to measure the performance of a firm. Increasing competition between firms around the globe has led to the development of many methods to integrate customer feedback into the design phase. For instance, house of quality (Hauser & Clausing, 1988) is able to listen to the voice of the customer and rank their priorities. This shows that customer feedback can incorporate objective and subjective evaluations.
Today, the co-design between customers and experts is well implemented in companies. There are numerous tools to support this interaction which are reliable and well-connected to the companies’ information system. Recent research has focused on the value evaluation during the decision-making process. For instance, Zhang, Auriol, Eres, and Baron (2013) proposed a method and tools to evaluate customer value ex-ante. However, this method is based on the strong assumptions that the initial customer statements are still true when the evaluation takes place, that the experts are able to understand them fully and that the performance of the sub-parts or total artefacts are measurable before the actual use in real conditions. These limitations are also present in literature (Eres, Bertoni, Kossmann, & Scanlan, 2014). The customer is the one that will use the product, it is therefore of paramount importance to get his/her requirements ex-ante and his/her satisfaction ex-post. Nevertheless, customer feedback on the physical product during the production stage is not as well documented and supported by practical tools. For example, Bhagwat and Sharma (2007) stress the importance of customer feedback in the supply chain performance but provide neither tools nor methods to carry it out.
In a study using both qualitative and quantitative data, Caemmerer and Wilson (2010) stressed the extent to which different customer feedback mechanisms contribute to organizational learning. Their study indicates that the models and methods developed to gather and manage customer feedback must not only consider the way data is gathered but also the way the data is used and implemented at a business unit.
As shown in Table 1, the state of the art presents a gap regarding the evaluation of client satisfaction during the production phase.
Table 1.
Synthesis of the literature on customer feedback and perception.
| Evaluation of the compliance of final products/services |
|||
|---|---|---|---|
| Requirement-proposal/design phase | Production phase | Delivery and usage phase | |
| Methodology/background | Value-based requirements engineering (Zhang et al., 2013); Value driven design (Eres et al., 2014); KANO (Kano et al., 1984) | Total quality management (Caemmerer & Wilson, 2010) | |
| Metrics | Value (Porter, 1979) | Value (Porter, 1979) | Value (Porter, 1979, Woodruff, 1997) |
| Tools | House of quality (Hauser & Clausing, 1988); Means-ends analysis, part-whole analysis and multi-attribute utility (Zhang et al., 2013); Concept design analysis (Eres et al., 2014); Conjoint analysis (Luce & Tukey, 1964); Kano model and conjoint analysis (Wang & Wu, 2014) | Balance scorecard (Bhagwat & Sharma, 2007); Multiple sources of customer feedback (Caemmerer & Wilson, 2010) | |
| Implementation and surveys | Aircraft (Eres et al., 2014); Mass customization (Fogliatto & da Silveira, 2008); Smartphones (Wang & Wu, 2014) | SMEs (Bhagwat & Sharma, 2007); Service operations (Caemmerer & Wilson, 2010) | |
2.3. Customer feedback evaluation methods
Customer feedback mechanisms include surveys (one-to-one, telephone, online), customer forums, and social media. Each of these can use different feedback evaluation models such as open discussions, a questionnaire on pre-identified attributes, and quantitative assessment of pre-identified attributes. The literature provides many examples of feedback evaluation methods as shown in Table 1. Here we will use the KANO model as reference (Kano, Seraku, Takahashi, & Tsuji, 1984) which focuses on the relationships between the customer requirements fulfilment and customer satisfaction. This model proposes 3 steps (a questionnaire, an evaluation table and a category result) in order to elicit links between global satisfaction of a customer regarding a given product and the product’s attributes. The original model was extensively used from the 1980s to the last decade (Violante & Vezzetti, 2017). Violante and Vezzetti (2017) present a detailed comparison between more than 15 enriched quantitative Kano models. They also proposed an evaluation framework to identify which of these models are adapted or appropriate to a given situation.
Conjoint analysis (Luce & Tukey, 1964) is particularly adapted to measure preferences for multi-attribute products such as aircrafts. Fogliatto and da Silveira (2008) use it to determine the differentiating attributes of a product in order to speed up its configuration process. The work of Wang and Wu (2014) proposes to combine the Kano model and conjoint analysis to determine different customer segments and appropriate product variety. We want to combine these two powerful tools to address customer satisfaction within the product design and production phases. In this paper, the attributes are classified both qualitatively and quantitatively. This is not done by any of the methods described above. Therefore, we propose a new refinement of the Kano model using conjoint analysis.
The existing methods consider customer feedback in product development as a one-way process starting from customer requirements to product design and production (Fig. 4(a)), whereas the problem that arises in aircraft production needs a twofold iterative process (Fig. 4(b)). There is a first validation of the produced solution without disturbing the production as opposed to the customer’s physical visits and a second evaluation and utilization of the customer feedback for the development (starting from product design to delivery of the product) of a series of products as illustrated in Fig. 4(b). To formalize this twofold iterative process, the literature on product architecture and modularity is explained in the following sub-section.
Fig. 4.

Product validation and feedback management during aircraft production.
2.4. Product architecture and modularity
Product architecture and modularity are reviewed as a possible structure for association and management of feedback for the product development. Product architecture is the way by which the functional elements (or functions) of a product are arranged into physical units (components) and the way in which these units interact (Ulrich & Eppinger, 2004). The choice of product architecture has broad implications for product performance, product change, product variety, and manufacturability (Ulrich, 1995). The architecture is strongly linked to the company's development capability, its manufacturing specialties, and product strategy (Pimmler & Eppinger, 1994).
Modularity is the concept of breaking down a system into independent parts or modules that can be treated as logical units (Jiao et al., 2007, Jiao and Tseng, 2000, Pimmler and Eppinger, 1994). Ulrich and Eppinger (2004) define a module as a chunk of a product with an identifiable function. The power of modularity for change management is clearly laid out in the literature (Sako, 2002). Furthermore, the use of modules is able to provide a comprehensive product portfolio with a range of costs (Da Cunha, Agard, & Kusiak, 2007).
The semantic interoperability in terms of labels of attributes and definitions of attributes across different applications of product development is still a research issue (Gupta, 2012, Patil et al., 2005, Szykman et al., 2001). Literature emphasizes this phenomenon by extracting the meaning and interpretation of attributes using a predefined structure in the context of product design and manufacturing (Gupta and Gurumoorthy, 2008, Gupta and Gurumoorthy, 2009, Gupta and Gurumoorthy, 2013, Kim et al., 2006, Mostefai et al., 2005, Patil et al., 2005).
In this present paper, it is assumed that an agreement regarding the definition of an attribute has been accomplished before using attributes in customer feedback. If this agreement has not been achieved then the definition of the attribute goes along with the modular product architecture. The focus of this paper is on the gathering, evaluation and management of customer feedback. The re-design of the products based on that feedback is beyond the scope of this paper.
3. Framework for customer feedback during aircraft production
A framework for customer feedback during aircraft production, utilizing the product architecture and modularity principles and managing feedback during product development is presented in this section.
A module in a product is considered as a physical or conceptual grouping of a product’s components to form a consistent unit and can be defined by a company. These modules can be selected by a customer for inspection, for marking feedback and for recording change requests. Modular product architecture is presented in Section 3.1. For a better consideration of customer requirements to identify what is most important for him/her, it is important to help designers and production planners set the prioritization strategy in the design and production processes of the product (current version and future versions). To do so, the customer should be able to provide his/her feedback, not only in terms of satisfaction regarding the whole product, but to decentralize feedback on a list of modules, attributes and features, while clarifying the importance of each module/attribute/feature for his/her final usages in operation, maintenance and recycling. This is done by asking the customer to rank the importance and satisfaction, for each module and attribute, based on Likert’s 10-point scale (1: Highly unsatisfied/ unimportant, 10: Highly satisfied/ important) (Norman, 2010). Combining feedback on modules and attributes of the product, the designer and production planner can stress the innovation efforts on modules with high importance and low satisfaction. “Satisfaction” defines the satisfaction level of the customer with the produced solution. “Importance” defines the significance of the considered module/attribute to the customer. The importance level gives an indication of how important a module/attribute is and to act accordingly during the design and production phases. Modules with low importance such as the implementation of functions are considered as adjustable solutions to reduce product cost and time, and to resolve potential conflicts between parameters. A proposed framework for customer feedback is presented in Section 3.2.
3.1. Modular product architecture
Modular product architecture is used for product validation during aircraft production and management of feedback from the product development perspective. The modular product architecture consists of (1) Generic Product Architecture (GPA): a graph where nodes represent product modules and links represent connections among product modules according to specific interfaces (such as functional, physical, information and/or material flow) to represent a product, and (2) Module: a physical or conceptual grouping of product components to form a consistent unit that can be easily identified and replaced in the product architecture.
The product architecture can be analyzed from different usage perspectives (e.g. design, manufacturing planning and final assembly) (Cantamessa and Rafele, 2002, Mo et al., 2008) to build modular product architecture for the modular organization of the product, product-service and production system for the collection and the evaluation and management of feedback for the product development. This structuring of the product’s parts is aligned with the proposition of a nested hierarchy of technology cycles (Murmann & Frenken, 2006). Examples of modular product architecture of Aircraft, Cabin, and Galley are explained in Fig. 5, Fig. 6, Fig. 7 respectively. Fig. 5 represents an example of a modular architecture of an Aircraft (A320) as identified at Airbus as a product data management approach (modular organization of the product, product-service and production system) and is applicable for design, manufacturing planning and final assembly. Modular architectures of “Cabin” and “Galley” modules in the Aircraft (A320) are depicted in Fig. 6, Fig. 7 respectively. These modular architectures are aligned with the product design, manufacturing planning (material requirement planning, supply chain management), final assembly and customer relationship management and use a product data management approach.
Fig. 5.

Example: modular product architecture for “Aircraft” comprising modules for “Wings”, “Fuselage”, “Stabilizer”, “Structure”, “Cabin”, “Cargo”.
Fig. 6.

Example: modular product architecture for the “Cabin” module comprising the modules for “Seats”, “Galley 1”, “Galley 2”, “Lavatory 1”, “Lavatory 2”.
Fig. 7.

Example: modular product architecture for the “Galley” module comprising the modules for “Storage Area”, “Coat Hook”, “Coffee Maker”, “Oven”, ”Opener”.
3.2. Proposed framework
A framework (Fig. 8) based on the modular product architecture (Section 3.1) is proposed for the virtual customer inspection (VCI) and feedback on an aircraft in production, the evaluation and management of feedback in the development of a series of aircrafts. As depicted in Fig. 8, the modular product architecture is used throughout the process starting from feedback gathering to utilization of feedback in product development through feedback evaluation.
Fig. 8.

Framework for customer feedback gathering, evaluation and utilization in customer driven product development.
The modular product architecture is used to formalize and structure the collection, evaluation and management of feedback. A module has features and attribute(s) such as the identification of the module and description of the module respectively. The considered product (product module) is real and not virtual at the time of customer inspection. This real product is made available to the customer using an augmented reality system for the validation and feedback recording.
In product development, a product configuration based on the customer’s requirements is proposed by the company (Panel 1 of Fig. 8). This proposal includes market constraints (such as civil aviation policies and standards) and the company’s capabilities (such as the tools and technologies the company uses for product development). The company manufactures the proposed solution as a real and workable product (Panel 2 of Fig. 8).
During production, validation steps are required to validate that what is produced by the company complies with the proposal and that the customer is satisfied with the solution e.g. the product. These validations usually happen during production so that deviations, if there are any, can be eliminated. At present, this is done by during physical customer inspections at production sites. Fig. 9 compares the developed approach with the existing one as the state of art at Airbus, stressing the actions done either by the company (red3) or the customer (blue). The major differences are in the access and interactions with the real product in the production phases where the evaluation of the work in progress enables the modification of the existing version of the product as well as future ones (thanks to knowledge capitalization). The developed approach uses remote access of the partially or fully manufactured product for the inspection (i.e. VCI) and feedback recording as compared to physical customer inspections at production site(s). The VCI recorded feedback is then evaluated using SIE (Satisfaction and Importance Evaluation) model in contrast to using Excel sheets and MS word in the existing approach. This feedback loop enables a product to be delivered in line with up to date requirements using remote access to the product in production.
Fig. 9.

Flowchart of the developed approach compared to existing ones.
The paper proposes VCI and feedback gathering (Panel 3 of Fig. 8) for these validations without physical visits by the customer. The product (product modules) is connected virtually to the customer through an AR (Augmented Reality) system for customer inspection and validation. An inspection person (a person from the manufacturer company who assists a customer during VCI and feedback recording, also referred to as “VCI assistant”), who is wearing a Microsoft HoloLens, physically walks through the real product being produced. The VCI assistant also uses inspection tools required to check the quality of the physical product guided by the customer’s request for inspection. The AR system gives the customer access to the real product being produced. The customer checks the product and inspection report, and also compares the produced product with the product model (digital model) and the details in the requirement-proposal phase. The customer enumerates his/her satisfaction and importance levels for the selected modules, attributes and specific queries as specified during the inspection. The customer also enumerates deviations and additional comments and/or preferences if required.
The AR system records the customer feedback as (i) Satisfaction (on scale 1 as dissatisfaction to 10 as satisfaction), (ii) Importance (on scale 1 as unimportant to 10 as important), and (iii) Preferences if the customer is not satisfied with the produced solution. The preferences include (a) enumeration of missing components in a module which can be identified during VCI, for example: “Coat Hook is missing” in module “Galley”; (b) option for increasing customer satisfaction could be selected from predefined proposals (as put forward by the company) against the module or component of the module, for example: selection of a different “Entertainment System” from the list of entertainment systems; (c) description comprising a text with or without the image/CAD model, for example: “volume limits of the “Entertainment System” should be increased”, “Colour and texture of the “Passenger Seat” should be changed” and attach an image of the colour and texture; (d) additional requirements which are not defined earlier, for example: provide 4 pieces of “Coat Hook” instead of 2 in “Galley”, provide “Ice Maker” in “Galley”. This individual customer feedback is recorded during production i.e. the assembly stage, on the modules in the product as well as on critical attributes identified by the company. This is to validate that what was proposed to the customer and the customer’s imagination of the product during the requirement-proposal phase is the same as what is produced (a real not a virtual product) by the company (Fig. 4(b)).
Feedback evaluation (Panel 4 of Fig. 8) receives the feedback and computes the percentage of corrections needed on the modules, attributes and features. Conceptual Satisfaction Importance Evaluation (SIE) model for feedback analysis and evaluation is presented in paper (Gupta, Belkadi, & Bernard, 2017b). By enabling the customer to look at the aircraft from a distance, VCI builds the base for direct and more frequent feedback. Hence the feedback loop of gathering feedback and drawing conclusions and improvements from it is shortened and customer feedback can find its way into the product design and production quality more quickly.
The information thus generated is updated in the modular product architecture which is then utilized by the design and planning department for product design and planning activities of the current product as well as for future versions (links 5 of Fig. 8). The improvement indicators and recorded feedback attached to the modular architecture can be used for improving the product configuration as proposed in the requirement-proposal phase and can also be used for improving the ongoing product in order to include the deviations, if any, and for increasing customer satisfaction.
The implementation details with case studies of the proposed framework are presented in the following sections (Sections 4, 5, 6).
4. Implementation of the proposed framework for customer feedback during aircraft production
The overall process of the VCI, feedback gathering, evaluation and management has three sub-processes based on seven steps (Fig. 10). The sub-processes are:
-
1.
Creating the inspection data, including AR-based visualization information;
-
2.
Selecting relevant inspection modules and items and performing the actual inspection; and
-
3.
Evaluating feedback and providing results to the production planning and design departments.
Fig. 10.

Implementation of the gathering, evaluation and utilization of customer feedback in customer-driven product development.
The preparation of the inspection data is mandatory and is the base for the list of inspection items. Although the AR visualization data is optional, it helps to find these items quickly and highlights the details that are important for the inspection tasks. All three processes share data stored in and retrieved from a PLM repository (database). The complete process is shown in Fig. 10. The three black-framed boxes contain the sub-processes: the AR design tool, the AR VCI tool and the Feedback Evaluation tool. Data is exchanged in XML format, either as a proprietary format for defining the inspection data including the AR visualization data, or in Microsoft Excel format to enable easy editing of feedback data for evaluation.
The sub-process of “creating inspection data” has four steps: to extract the modules, features and attributes of interest from the related product architecture in the repository, including the AR visualization data (link 1 in Fig. 10). It is important to define the inspection items based on the module and component hierarchy and to locate the item within the aircraft to enable AR visualization as an overlay on the real aircraft in production. The AR model is created in the second step where the items are set out to enable an easy walk-through during the actual VCI. The properties and the location of the items are linked and created manually by adding a set of attributes to be evaluated by the customer. The model is saved in an XML file and attached to a feedback object connected to the product architecture (link 2 in Fig. 10).
In the second sub-process, the customer will select the product reference through a remote connection to the PLM using the VCI tool interfaces (link 3 in Fig. 10). The editor of the actual VCI selects the list of items to evaluate from the predefined list when creating the AR models. In the next step, the PLM will export the XML file required to create the AR scene for the VCI (link 4 in Fig. 10).
The VCI is then performed and the VCI tool records the customer’s satisfaction and importance ratings for every inspection module and attribute along with their comments and preferences. It is also proposed to classify feedback whether it is connected to the design or production but such a study has yet to be carried out. The recorded feedback is stored in the PLM repository and linked to the appropriate feedback object (link 5 in Fig. 10). The AR design tool and AR VCI tool are explained with an implementation in the company case study in Section 5.
The third sub-process has three steps, the first – the feedback evaluation tool collects the recorded feedback (link 6 in Fig. 10), the second – the categorization of feedback as relevant for the improvements in the modules and attributes, and the third – an Excel file is created and attached to the product architecture (link 7 in Fig. 10). The product architecture is then used for the product design and production planning. The feedback evaluation model is explained in Section 6.
5. Virtual customer inspection and feedback recording
The main objective of the VCI is to support interaction between the production site and the remote customer during aircraft manufacturing using the AR tool. The customer feedback is recorded using the AR system (embedded with the product model and feedback forms) from the customer on assembled modules, remotely, without the physical presence of the customer at the production site. The customer can define additional requirements based on the styling, look and feel of the manufactured product modules, business policies, and passenger interests. This saves travel costs and reduces pausing in the production process during actual in-person visits. The application offers audio and video connections, coming from conferencing tools or telemaintenance systems, but will enhance the user experience of the remote customer by automatically adding augmented information to the view i.e. the transmitted video feed showing the real objects is enhanced by information in almost real time. The concept comes from live sports transmission, such as soccer or ski jumping, where offside recordings are shown “live” to the TV viewers. The difference is that the VCI tool has bidirectional transmission and will enable the remote users to interact based on the augmented information. This section describes the technology of the VCI setup for feedback recording during production.
5.1. VCI system architecture
The proposed VCI system has a mobile or wearable computing device, i.e. a computer that is worn on or close to the human body, which is connected to the PLM and can transmit video and audio to other locations (i.e. other mobile or stationary devices). Microsoft HoloLens (Microsoft HoloLens, 2017) (Fig. 11) is selected for VCI and feedback recording and is connected to the PLM via WiFi and the Internet. It is essential to have an open system and to develop a demonstrator that can connect to the PLM system and show the processes of customer feedback recording. Other additional requirements are that the VCI device is light-weight and easy to handle, and data during production and inspection, and data exchanges to and from the remotely connected customers. In the proposed setup, the input data for an inspection is retrieved from an FTP server, which has a connector to the PLM. The mobile application can retrieve inspection items such as an inspection template, i.e. to start a fresh inspection, or the results of previously performed inspections can be retrieved to compare with and build upon this existing inspection data. This data is structured, based on the module and component descriptions of modular product architecture in the context of aircraft development (Airbus A320). The data exchange is based on XML files with additional multimedia files.
Fig. 11.

Microsoft HoloLens for VCI and feedback (ProRegio, 2017).
The data can be a simple text and numeric values, as well as multimedia content, such as photographs, audio and video recording, which are stored and exchanged via the FTP server as multimedia files. In addition to the description and the documentation of the inspection items, the location (within the aircraft) and some object feature definitions for registration with the augmented reality system will be transferred.
Once the template or an existing inspection is loaded on to the mobile device (HoloLens), the inspection can begin. Objects that are registered with the AR system can be visualized as an artificial 3D overlay or as pictures attached to real-world objects. This will reduce search time for these elements and can offer a means to compare former or planned features of the system with the as-built state of the product while the AR feature will speed up and enhance the actual inspection process. The complete view from the camera can be transmitted to a remote (the customer’s) location. In this way, an in-situ inspection by the customer can be replaced by the VCI. The customer has direct audio connection to the VCI assistant and thus, can guide him or her to locations that the customer might want to check or re-visit.
If items are checked, the status of each item can be stored. This information can be enhanced by multimedia data, i.e. photographs or audio and video recordings. Each value will have a timestamp and position as coordinates within the aircraft. The positioning can either be done by additional systems providing the location or by the HoloLens itself, using spatial mapping and triangulation process of HoloLens, which builds room models of its surrounding.
To enable the customer feedback loop, the system displays evaluation scales to the VCI assistant as well as to the customer (Fig. 12(a)). Both are now able to select the levels of importance and satisfaction, because in some cases, the system setup for the customer might not be equipped with appropriate input means and thus, the VCI assistant will enter the rating which the customer tells him or her via the audio connection. The customer can also add preferences, if the modules and attributes are below the expected level, and comments on the module if some aspects are inappropriate (Fig. 12(b)).
Fig. 12.

HMI (Human Machine Interface) design study for HoloLens views.
The recorded satisfaction and importance levels, and customer preferences and comments are stored and acted upon in the next rework and design iterations. These values are stored with the appropriate objects, i.e. modules or components. Finally, the results are transferred to the FTP server of the PLM.
5.2. Implementation of VCI and feedback recording
The implementation is done, based on Microsoft HoloLens (Microsoft, 2017) using the Unity game engine (Unity game engine, 2017) and Vuforia augmented reality plugin (Vuforia augmented reality platform, 2017). The HoloLens incorporates several cameras and a depth sensor, and offers an optical see-through display with a wide field of view. It continuously generates a 3D room model of its surroundings; Microsoft calls this process “spatial mapping”. In a triangulation process as part of spatial mapping (Fig. 13), the objects in the view of the depth sensor are recorded as 3D point clouds and stored locally on the HoloLens. In this way, AR information can be attached to objects, i.e. to specific locations in the room model. In about 2–3 s, the system recognizes if objects have been added or removed from the room. While for most environments this process works well, in our application we face the problem that the room, i.e. the interior of the aircraft, will change constantly as it evolves. If, for example, the seats are moved into the aircraft or complete galleys are mounted, the shape of the interior will change dramatically. This is dealt with by considering additional “AR anchors” as special 2D markers comparable to QR codes, to register the information which has to be localized within the aircraft. As an alternative, doors and windows can be used to identify and provide relative information.
Fig. 13.
Spatial mapping and triangulation of the product’s surroundings.
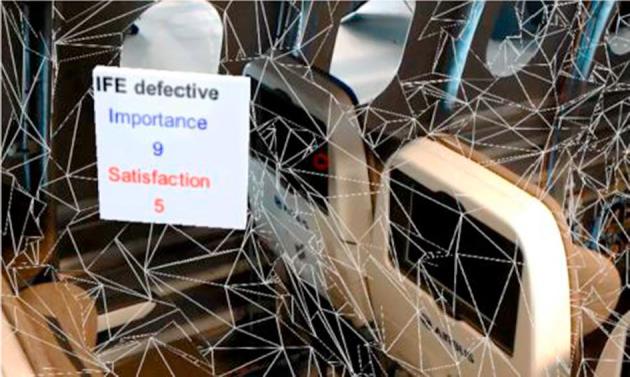
The recording of the customer feedback has been tested in an AR-based system running on a tablet computer. The system recognizes markers of inspection items and shows, for each item, two scales for rating importance and satisfaction levels, and offering additional options for leaving comments and preferences such as text or audio recordings. Fig. 14 shows screenshots of the demonstrator. Fig. 14 shows screenshots of the case study. The screenshot in Fig. 14(a) shows kitchen equipment (i.e. Coffee Maker) in a galley to the user, a display based on recognized AR markers. The buttons for importance and satisfaction levels are placed as fixed elements around the actual view and are implemented as clickable buttons. In the HoloLens setup, the buttons are placed on the objects to be rated as the user needs to be able to link the module to the buttons. Fig. 14(b) shows a mock-up of the HoloLens view.
Fig. 14.

Screenshot of VCI demonstrator based on tablet computer (a), mock-up view with HoloLens (b).
The recorded feedback on the Coffee Maker is shown in Fig. 15 as instantiated to the product architecture. The first column of the table (Fig. 15) shows the attributes and the second column contains the values of these attributes. The first row has the module or attribute name used in the VCI and feedback. The second row contains the customer description and inspection setup, for example, and the customer reference number and timestamp. The third and forth rows have the recorded satisfaction and importance levels respectively as integer values. The last row contains the customer’s comments and preferences, if any, as text. The product architecture with the recorded feedback is navigated and used as per the requirements of feedback evaluation and product development. For the implementation, the recorded feedback is saved as an Excel file and sent for evaluation. The evaluation process and use of the recorded feedback are presented in the following section.
Fig. 15.

Recorded feedback on kitchen equipment (Coffee Maker) of a galley.
6. Customer feedback evaluation and management from a product development perspective
A Satisfaction Importance Evaluation (SIE) model is proposed to identify whether a module in a product is produced according to targeted customers and to compute corrections needed to make the module frugal. The SIE model is based on the modular approach (Section 3.1) for the evaluation of customer feedback from a product development perspective.
A module is a frugal module if customer satisfaction and importance levels for all the frugal attributes of this module are placed in the FrugalDesign zone (see Fig. 16). Thus a product consisting of frugal modules is defined as a frugal product. Frugal attributes are Function, Robust, User-friendly, Growing, Affordable, and Local (Berger, 2013). Even though safety and security are of prime importance for an aircraft, companies design the product to satisfy customer needs which are dynamic. It is important to retain customers and attract new customers in today’s competitive markets. To provide a product that respects all the frugal attributes is extremely difficult, so companies look for a good-enough and affordable product that meets the needs of competitive markets for frugal design (Zeschky et al., 2011). The proposed modular organization is used for product development in a company. The company or customer selects attribute(s) from a list of frugal attributes against each module in the product for feedback. The SIE model evaluates the product and suggests the corrections required to make it frugal. For example, if customer feedback for frugal attributes (for example: Robust, Affordable) on the Galley Module is in the FrugalDesign zone, then the Galley is a frugal product. For the demonstration, product modules are considered for the VCI and feedback, instead of frugal attributes on each module. These attributes are considered in the same way as shown in this paper.
Fig. 16.

Satisfaction Importance Evaluation (SIE) model.
A conceptual version of the SIE model applied to the generic product is presented in paper (Gupta et al., 2017b). In this model, a large amount of customer feedback from a targeted market is analyzed and evaluated to generate improvement indicators for the product design. The work presented in this paper is for a customer specific product (Aircraft) where each and every customer feedback has to be addressed.
The X-axis with values of 0–10 represents the importance level and the Y-axis with values of 0–10 represents the satisfaction level of the customer feedback in the SIE model for a product module and attributes (Fig. 16). The datum line is considered as a datum or reference line for feedback evaluation. It is assumed that the datum line represents 100% frugal design in the produced module with respect to the customer feedback and optimal utilization of the resources used in design and development of the module e.g. requirements fulfilment. So feedback placed on the datum line represents 100% frugal design. The SIE model contains three zones separated by upper and lower bound profile curves as shown in Fig. 16. The trends of upper and lower bound profile curves can be evaluated using market trends and company policy such as the correlation between resource use in the development of a module and customer feedback or module cost. Exact thresholds for the 3 zones need to be determined by customer surveys (calibration of the rating). These curves can be different for modules and attributes considered in the feedback. These curves are considered as straight lines for the examples presented in this paper. The following sub-sections describe the three zones in the SIE model and corrections required in the product development.
6.1. Poor design
Feedback on a module placed in the red zone in the SIE model (Fig. 16) showed it to be a poor design module. The “PoorDesign” indicator with the red flag is used for such kinds of modules. The customer is not satisfied with the modules located in this zone. The zone on the bottom right-hand side of the lower bound profile curve corresponds to poor design. The percentage of corrections required in the poor design module is computed by Eq. (1). A module with the “PoorDesign” indicator has to be improved in order to satisfy the customer(s). A poorly designed module should be replaced (or re-designed) to improve quality, performance, material, and/or capacity as per the requirements identified to improve customer satisfaction.
| (1) |
where L = maximum space available for customer feedback; ; Dp = shortest distance from location of customer feedback to Lower bound profile curve; = feedback location on the SIE model for a module.
6.2. Over design
“Over design” feedback on a module places it in the blue zone in the SIE model (Fig. 16). The “OverDesign” indicator along with the blue flag is used for such kinds of modules. The zone on the upper-left side of the upper bound profile curve corresponds to over design. A module in this zone has the possibility to reduce design constraints in order to save resources and time spent in the production of this module. An over design module can be replaced with a less expensive module to reduce cost, time and resources. The percentage of corrections required in and over a design module to make it frugal is computed by Eq. (2). The company may replace this module by a low-cost (or economical) module according to the percentage of OverDesign.
| (2) |
where L = maximum space available for customer feedback; ; Do = shortest distance from location of customer feedback to Upper bound profile curve; = feedback location on the SIE model for a module.
6.3. Frugal design
Feedback on a module placed in the green zone in the SIE model (Fig. 16) is an appropriate design module for a targeted customer. The “FrugalDesign” indicator shown by a green flag is used for these modules. A module with a “FrugalDesign” indicator can be used in product development without changing the resources used in the design and development of this module.
6.4. Feedback categorization from a product development perspective
After evaluation, the feedback is categorized as either being a product design issue or one relating to production quality. The feedback is then sent to the appropriate department and people. As this categorization is a task for internal staff without customer involvement, an additional application is able to read all inspected modules and add any missing information. Hence, after feedback evaluation, a technician uses this application to enter the categorization data. The application (Fig. 17) enters the values of the “Feedback Category”, i.e. whether feedback on the modules concerns the product design or the production. After the categorization of all inspection items, the results are stored in Excel file format.
Fig. 17.

Example of desktop view of categorization application.
Feedback evaluation data contains prioritization (or ranking) as (i) PoorDesign modules, (ii) OverDesign modules, (iii) FrugalDesign modules, along with the percentage of corrections required in these modules and categorization as per the relevance in the product development i.e. design, production. The evaluation data is structured across the product architecture by associating the indicators, flags, percentage of corrections required and feedback category of the modules. The recorded feedback during VCI is used for the construction of an SIE model. The feedback and feedback evaluation data are presented in Fig. 18, Fig. 19 using modules “Galley”, “Seats”, “Oven”, “Coat Hook” and “Coffee Maker”.
Fig. 18.

Example of product architecture with feedback evaluation data as stored in the PLM.
Fig. 19.

Example of feedback evaluation data.
The indicators and percentage of corrections are required to identify the relative uses of the resources for the development of the next version of the product modules in comparison with the resources used to develop the original product modules. The evaluation results along with the customer preferences are saved in the modular product architecture (Fig. 18). The results include (i) evaluation data for each module as a graphical representation (see Fig. 19(a)), (ii) an indicator with the percentage of corrections required for the development, flag and feedback category (column G-J of Fig. 19(b)), and (iii) customer preferences as recorded during VCI (column F of Fig. 19(b)). The final evaluation data is then stored in the PLM repository (database) including result diagrams and thus provides feedback to both product designers and production engineers.
7. Discussion
The described framework could be a new and interesting way of connecting, even more closely, the customer with the production of his/her aircraft. To which degree virtual inspections are actually able to replace physical inspections cannot be foreseen today. It is likely to depend on individual customers as well as the capability of the technology used to remotely check the expected quality (e.g. number and type of quality sensors used, the resolution and colour-fidelity of camera images, etc).
Concerning feedback evaluation, it is challenging to find objective and comparable scales on which customers can indicate their personal and subjective perception of satisfaction and importance. Furthermore, the exact thresholds for the 3 zones (frugal design, over design, and poor design), explained in Section 6, need to be determined by customer surveys. These zone-thresholds are expected to depend on both the respective customer and the components. For instance, considerations will clearly be different between a coat hook and a head-up-display or power engines.
The system setup for VCI and feedback evaluation looks promising. The data flow to and from the PLM has been demonstrated in the project (ProRegio, 2017). Recording customer feedback directly during a remote inspection is a new approach and has two main advantages: it avoids the physical presence of people, which might ease the impact on the production process and save travel time and money; and it reduces the time for the gathering and processing as all data – inspection results and customer feedback – is stored directly in the PLM, i.e. there will be no asynchronous (e.g. paper-based) feedback collection processes. The results are available on the PLM as soon as the inspection is finished. The follow-up processes of quality assurance can access these results and trigger the necessary action for rework or feedback to the design engineers.
In the SIE model, product modules considered for VCI and feedback recording are evaluated for prioritization (or ranking), categorization and to compute the percentage of corrections needed in the product development to satisfy the needs of the targeted customer(s). It is suggested that the evaluated feedback and requirements are assessed by the aircraft manufacturer (Airbus) based on the importance of the critical parameters (time, cost, production disruption and supply of parts) in the ongoing product and also in the next version of the product. These can be used for correcting the product module (already assembled but the product is yet to be delivered) and also for correcting the product module in the next version.
Using modular product architecture for formalization and to structure the collection, evaluation and management of feedback gives the traceability of feedback and its evaluation throughout the product development. The navigation of feedback and available configurations to respect feedback become easier.
8. Conclusion
A new framework has been proposed for VCI and feedback recording, formalization and structuring feedback and evaluation data. The proposed framework ensures the mechanism for feedback from virtually connected customer(s) in a formalized and structured manner, and then generating evaluation data to be used in product design and production. The utilization of a 3D product model and modular product architecture ensures the formalization and organization of the recorded feedback and evaluation data in a unified way across the product architecture which is compatible with the product design and production. These aspects can potentially reduce disruption during production, reduce cost and resources for the inspection, correct deviations faster and also provide feedback traceability for use in the product development. The framework is implemented as an AR design tool, AR VCI tool and feedback evaluation tool. This has been presented using aircraft modules as industrial case studies.
After the user acceptance test, the system will be evaluated in terms of applicability in real-world environments. The use of speech control was successfully tested in a laboratory environment, but is not yet in real production. Using speech recognition is not an easy task when simultaneously discussing specifications with the customer on the audio channel. The localization of inspection items will be part of future research as it would be a helpful feature where both the customer and the VCI assistant could attach annotations and comments to specific objects. The correlation between design attributes with frugal attributes is a consideration for future research.
Acknowledgement
The work presented in this paper is supported by the European Union’s Horizon 2020 research and innovation project “Customer-driven design of product-services and production networks to adapt to regional market requirements-ProRegio” (GA No: 636966).
Footnotes
For interpretation of color in Fig. 9, the reader is referred to the web version of this article.
References
- Belkadi F., Buergin J., Gupta R.K., Zhang Y., Bernard A., Lanza G.…Urgo M. Co-definition of product structure and production network for frugal innovation perspectives: Towards a modular-based approach. Procedia CIRP. 2016;50:589–594. [Google Scholar]
- Belkadi F., Gupta R.K., Vlachou E., Bernard A., Mourtis D. IFIP International Conference on Product Lifecycle Management. Springer; Cham: 2016. Linking modular product structure to suppliers’ selection through PLM approach: A frugal innovation perspective; pp. 227–237. [Google Scholar]
- Berger R. Frugal products: Study results. 2013. <https://www.rolandberger.com/media/pdf/Roland_Berger_Frugal_products_20130212.pdf> Accessed 27.04.2017.
- Bhagwat R., Sharma M.K. Performance measurement of supply chain management: A balanced scorecard approach. Computers & Industrial Engineering. 2007;53(1):43–62. [Google Scholar]
- Bhatti Y.A., Khilji S.E., Basu R. Chandos Publishing; Oxford, UK: 2013. Frugal innovation. Globalization, change and learning in South Asia. [Google Scholar]
- Brückner Group GmbH, <https://www.brueckner.com/fileadmin/user_upload/downloads/Remote_Service_TRAVIS_Callisto_02.pdf> (Accessed 27.04.2017).
- Buergy, C., Vogt, E., & Seitz, J. (2012). Developing a wearable computing platform for industrial augmented reality applications. In ISWC 2012, Adjunct proceedings. <http://www.iswc.net/iswc12/ISWC2012_AdjunctProceedings.pdf>.
- Bürgy, C., Glotzbach, U., Hildebrand, A., Tonn, M., & Ziegert, T. (2007). Sichere Wearable Systeme zur Kommissionierung industrieller Güter sowie für Diagnose, Wartung und Reparatur. Mensch und Computer Konferenz, Bauhaus-Universität Weimar, Sept. 2–5, 2007.
- Caemmerer B., Wilson A. Customer feedback mechanisms and organisational learning in service operations. International Journal of Operations & Production Management. 2010;30(3):288–311. [Google Scholar]
- Cantamessa, M., & Rafele, C. (2002). Modular products and product modularity-Implications for the management of innovation and for new product development. In DS 30: Proceedings of DESIGN 2002, the 7th International Design Conference, Dubrovnik, Croatia. (pp. 29–36).
- Da Cunha C., Agard B., Kusiak A. Design for cost: Module-based mass customization. IEEE Transactions on Automation Science and Engineering. 2007;4(3):350–359. [Google Scholar]
- Daqri augmented reality platform. <www.daqri.com> (Accessed 27.04.2017).
- Eres M.H., Bertoni M., Kossmann M., Scanlan J. Mapping customer needs to engineering characteristics: An aerospace perspective for conceptual design. Journal of Engineering Design. 2014;25(1–3):64–87. [Google Scholar]
- Fogliatto F.S., da Silveira G.J. Mass customization: A method for market segmentation and choice menu design. International Journal of Production Economics. 2008;111(2):606–622. [Google Scholar]
- Gupta R.K. Indian Institute of Science; Bangalore, (India): 2012. Feature-based approach for semantic interoperability of shape models (Doctoral dissertation. Ph. D. Thesis. [Google Scholar]
- Gupta R.K., Belkadi F., Bernard A. 21st International Conference on Engineering Design, Vancouver, British Columbia, Canada. 2017. Evaluation and management of customer feedback to include market dynamics into product development: Satisfaction Importance Evaluation (SIE) model. [Google Scholar]
- Gupta, R. K., Belkadi, F., & Bernard, A. (2017a). Adaptation of European product to emerging markets: modular product development. In 15ème Colloque national AIP-PRIMECA, La Plagne, France.
- Gupta R.K., Gurumoorthy B. A feature-based framework for semantic interoperability of product models. SV – Journal of Mechanical Engineering. 2008;54(6):446–457. [Google Scholar]
- Gupta R.K., Gurumoorthy B. International Conference on Product Lifecycle Management, Bath (UK), PLM-SP5. 2009. Shape-function-relationship (SFR) framework for semantic interoperability of product model; pp. 150–162. ISBN 0-907776-49-3. [Google Scholar]
- Gupta R.K., Gurumoorthy B. IFIP International Conference on Product Lifecycle Management, IFIP AICT, 409. Springer; Berlin Heidelberg: 2013. Unified taxonomy for reference ontology of shape features in product model; pp. 295–307. [Google Scholar]
- Hauser J.R., Clausing D. The house of quality. Harvard Business Review. 1988;66:63–73. [Google Scholar]
- Jiao J.R., Simpson T.W., Siddique Z. Product family design and platform-based product development: A state-of-the-art review. Journal of intelligent Manufacturing. 2007;18(1):5–29. [Google Scholar]
- Jiao J., Tseng M.M. Fundamentals of product family architecture. Integrated Manufacturing Systems. 2000;11(7):469–483. [Google Scholar]
- Kano N., Seraku N., Takahashi F., Tsuji S. Attractive quality and must-be quality. Hinshitsu: The Journal of the Japanese Society for Quality Control. 1984;14(2):39–48. [Google Scholar]
- Kaplan R., Norton D. The balanced scorecard: measures that drive performance. Harvard Business Review. 1992;70(1):71–99. [PubMed] [Google Scholar]
- Kim, S., Ahmed, S., & Wallace, K. M. (2006). Improving document accessibility through ontology-based information sharing. In Proc. International Symposium series on Tools and Methods of Competitive Engineering (TMCE 2006), Slovenia.
- Kleiber, M., Weltjen, B., Alexander, T., & Schlick, C.M. (2012). Evaluation of augmented reality navigation support for maintenance personnel. In ISWC 2012, Adjunct proceedings <http://www.iswc.net/iswc12/ISWC2012_AdjunctProceedings.pdf>.
- Luce R.D., Tukey J.W. Simultaneous conjoint measurement: A new type of fundamental measurement. Journal of Mathematical Psychology. 1964;1(1):1–27. [Google Scholar]
- Microsoft HoloLens, <https://www.microsoft.com/hololens> (Accessed 27.04.2017).
- Mo J.P.T., Sigit A., Myers K. Development of a product model for manufacturing planning and control in a made-to-order business. Journal of Manufacturing Technology Management. 2008;20(1):97–112. [Google Scholar]
- Mostefai S., Bouras A., Batouche M. Effective collaboration in product development via a common sharable ontology. International Journal of Computational Intelligence. 2005;2:206–212. [Google Scholar]
- Murmann J.P., Frenken K. Toward a systematic framework for research on dominant designs, technological innovations, and industrial change. Research Policy. 2006;35:925–952. [Google Scholar]
- Norman G. Likert scales, levels of measurement and the “laws” of statistics. Advances in Health Sciences Education. 2010;15(5):625–632. doi: 10.1007/s10459-010-9222-y. [DOI] [PubMed] [Google Scholar]
- Osterwalder A., Pigneur Y. John Wiley & Sons; 2010. Business model generation: a handbook for visionaries, game changers, and challengers. [Google Scholar]
- Patil L., Dutta D., Sriram R. Ontology-based exchange of product data semantics. IEEE Transactions on Automation Science and Engineering. 2005;2(3):213–225. [Google Scholar]
- Pimmler, T. U., & Eppinger, S. D. (1994). Integration analysis of product decompositions. In ASME Design Theory and Methodology Conference, vol. 68, (pp. 343-351).
- Porter M.E. How competitive forces shape strategy. Harvard Business Review. 1979:2–10. [PubMed] [Google Scholar]
- ProRegio (2017). Customer-driven design of product-services and production networks to adapt to regional market requirements. European Union’s Horizon 2020 research and innovation project, 2015–2017. <http://www.h2020-proregio.eu/>. (Accessed 27.04.2017).
- Sako M. The business of systems integration. Oxford University Press; New York: 2002. Modularity and outsourcing: The nature of co-evolution of product architecture and organisation architecture in the global automotive industry; pp. 229–253. [Google Scholar]
- SN Technics GmbH. <http://www.kontron.de/resources/applicationstories/pdf/application-story---i-boro_eng.pdf> (Accessed 27/04/2017).
- SODALIS solution platform. <https://www.beeware.de/de/hardware-ruggedized-communicator/> (Accessed 27.04.2017).
- Szykman S., Sriam R.D., Regli W.C. The role of knowledge in next-generation product development systems. Journal of Computing and Information Science in Engineering. 2001;1(3):3–11. [Google Scholar]
- Ucler C., Vayvay O., Cobanoglu E. Customer-focused product development and a case study in Turkish refrigerator market. Istanbul Ticaret Üniversitesi Fen Bilimleri Dergisi. 2006;5(10):81–97. [Google Scholar]
- Ulrich K. The role of product architecture in the manufacturing firm. Research Policy. 1995;24(3):419–440. [Google Scholar]
- Ulrich K.T., Eppinger S.D. 3rd ed. McGraw-Hill; New York: 2004. Product design and development. [Google Scholar]
- Unity game engine, <https://unity3d.com> (Accessed 27.04.2017).
- Violante M.G., Vezzetti E. Kano qualitative vs quantitative approaches: An assessment framework for products attributes analysis. Computers in Industry. 2017;86:15–25. [Google Scholar]
- Vuforia augmented reality platform, <https://www.vuforia.com/> (Accessed 27.04.2017).
- Wang C.H., Wu C.W. Combining conjoint analysis with Kano model to optimize product varieties of smart phones: A VIKOR perspective. Journal of Industrial and Production Engineering. 2014;31(4):177–186. [Google Scholar]
- Wensveen J.G. 2ed ed. Krieger; Malabar: 2007. Wheels up: Airline business plan development. [Google Scholar]
- Wensveen J.G., Leick R. The long-haul low-cost carrier: A unique business model. Journal of Air Transport Management. 2009;15(3):127–133. [Google Scholar]
- Woodruff R.B. Customer value: The next source for competitive advantage. Journal of the Academy of Marketing Science. 1997;25(2):139–153. [Google Scholar]
- Zeschky M., Widenmayer B., Gassmann O. Frugal innovation in emerging markets. Research-Technology Management. 2011;54(4):38–45. [Google Scholar]
- Zhang X., Auriol G., Eres H., Baron C. A prescriptive approach to qualify and quantify customer value for value-based requirements engineering. International Journal of Computer Integrated Manufacturing. 2013;26(4):327–345. [Google Scholar]