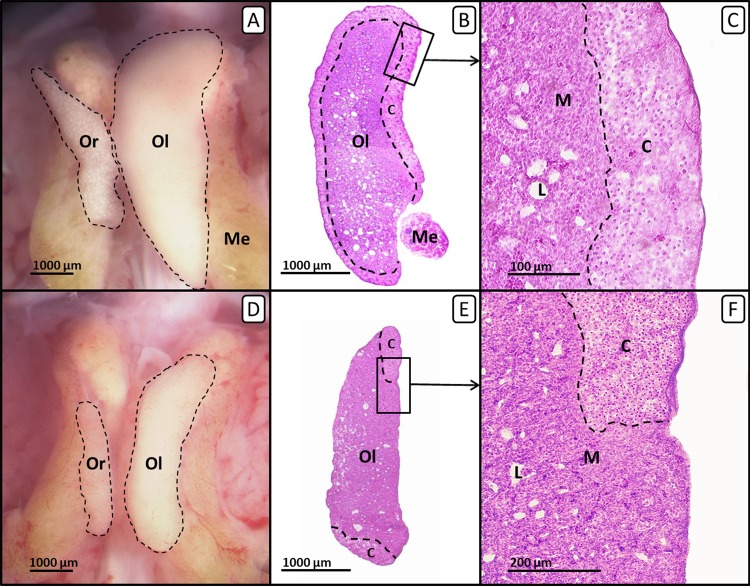
Figure 4. Right and left ovary of genetic females of untreated control group and tamoxifen-treated group on day 19 of embryonic development.
Right and left ovary of genetic females of untreated control group (A, B, C) and tamoxifen-treated group (10 µg/g egg; D, E, F). (A, D) Unfixed right (“Or”) and left (“Ol”) ovary (outlined in black) on day 19 of embryonic development. Untreated control females (A) show a regressed right ovary and a well-differentiated left ovary. Tamoxifen-treated females (D) show an unaffected right ovary and a significantly decreased left ovary. (B, E) Histological thin sections (6 µm) of right (“Or”) and left (“Ol”) ovary. Untreated control females (B) show a left ovary of female typical size and structure. The left ovarian cortex (“C”) is well-differentiated and covers almost the whole ovary (except the region close to the mesonephron (“Me”)). Tamoxifen-treated females (E) show a significantly decreased left ovary with an altered distribution of the cortex region (“C”). The left ovary is no longer covered by a continuous cortex but exposes large regions of uncovered medulla, partly resembling a male testis. (C, F) Histological thin sections (6 µm) of the left ovary in close-up. Untreated control females (C) show a well-differentiated continuous ovarian cortex region (“C”) and a loosely arranged medulla (“M”) crossed by lacunar channels (“L”). Tamoxifen-treated females (F) show a discontinuous irregular scattered ovarian cortex region (“C”) with larger regions of uncovered medulla (“M”) crossed by lacunar channels (“L”).

