Abstract
Background
Cerebral blood volume (CBV) mapping with dynamic susceptibility contrast (DSC) perfusion technique has become a clinical tool in diagnosing and follow-up brain tumors. Ferumoxytol, a long-circulating iron oxide nanoparticle has been tested for CBV mapping, but the optimal dose has not been established.
Purpose
To compare ferumoxytol DSC of two different doses to standard of care gadoteridol by analyzing time-intensity curves and CBV maps in normal appearing brain regions.
Study type
retrospective.
Subjects
Fifty-four patients with various brain disorders
Field Strength/Sequence
3T MR. DSC-MRI was performed with 0.1 mmol/kg gadoteridol and one day later with ferumoxytol in doses of 1- or 2mg/kg.
Assessment
Signal changes during first pass, relative CBV (rCBV) in normal appearing thalamus, putamen and globus pallidus and contrast to noise ratio (CNR) of the CBV maps were compared between gadoteridol and various doses of ferumoxytol using an automated method. To subjectively assess the quality of the CBV maps, two blinded readers also assessed visual conspicuity of the putamen.
Statistical tests
Linear mixed effect model was used for statistical comparison.
Results
Compared to gadoteridol, 1mg/kg ferumoxytol showed no difference in CNR (p=0.6505), peak ΔR2* and rCBV in the putamen (p=0.2669, 0.0871) or in the thalamus (p=0.517, 0.9787); 2mg/kg ferumoxytol increased peak ΔR2* as well as the CNR (p<0.0001), but also mildly increased rCBV in putamen and globus pallidus (p=0.0005, 0.0012). Signal intensities during first pass remained highly above noise level, with overlapping of 95% CIs with noise only in 3 out of 162 tested regions. Compared to gadoteridol the visual image quality showed mild improvement with 1mg/kg (p=0.02) and marked improvement with 2mg/kg ferumoxytol (p<0.0001).
Data conclusion
1mg/kg ferumoxytol provides similar imaging results to standard gadoteridol for DSC-MRI, and 2mg/kg has a benefit of increased CNR, but may also result in mildly increased rCBV values.
Keywords: ferumoxytol, dynamic susceptibility contrast, cerebral blood volume, contrast agent, neuroradiology
INTRODUCTION
Dynamic susceptibility contrast (DSC) MR perfusion technique is the most commonly applied perfusion MRI technique in the clinical practice (1,2), and gaining increasing importance in follow-up of brain tumors (3,4). A large body of literature is available using DSC-derived cerebral blood volume (CBV) maps with gadolinium to differentiate true tumor progression from treatment related inflammatory changes, called pseudoprogression, which may be indistinguishable on anatomical MR images (5). While the accuracy of DSC perfusion and CBV calculation is relatively high within an institution, the threshold CBV values to differentiate high vs. low vascularity may vary widely among institutions (5).
DSC uses repeated acquisitions of rapid T2*-weighted images to track signal intensity changes as a short bolus of contrast agent passes through the brain. Gadolinium based contrast agents (GBCA) are most often used, as these exhibit sufficient T2* effects at high concentrations. GBCAs are generally safe, and nephrogenic systemic fibrosis (NSF) remains a very rare complication (6,7). For DSC, GBCAs are far from optimal agents as the contrast agent leaks into the interstitial space and produces unwanted T1 effects which confound the ideally T2*-weighted DSC signal. Therefore various advanced processing and leakage correction methods are proposed, which often contribute to the variability of results (8). In addition, gadolinium deposition in the deep grey matter structures is a recently described concern, though its clinical impact is still unknown (9,10). Therefore there is a clinical need in exploring alternative contrast agents (11).
Iron based contrast agents are viable alternatives. Ferumoxytol is a macromolecular, carbohydrate coated iron oxide particle, which has been extensively studied as an MR imaging contrast agent (12). Ferumoxytol is marketed as Feraheme® for iron replacement in adult patients with renal failure, and is sometimes used off label as an MR imaging agent. Blood pool distribution early after injection is beneficial in imaging the intravascular space (13–17). Ferumoxytol has been tested in cerebral DSC perfusion imaging, showing great potential in differentiating progression from pseudoprogression with the advantage that leakage correction is unnecessary (18,19). Still, the effect of various ferumoxytol doses on time intensity curves, CBV maps and relative CBV (rCBV) values compared to gadolinium is unknown. Establishing an optimal ferumoxytol dose for DSC is relevant both clinically and scientifically and may help standardizing CBV mapping as a true intravascular agent.
The purpose of this study was to compare ferumoxytol DSC with two different doses to gadolinium DSC by analyzing time-intensity curves and CBV maps in normal appearing brain regions.
MATERIALS AND METHODS
Subjects
This study reviewed 54 subjects (36 males, 18 females, mean age ±SD 53.65±14.26 years) with focal cerebral pathologies to evaluate perfusion imaging in normal appearing brain regions. Out of 54 subjects, 34 had brain tumors (22 glioblastomas, 3 high grade gliomas, 3 low grade gliomas, 1 ependymoma, 1 pituitary adenoma and 4 metastases), and 20 subjects had non-tumoral disorders (stroke, multiple sclerosis, cavernoma, other vascular lesions). All subjects gave informed consent and were enrolled in one of four institutional review board approved imaging protocols. (clinicaltrials.gov identifiers: NCT00659776, NCT00660543, NCT00659126, NCT00769093). These protocols were common in study design, including MR perfusion imaging using gadoteridol (ProHance, Bracco Diagnostic Inc., Princeton, NJ) on day 1, and using ferumoxytol (Feraheme, AMAG Pharmaceuticals Inc. Cambridge, MA) on day 2. Subjects were enrolled in this analysis if evaluable MR sequences including anatomical scans, DSC perfusion with gadolinium and ferumoxytol were available. In longitudinal studies only the first imaging time point was included in this analysis. All subjects had a glomerular filtration rate higher than 50 ml/min/1.73m2.
Contrast Agents
Contrast agents were injected using a dual syringe power injection, (Medrad®, Spectris Solaris®, Bayer Healthcare Inc, Whippany, NJ) with the first syringe filled with contrast agent, and the second with saline. Gadoteridol was administered using the 0.1 mmol/kg standard dose. Ferumoxytol was given either in a 2 mg/kg dose (17 subjects), or as a total dose of 75mg (37 subjects), depending on the protocol. The latter group was considered as a 1 mg/kg dose ferumoxytol group (mean ferumoxytol dose per body weight ±SD: 0.91±0.23 mg/kg). Ferumoxytol was 1:1 diluted with normal saline, resulting in 15mg/ml iron concentration.
To evaluate for potential saturation of peak amplitude during first pass, dose was also expressed as mg injected contrast agent per total circulating blood volume estimated using the Nadler’s formula (20):
| (1) |
| (2) |
where Ht denotes the height in meters, and Wt is the body weight in kilograms.
MR Imaging
All MRI scans were performed on an FDA approved 3T scanner (TIM Trio, Siemens, Erlangen, Germany) using a 12 channel receive-only head coil.
For anatomical imaging, T2-weighted 2D turbo spin echo (TR/TE: 9000/97 ms, flip angle 140°, field of view 180 × 240 mm2, matrix 192 × 256, 44 axial slices, slice thickness 2 mm, gapless), pre and post-gadoteridol T1-weighted 3D magnetization-prepared rapid gradient-echo (MPRAGE) (TR/TE/TI: 2300/3/900 ms, flip angle 12°, field of view 180/240 mm2, matrix 192 × 256, 128 axial slices, slice thickness 1 mm with no gap) sequences were acquired.
Perfusion MRI was acquired using the DSC technique with a 2D gradient echo, echo planar imaging sequence (TR/TE: 1500/20 ms, flip angle 45°, field of view 192 × 192 mm2, matrix 64 × 64, 27 axial slices, slice thickness 3 mm with 0.9 mm gap. Each contrast agent was injected as a bolus with a flow rate of 3ml/s, followed by 20ml saline flush with the same flow rate.
Image Processing
Calculation of perfusion maps
DSC scans were processed on an offline workstation using NordicICE (version 2.3, NordicNeuroLab, Bergen, Norway), a dedicated processing software. To evaluate peak ΔR2* caused by the contrast bolus, a pre-bolus (DSCpre) image and an image with the lowest signal intensity (DSCmin) during the first pass (based on a slice through the basal ganglia) were extracted for analysis (Figure 1A). ΔR2*-time curves were used for further processing, which is assumed to be proportional with the tracer concentration (Figure 1B, C). After motion correction, CBV maps were calculated as the area under the ΔR2*(t) curve. No temporal or spatial smoothing was used to limit any potential confounding effect on the data Gadoteridol-derived CBV maps were calculated with a standard leakage-correction method (21,22) and ferumoxytol- derived CBV maps without leakage correction were produced.
Figure 1.
Signal intensity-time (A) and derived ΔR2*-time (B) curves show changes within the putamen and white matter, caused by 1 mg/kg ferumoxytol bolus. ΔR2*-time curves using standard dose gadoteridol bolus (C) show similar changes during first pass. Note the steady state ΔR2* values (reflecting plasma concentration of ferumoxytol) at the tail of the curve and its gadolinium counterpart with decreasing values at the tail.
Co-Registration
DSCpre scans were co-registered to the anatomical T1-weighted MPRAGE images with 6 degrees-of-freedom linear fit, correlation ratio cost function and trilinear interpolation using FSL FMRIB`s Linear Image Registration Tool (FLIRT) (23). Then, the transformation matrix of the CBV-to-MPRAGE co-registration was used to align the CBV maps and DSCmin image sets to the MPRAGE space (trilinear interpolation). Co-registration was visually inspected in each individual MRI set.
Volume Of Interest (VOI) Placement
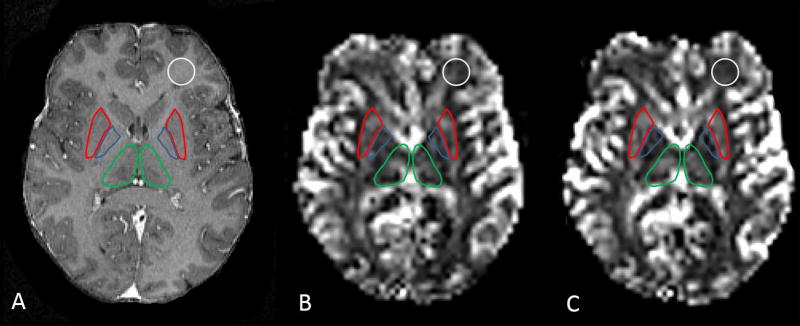
Three normal appearing subcortical structures, the thalamus, globus pallidus and putamen were segmented on T1- weighted MPRAGE images with an automatic algorithm using FMRIB’s Integrated Registration & Segmentation Tool (FIRST) (24). All automatically segmented VOIs were visually inspected to manually exclude any abnormal appearing regions based on T2- weighted images. Normal appearing white matter VOIs were prescribed manually in the frontal and occipital regions and in the centrum semiovale using MIPAV (Medical Image Processing, Advanced Visualization, version 6.01, National Institute of Health, mipav.cit.nih.gov/) (25). Figure 2 illustrates VOIs. VOIs were applied on all co-registered CBV maps, DSCpre and DSCmin image sets.
Figure 2.
VOIs of thalamus (green), putamen (red) and globus pallidus (blue) and white matter (white) displayed on T1 weighted MPRAGE image (A). Grayscale coregistered CBV maps of the same patient with gadoteridol (B) and ferumoxytol (C).
ΔR2*max, CNR and rCBV Calculation
DSCpre and DSCmin image sets were used to calculate ΔR2*max in each VOI using the formula:
| (1) |
in which SIpre and SImin indicate the mean signal intensities on DSCpre and DSCmin images, TE is the echo time (26). CNR of CBV maps was calculated in the putamen because it is a fairly homogenous structure, and has clearly higher rCBV than the white matter. CNR was calculated using the formula:
| (2) |
where μ indicates the mean CBV value and σ is the standard deviation of CBV value in the corresponding VOIs on the CBV maps (27). Relative CBV values were obtained by dividing the mean CBV values of the thalamus, globus pallidus and putamen by mean CBV in white matter.
Visual Assessment of CBV Maps
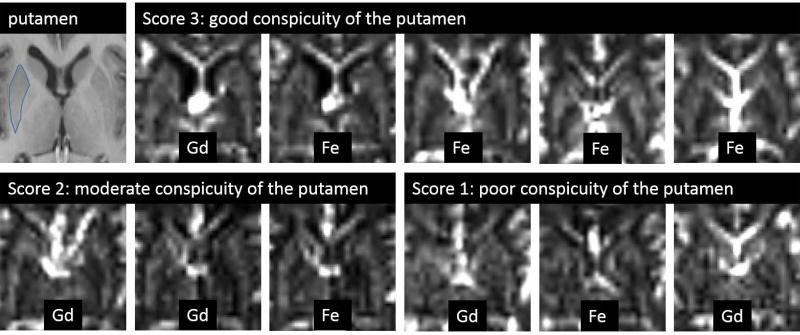
Anonymized CBV map pairs, obtained with gadolinium and ferumoxytol, coregistered to MPRAGE image, were read by two independent readers (CV, and AH, with 15 and 5 years of experience in image analysis respectively). Readers were blinded to contrast agent information. Conspicuity of the putamen was evaluated using a three point scale scoring system: 1 (poor conspicuity): difficult to identify the putamen; 2 (moderate conspicuity): the putamen can be identified, but appears heterogeneous; 3 (good conspicuity): putamen is well identified as a fairly homogeneous structure.
Statistical Analysis
ΔR2*, CNR and rCBV values in all normal appearing brain region VOIs, visual conspicuity of the putamen were compared among gadoteridol, 1 mg/kg, and 2 mg/kg ferumoxytol doses using a linear mixed effects model with adjustment for multiple comparisons using the Tukey-Kramer method. In order to determine whether the signal dropout caused by high dose of ferumoxytol reaches noise level, the 95% confidence intervals (CIs) of the mean minimal signal intensities during the first pass of ferumoxytol at various doses and the 95% CI of the image noise were qualitatively compared. P value < 0.05 was considered statistically significant. All analyses were performed using SAS 9.2 (SAS Institute Inc., Cary, NC, USA).
RESULTS
Table 1 (supplementary material) presents the mean peak ΔR2* and mean rCBV values in deep grey matter structures with gadoteridol and with two different doses of ferumoxytol.
Peak ΔR2*
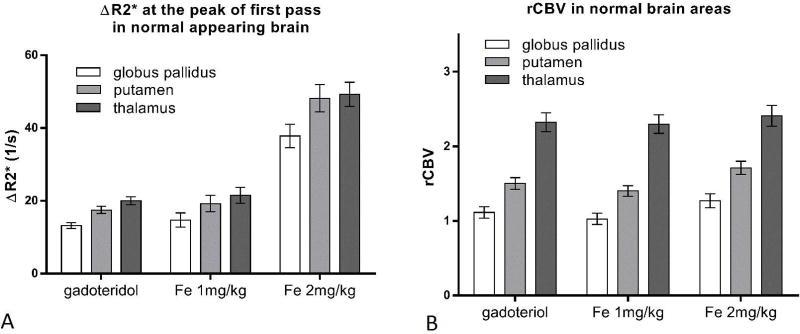
Peak ∆R2* was not significantly different between 1 mg/kg ferumoxytol and gadoteridol in any of the investigated regions (p>0.05). (Figure 3A) On the other hand, ΔR2* values were higher with 2 mg/kg ferumoxytol (p<0.0001).
Figure 3.
A: Bar graph showing mean ΔR2* values at the peak of first pass with gadoteridol, 1 mg/kg and 2 mg/kg ferumoxytol in the thalamus, putamen and globus pallidus. B: Bar graph showing mean rCBV values with gadoteridol, 1 mg/kg and 2 mg/kg ferumoxytol in the thalamus, putamen and globus pallidus. Error bars indicate the 95% CI. N=54.
rCBV
The 1 mg/kg dose of ferumoxytol provided similar rCBV values to gadoteridol, without significant difference in the putamen or thalamus (p=0.0871 and p=0.9787, respectively) and minimal difference in the globus pallidus (p=0.0204) (Figure 3B). 2 mg/kg ferumoxytol provided mildly higher rCBV values both in the globus pallidus and putamen compared to gadoteridol (p=0.0012 and p=0.0005, respectively) or compared to 1 mg/kg ferumoxytol (p<0.0001). In the thalamus, rCBV values were not significantly different among contrast agents (2 mg/kg ferumoxytol vs. gadoteridol: p=0.7453) and ferumoxytol doses (p=0.3600).
Minimal signal intensities
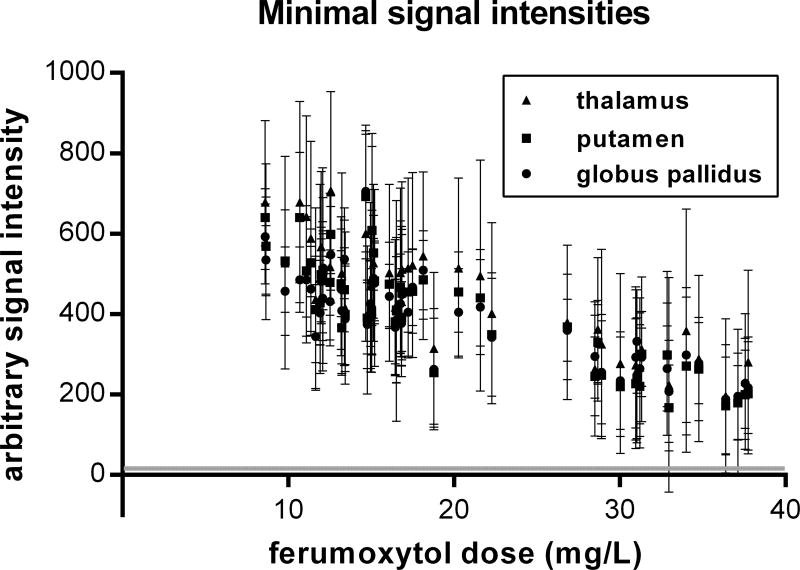
Noise level was 15.8 ± 3.2, (Mean ± SD), based on measurements from the four corners of ten DSC images from different subjects. The mean minimal signal intensities during the first pass of ferumoxytol remained highly above noise level for any time-course data even with 2 mg/kg ferumoxytol dose (Fig. 4). Only 3 VOIs (all in the thalamus) out of the 162 VOIs (thalamus, putamen, globus pallidus in 54 subjects) yielded 95% CIs that overlapped with the 95% CI of the noise.
Figure 4.
Minimal signal intensities in normal appearing deep gray matter regions (N=162 total) during the first pass of the ferumoxytol bolus with the agent doses adjusted for total circulating blood volume. Error bars indicate the 95% CI of the means. The mean minimal signal intensities remained highly above noise level, and only 3 thalamic VOI means were associated with 95% CIs overlapped with the 95% CI of the noise (grey horizontal line).
CNR
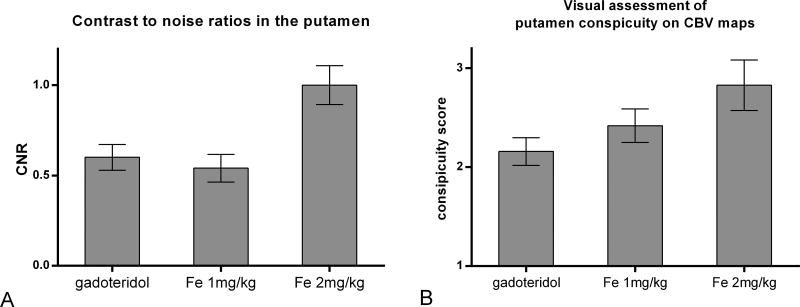
Differences of CNR values in normal appearing deep grey matter structures with gadoteridol and ferumoxytol with two different doses are presented in figure 5A. CNR in the putamen was similar between 1 mg/kg ferumoxytol and gadoteridol (p=0.6505). Compared to gadoteridol (CNR=0.60) and 1 mg/kg ferumoxytol (CNR=0.57), 2 mg/kg ferumoxytol increased the mean CNR values significantly to 0.93 (p<0.0001).
Figure 5.
Bar graph shows mean CNR values measured in the putamen vs. white matter (A) and mean visual conspicuity score of the putamen (B) of the CBV maps with gadoteridol, 1 mg/kg and 2 mg/kg ferumoxytol. Error bars indicate 95% confidence interval.
Visual assessment of CBV maps
The two independent readers, blinded to contrast agent information, evaluated the conspicuity of putamen (Figure 6) with overall weighted kappa of 0.54 (SE 0.07), indicating moderate agreement (28). Assessment of ferumoxytol CBV maps showed good agreement with weighted Kappa of 0.64 (0.09), while gadolinium CBV maps were read with fair interrater agreement with weighted Kappa of 0.39 (0.11). Averaged scores of visual assessment of the two readers were 2.16 (0.07) with gadolinium and mildly increased to 2.42 (0.08) with 1 mg/kg ferumoxytol (p=0.02), and markedly increased to 2.83 (0.12) with 2 mg/kg ferumoxytol (p<0.0001). (Figure 5B)
Figure 6.
Conspicuity of the putamen assessed visually. The putamen, outlined on the first (MPRAGE) image shows different conspicuity of the grayscale CBV maps as demonstrated by representative examples rated by reader 1.
DISCUSSION
Perfusion weighted MRI may provide additional information in cerebrovascular diseases, as well as in brain tumors. There is a substantial variability in available image acquisition techniques, post processing methods and contrast agent administration protocols. Intravascular, blood pool contrast agents are theoretically beneficial when assessing the intravascular space, since imaging changes arise only from tracer inside the vessels. Ferumoxytol DSC MRI has been explored in earlier studies and showed benefit over gadolinium based contrast agent in the assessment of tumor blood volume (18,19). This study revealed that 1 mg/kg of 1:1 diluted ferumoxytol bolus is equivalent with 0.1mmol/kg gadolinium bolus injected at a 3ml/sec flow rate: signal changes during first pass, rCBV values and CNR are essentially the same.
Normal appearing cerebral structures are often used when comparing techniques (29,30).
The method applied in this current study aimed to minimize observer bias, by using automated segmentation of the deep gray matter structures, which was applied to both ferumoxytol and gadolinium DSC maps. The white matter selection based on T1 weighted MPRAGE image was the only manual step, and these volumes of interests were applied on both CBV maps without further manual adjustments.
With administration of higher doses of paramagnetic contrast agent, signal intensities may reach noise level which results in biased CBV values (31). Therefore, in this study we investigated the minimal signal intensities during the first pass of ferumoxytol with different doses. Even in the higher 2 mg/kg dose group, signal intensities remained highly above noise level, with overlapping of 95% CIs with noise only in 3 thalamic VOIs, showing that perfusion MRI with 2 mg/kg dose ferumoxytol is feasible. The higher dose ferumoxytol causing stronger signal drop resulted in improved CNR, thus better visual discrimination capability. In theory higher CNR may allow higher image resolution or better differentiation of normal and pathologic structures, which may be useful to detect subtle rCBV differences. We found, that 2 mg/kg for DSC imaging has the drawback of providing mildly different rCBV values compared to gadoteridol. This difference likely arises from the assumption that the transverse relaxation rate difference (ΔR2*) is linearly proportional with the tissue contrast agent concentration. The shape of the first pass curve, blooming of larger vessels during first pass and the post processing algorithm may also contribute to these differences. To overcome the issues related to dynamic imaging, high resolution steady state CBV mapping may be considered, which requires higher ferumoxytol doses, but no bolus administration. (13)
We added a subjective method to assess the quality of the CBV maps, using two independent readers, blinded to contrast agent information. There was mild improvement in the visual conspicuity of the putamen with 1 mg/kg ferumoxytol, and marked improvement with 2 mg/kg ferumoxytol compared to gadolinium, indicating the advantage of using higher ferumoxytol dose. Clinical radiology practices often evaluate CBV maps solely based on color maps without measuring actual CBV values, therefore increased visual conspicuity is a practical clinical value.
A possible limitation of the study were: 1) that normal appearing brain areas were analyzed in patients with known focal brain pathologies. To minimize errors, VOIs were carefully visually analyzed on T2 weighted images and pathological areas were excluded. 2) Subjects in this study may have undergone various therapies (including chemotherapy and radiation) prior to imaging, therefore even normal appearing brain may have had altered blood volume. Since paired data were used during analysis for this contrast agent comparison study, the various treatment-related changes likely have affected the compared variables evenly. 3) The automatic segmentation of deep grey matter structures was based on MPRAGE images. Blooming artifact from adjacent larger vessels on DSC images may have affected the value measured in the VOI. This was most prominently observed in the posterior thalamus, and likely affected the scans with ferumoxytol and gadolinium similarly. 4) Another limitation is that only a single TR, TE, and flip angle combination was available in this study, which is very common in the clinical practice.
Currently the FDA recommends against rapid administration of ferumoxytol. While the prior prescribing information of Feraheme® allowed rapid bolus injection of the total 510mg of ferumoxytol as fast as in 17 seconds, since the March 2015 the prescribing information recommends slow infusion of the total dose over 15 minutes. This change was made to mitigate the potential risk and morbidity of hypersensitivity reactions (32). When used off label for imaging, the diagnostic information gained through bolus injection of 1 or 2 mg/kg, which is a small fraction of the therapeutic dose, likely overweigh the potential small increased risk of hypersensitivity.
In conclusion, this study demonstrates that 1 mg/kg (about 75 mg Fe) ferumoxytol bolus is similar to standard dose of gadoteridol (>1000 mg of Gd) for DSC imaging. This dose likely provides the best comparison of literature data with perfusion MRI using standard gadolinium. Also, 1 mg/kg is likely safer than bolus injection of larger doses, although there are currently no data to support increased risk of adverse reactions due to small bolus injected doses. Still, the improved CNR and better subjective visualization of structures may justify higher doses, such as 2 mg/kg. Ferumoxytol is a viable option for MR imaging, including DSC perfusion, in the event of contraindication of currently approved contrast agents due to impaired renal function, or a concern for potential long term effects of gadolinium tissue deposition.
Supplementary Material
Acknowledgments
Grant Support:
This work was supported in part by National Institutes of Health grants NS053468, CA199111, and CA137488-15S1, in part with Federal funds from the National Cancer Institute, National Institutes of Health, under Contract No. HHSN261200800001E, the Walter S. and Lucienne Driskill Foundation, and by a Veterans Administration Merit Review grant, all to EAN. Additional support was provided by a National Institute of Biomedical Imaging and Bioengineering grant 1R25EB016671 to CV.
References
- 1.Essig M, Shiroishi MS, Nguyen TB, et al. Perfusion MRI: the five most frequently asked technical questions. AJR American journal of roentgenology. 2013;200(1):24–34. doi: 10.2214/AJR.12.9543. [DOI] [PMC free article] [PubMed] [Google Scholar]
- 2.Welker K, Boxerman J, Kalnin A, et al. ASFNR recommendations for clinical performance of MR dynamic susceptibility contrast perfusion imaging of the brain. AJNR Am J Neuroradiol. 2015;36(6):E41–51. doi: 10.3174/ajnr.A4341. [DOI] [PMC free article] [PubMed] [Google Scholar]
- 3.Mabray MC, Barajas RF, Jr, Cha S. Modern brain tumor imaging. Brain Tumor Res Treat. 2015;3(1):8–23. doi: 10.14791/btrt.2015.3.1.8. [DOI] [PMC free article] [PubMed] [Google Scholar]
- 4.Telles BA, D'Amore F, Lerner A, Law M, Shiroishi MS. Imaging of the Posttherapeutic Brain. Top Magn Reson Imaging. 2015;24(3):147–154. doi: 10.1097/RMR.0000000000000051. [DOI] [PubMed] [Google Scholar]
- 5.Patel P, Baradaran H, Delgado D, et al. MR perfusion-weighted imaging in the evaluation of high-grade gliomas after treatment: a systematic review and meta-analysis. Neuro Oncol. 2017;19(1):118–127. doi: 10.1093/neuonc/now148. [DOI] [PMC free article] [PubMed] [Google Scholar]
- 6.Thomsen HS, Morcos SK, Dawson P. Is there a causal relation between the administration of gadolinium based contrast media and the development of nephrogenic systemic fibrosis (NSF)? Clinical radiology. 2006;61(11):905–906. doi: 10.1016/j.crad.2006.09.003. [DOI] [PubMed] [Google Scholar]
- 7.Todd DJ, Kay J. Gadolinium-Induced Fibrosis. Annual review of medicine. 2016;67:273–291. doi: 10.1146/annurev-med-063014-124936. [DOI] [PubMed] [Google Scholar]
- 8.Paulson ES, Schmainda KM. Comparison of dynamic susceptibility-weighted contrast-enhanced MR methods: recommendations for measuring relative cerebral blood volume in brain tumors. Radiology. 2008;249(2):601–613. doi: 10.1148/radiol.2492071659. [DOI] [PMC free article] [PubMed] [Google Scholar]
- 9.Kanda T, Fukusato T, Matsuda M, et al. Gadolinium-based Contrast Agent Accumulates in the Brain Even in Subjects without Severe Renal Dysfunction: Evaluation of Autopsy Brain Specimens with Inductively Coupled Plasma Mass Spectroscopy. Radiology. 2015:142690. doi: 10.1148/radiol.2015142690. [DOI] [PubMed] [Google Scholar]
- 10.McDonald RJ, McDonald JS, Kallmes DF, et al. Intracranial Gadolinium Deposition after Contrast-enhanced MR Imaging. Radiology. 2015:150025. doi: 10.1148/radiol.15150025. [DOI] [PubMed] [Google Scholar]
- 11.Wesolowski JR, Kaiser A. Alternatives to GBCA: Are We There Yet? Topics in magnetic resonance imaging : TMRI. 2016;25(4):171–175. doi: 10.1097/RMR.0000000000000096. [DOI] [PubMed] [Google Scholar]
- 12.Bashir MR, Bhatti L, Marin D, Nelson RC. Emerging applications for ferumoxytol as a contrast agent in MRI. J Magn Reson Imaging. 2015;41(4):884–898. doi: 10.1002/jmri.24691. [DOI] [PubMed] [Google Scholar]
- 13.Varallyay CG, Nesbit E, Fu R, et al. High-resolution steady-state cerebral blood volume maps in patients with central nervous system neoplasms using ferumoxytol, a superparamagnetic iron oxide nanoparticle. J Cereb Blood Flow Metab. 2013;33(5):780–786. doi: 10.1038/jcbfm.2013.36. [DOI] [PMC free article] [PubMed] [Google Scholar]
- 14.Neuwelt EA, Várallyay CG, Manninger S, et al. The potential of ferumoxytol nanoparticle magnetic resonance imaging, perfusion, and angiography in central nervous system malignancy: a pilot study. Neurosurgery. 2007;60(4):601–611. doi: 10.1227/01.NEU.0000255350.71700.37. discussion 611-602. [DOI] [PubMed] [Google Scholar]
- 15.Finn JP, Nguyen KL, Han F, et al. Cardiovascular MRI with ferumoxytol. Clinical radiology. 2016;71(8):796–806. doi: 10.1016/j.crad.2016.03.020. [DOI] [PMC free article] [PubMed] [Google Scholar]
- 16.Luhar A, Khan S, Finn JP, et al. Contrast-enhanced magnetic resonance venography in pediatric patients with chronic kidney disease: initial experience with ferumoxytol. Pediatr Radiol. 2016;46(9):1332–1340. doi: 10.1007/s00247-016-3605-z. [DOI] [PMC free article] [PubMed] [Google Scholar]
- 17.Nayak AB, Luhar A, Hanudel M, et al. High-resolution, whole-body vascular imaging with ferumoxytol as an alternative to gadolinium agents in a pediatric chronic kidney disease cohort. Pediatr Nephrol. 2015;30(3):515–521. doi: 10.1007/s00467-014-2953-x. [DOI] [PMC free article] [PubMed] [Google Scholar]
- 18.Gahramanov S, Muldoon LL, Varallyay CG, et al. Pseudoprogression of glioblastoma after chemo- and radiation therapy: diagnosis by using dynamic susceptibility-weighted contrast-enhanced perfusion MR imaging with ferumoxytol versus gadoteridol and correlation with survival. Radiology. 2013;266(3):842–852. doi: 10.1148/radiol.12111472. [DOI] [PMC free article] [PubMed] [Google Scholar]
- 19.Gahramanov S, Raslan AM, Muldoon LL, et al. Potential for differentiation of pseudoprogression from true tumor progression with dynamic susceptibility-weighted contrast-enhanced magnetic resonance imaging using ferumoxytol vs. gadoteridol: a pilot study. Int J Radiat Oncol Biol Phys. 2011;79(2):514–523. doi: 10.1016/j.ijrobp.2009.10.072. [DOI] [PMC free article] [PubMed] [Google Scholar]
- 20.Nadler SB, Hidalgo JH, Bloch T. Prediction of blood volume in normal human adults. Surgery. 1962;51(2):224–232. [PubMed] [Google Scholar]
- 21.Boxerman JL, Schmainda KM, Weisskoff RM. Relative cerebral blood volume maps corrected for contrast agent extravasation significantly correlate with glioma tumor grade, whereas uncorrected maps do not. AJNR Am J Neuroradiol. 2006;27(4):859–867. [PMC free article] [PubMed] [Google Scholar]
- 22.Boxerman JL, Prah DE, Paulson ES, Machan JT, Bedekar D, Schmainda KM. The Role of Preload and Leakage Correction in Gadolinium-Based Cerebral Blood Volume Estimation Determined by Comparison with MION as a Criterion Standard. AJNR American journal of neuroradiology. 2012;33(6):1081–1087. doi: 10.3174/ajnr.A2934. [DOI] [PMC free article] [PubMed] [Google Scholar]
- 23.Jenkinson M, Bannister P, Brady M, Smith S. Improved optimization for the robust and accurate linear registration and motion correction of brain images. NeuroImage. 2002;17(2):825–841. doi: 10.1016/s1053-8119(02)91132-8. [DOI] [PubMed] [Google Scholar]
- 24.Patenaude B, Smith SM, Kennedy DN, Jenkinson M. A Bayesian model of shape and appearance for subcortical brain segmentation. NeuroImage. 2011;56(3):907–922. doi: 10.1016/j.neuroimage.2011.02.046. [DOI] [PMC free article] [PubMed] [Google Scholar]
- 25.McAuliffe MJ, Lalonde FM, McGarry D, Gandler W, Csaky K, Trus BL. Medical Image Processing, Analysis & Visualization in Clinical Research. Proceedings of the Fourteenth IEEE Symposium on Computer-Based Medical Systems: IEEE Computer Society. 2001:381. [Google Scholar]
- 26.Wu EX, Wong KK, Andrassy M, Tang H. High-resolution in vivo CBV mapping with MRI in wild-type mice. Magn Reson Med. 2003;49(4):765–770. doi: 10.1002/mrm.10425. [DOI] [PubMed] [Google Scholar]
- 27.Haroon HA, Patankar TF, Zhu XP, et al. Comparison of cerebral blood volume maps generated from T2* and T1 weighted MRI data in intra-axial cerebral tumours. Br J Radiol. 2007;80(951):161–168. doi: 10.1259/bjr/17112059. [DOI] [PubMed] [Google Scholar]
- 28.Altman DG. Practical statistics for medical research. London ; New York: Chapman and Hall; 1991. p. 611. xii. [Google Scholar]
- 29.Griffiths PD, Wilkinson ID, Wels T, Hoggard N. Brain MR perfusion imaging in humans. Acta Radiol. 2001;42(6):555–559. [PubMed] [Google Scholar]
- 30.Christen T, Ni W, Qiu D, et al. High-resolution cerebral blood volume imaging in humans using the blood pool contrast agent ferumoxytol. Magn Reson Med. 2013;70(3):705–710. doi: 10.1002/mrm.24500. [DOI] [PubMed] [Google Scholar]
- 31.Calamante F, Morup M, Hansen LK. Defining a local arterial input function for perfusion MRI using independent component analysis. Magn Reson Med. 2004;52(4):789–797. doi: 10.1002/mrm.20227. [DOI] [PubMed] [Google Scholar]
- 32.Varallyay CG, Toth GB, Fu R, et al. What Does the Boxed Warning Tell Us? Safe Practice of Using Ferumoxytol as an MRI Contrast Agent. AJNR Am J Neuroradiol. 2017;38(7):1297–1302. doi: 10.3174/ajnr.A5188. [DOI] [PMC free article] [PubMed] [Google Scholar]
Associated Data
This section collects any data citations, data availability statements, or supplementary materials included in this article.


