

Abstract
Background & Aims
The presence of specific single nucleotide polymorphisms (SNPs) can be used to calculate an individual’s risk for colorectal cancer (CRC), called a genetic risk score (GRS). We investigated whether GRS can identify individuals with clinically relevant neoplasms in a screening colonoscopy population.
Methods
We derived a GRS based on 48 SNPs associated with CRC, identified in a comprehensive literature search. We obtained genetic data from 1043 participants (50–79 years old) in a screening colonoscopy study in Germany, recruited from 2005 through 2013 (294 with advanced neoplasms, 249 with non-advanced adenomas, and 500 without neoplasms). Each participant was assigned a GRS by aggregating their risk alleles (0, 1, or 2). Risk of advanced neoplasms and non-advanced adenoma according to GRS was calculated by multiple logistic regression. Risk advancement periods were calculated. We replicated our findings using data from a subset of the Tennessee Colorectal Polyp Study.
Results
An increased GRS was associated with higher prevalence of advanced neoplasms, but not non-advanced adenomas. Participants in the middle and upper tertile of GRSs had a 2.2-fold and 2.7-fold increase in risk, respectively, of advanced neoplasms compared to those in the lower tertile. Adjusted odds ratios (ORs) were 1.09 (95% CI, 0.76–1.57) for non-advanced adenoma in the middle tertile and 1.05 (95% CI, 0.70–1.55) for non-advanced adenoma in the upper tertile. The ORs were largest for proximal advanced neoplasms for participants in the middle tertile (OR, 3.55; 95% CI 1.85–6.82) and the upper tertile (OR, 3.61; 95% CI 1.84–7.10). The risk advancement period for medium vs low GRS was 13.4 years (95% CI 4.8–22.0) and for high vs low GRS was 17.5 years (95% CI, 7.8–27.3).
Conclusions
In a genetic analysis of participants in a CRC screening study in Germany, an increased GRS (based on CRC-associated SNPs) was associated with increased prevalence of advanced neoplasms. These findings might be used in defining risk-adapted screening ages.
Keywords: colon cancer, cohort, variant, predisposition
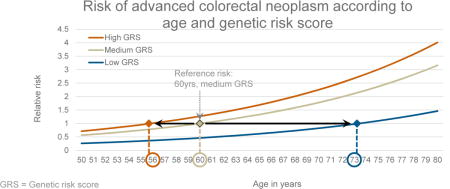
Graphical abstract
Background
Colorectal cancer (CRC) is the third most common cancer and the fourth most common cancer cause of death globally. Estimated numbers of incident cases and deaths in 2012 amounted to almost 1.4 million and 700,000, respectively1. Most CRCs slowly develop over many years through the adenoma-carcinoma sequence2, which provides unique opportunities for prevention by early detection and endoscopic removal of adenomas.
Randomized controlled trials (RCTs) have consistently demonstrated high effectiveness in prevention of CRC by flexible sigmoidoscopy (FS) through detection and removal of adenomas3, 4. Although results of RCTs on effectiveness of colonoscopy in preventing CRC are not available yet, evidence from epidemiological studies suggests even stronger protection5. However, adherence rates for both procedures are low and only a minority of participants, i.e. those in whom clinically relevant neoplasms are detected and removed, benefit from the procedure. Risk stratification that would enable tailoring offers of screening endoscopy according to risk of such neoplasms would therefore be highly welcome.
In recent years, genome-wide association studies (GWAS) have identified an increasing number of single nucleotide polymorphisms (SNPs) that are associated with increased CRC risk6–18. The combination of a large number of such SNPs in genetic risk scores (GRS) has been demonstrated to enable relevant risk stratification19–21. However, previous evidence is almost exclusively restricted to risk of CRC, whereas evidence on risk stratification for relevant CRC precursors sought for and removed at screening endoscopy is sparse.
In this study, we aimed to evaluate the potential of a GRS to predict presence of CRC and its major precursors, i.e. advanced adenomas, in a large population of participants of screening colonoscopy.
Material and Methods
Study population
Data for the analyses were drawn from the BLITZ study (Begleitende Evaluierung innovativer Testverfahren zur Darmkrebsfrüherkennung) which has been described in detail before22, 23. In brief, unselected participants of the German screening colonoscopy program are recruited by gastroenterology practices in southern Germany in this multicenter study. Participants of every age undergoing screening colonoscopy, which is reimbursed in the German health-care system since October 2002 to individuals aged ≥55 years, are informed about the study at a preparatory visit, usually one week prior to colonoscopy. Patients are invited to provide stool and blood samples prior to colonoscopy and to complete a standardized questionnaire. The ethics committees of the Medical Faculty Heidelberg of the University of Heidelberg and of the state physicians’ chambers of Baden-Württemberg, Rhineland-Palatinate and Hessia approved the study. Written informed consent is obtained from every participant. Since the end of 2005, more than 8,000 participants were recruited for the BLITZ study, which is still ongoing. This current analysis is based on a subset of patients aged 50–79 years recruited between 2005 and 2013 for whom both questionnaire and genomic data were available.
Data collection
Blood samples are provided by the patients at the preparatory visit. Information about previous colonoscopies, family history of CRC and other known CRC risk factors is obtained by a self-administered questionnaire. Specifically, participants are asked whether their mother, father or sibling was diagnosed with CRC and if so, at which age. Colonoscopy and histology reports are collected and information from these reports is extracted independently in a standardized way by two trained investigators, who are blinded with respect to questionnaire and genotype data and who resolve discrepancies by consensus after further review and discussion. Based on colonoscopy reports, participants are categorized with respect to the most advanced lesion: CRC, advanced adenoma (AA), non-advanced adenoma (NAA), hyperplastic polyp, or undefined polyp. Advanced adenomas are defined as adenomas ≥1 cm or adenomas with cellular or structural atypia.
Genotyping
Genotyping within the BLITZ study was conducted for a subset (n=1098) of participants who were recruited between 2005 and 2013. In a sex-matched case-control design, participants were randomly selected within subgroups defined by the most advanced finding at screening colonoscopy, with higher sampling fractions for the much smaller subgroups of participants with more advanced findings in order to increase the power of between-group comparisons (Figure 1).
Figure 1. Flow diagram of inclusion of study participants.
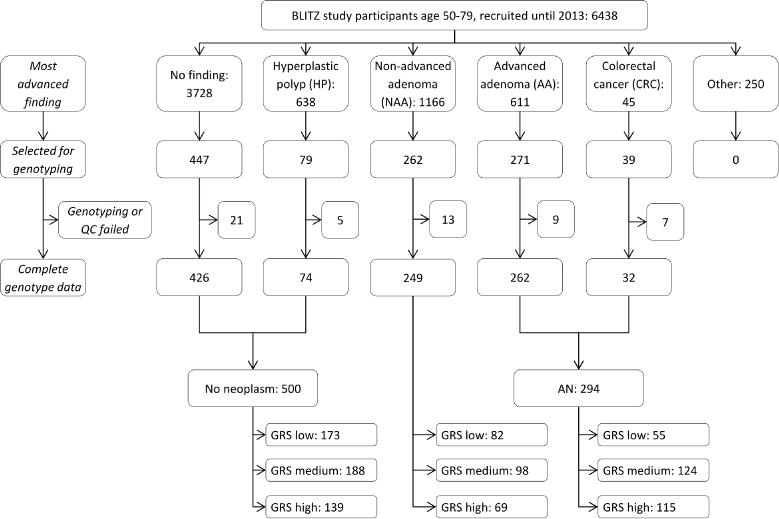
Abbreviations: AA, advanced adenoma; AN, advanced neoplasm; CRC, colorectal cancer; GRS, genetic risk score; HP, hyperplastic polyp; NAA, non-advanced adenoma; QC, quality check
Extracted DNA from blood cells was genotyped using the Illumina OncoArray-500k V1.0 BeadChip (Illumina, San Diego, CA, USA). General genotyping quality control assessment was conducted as previously described24. A total of 1098 samples fulfilled all criteria and qualified for imputation. Genotypes for common variants across the genome were imputed using data from UK10K-1000 Genomes Project (phase 3, Oct. 2014) with IMPUTE2 v2.3.2 after pre-phasing with SHAPEIT software v2.12. We set thresholds for imputation quality to retain both potential common and rare variants for validation. Sufficient quality of imputation was assumed if imputed SNPs reached an information metric I of at least >0.30. All genomic locations are given in NCBI Build 37/UCSC hg19 coordinates. All SNPs having a MAF<1% were excluded. After imputation, the SNP set consisted of 92580817 genotyped and imputed SNPs. PLINK v1.90 was then used to extract SNPs for the required regions of interest.
Identification and selection of common risk variants
Previously published and validated risk variants of CRC for persons of European descent which were identified through literature research were considered for inclusion in the GRS. A comprehensive overview of the previously discovered risk variants considered and included for these analyses (n=55) is provided in Supplementary Table 1. One SNP (rs6066825) was excluded from further analyses as its imputation resulted in missing values in more than 10% of our sample. Of SNPs in linkage disequilibrium (D′≥0.95 and r2>0.5) only those were included in the final GRS which were most significantly associated with the risk for advanced neoplasms in our study sample. Thus, six SNPs were excluded from further analyses (rs10505477, rs1862748, rs7014346, rs7259371, rs7837328, rs961253). We conducted sensitivity analyses with a more conservative cut-off for D′ (0.5), which resulted in excluding nine additional SNPs from the GRS.
Statistical analyses
First, main characteristics of the BLITZ study population were described (Table 1). GRS for all eligible study participants were calculated by aggregating their risk alleles (0, 1 or 2) for SNPs as reported in the discovery studies. For sensitivity analyses, we also generated a weighted GRS with weights equal to the log odds ratios (OR) of the respective SNPs reported in the discovery studies. For easier interpretation we report results from the unweighted GRS in the main text. Tertiles of the GRS were calculated according to the distribution of risk alleles in “healthy” participants without any finding at screening colonoscopy. Based on those tertiles, all participants were then categorized in three risk groups (low, medium, and high).
Table 1.
Selected characteristics of the study population, stratified by most advanced finding at screening colonoscopy
| Characteristic | Group | No neoplasm n=500 (47.9) |
NAA n=249 (23.9) |
p-valuea | AN n=294 (28.2) |
p-valuea |
|---|---|---|---|---|---|---|
| Sex | Female | 190 (38.0) | 106 (42.6) | 0.2281 | 103 (35.0) | 0.4030 |
| Male | 310 (62.0) | 143 (57.4) | 191 (65.0) | |||
| Age | 50–59 | 222 (44.4) | 85 (34.1) | 0.0072 | 92 (31.3) | <0.0001 |
| 60–69 | 206 (41.2) | 110 (44.2) | 132 (44.9) | |||
| 70–79 | 72 (14.4) | 54 (21.7) | 70 (23.8) | |||
| Genetic risk score (tertile)b | Low | 173 (34.6) | 82 (32.9) | 0.8734 | 55 (18.7) | <0.0001 |
| Medium | 188 (37.6) | 98 (39.4) | 124 (42.2) | |||
| High | 139 (27.8) | 69 (27.7) | 115 (39.1) | |||
| Family history of colorectal cancer in a 1st-degree relative | 61 (12.2) | 33 (13.3) | 0.6149 | 44 (15.0) | 0.2521 | |
| Smoking | Never | 240 (48.0) | 137 (55.0) | 0.0892 | 127 (43.2) | 0.0973 |
| Former | 204 (40.8) | 82 (32.9) | 123 (41.8) | |||
| Current | 49 (9.8) | 29 (11.7) | 43 (14.6) | |||
| Body mass index | ≤18.5 kg/m2 | 0 (0) | 0 (0) | 0.0052 | 2 (0.7) | 0.0427 |
| ≤25 kg/m2 | 177 (35.4) | 60 (24.1) | 84 (28.6) | |||
| ≤30 kg/m2 | 210 (42.0) | 128 (51.4) | 127 (43.2) | |||
| >30 kg/m2 | 101 (20.2) | 57 (22.9) | 74 (25.2) | |||
| High alcohol intakec | 160 (32.0) | 81 (32.5) | 0.8837 | 115 (39.1) | 0.0419 | |
| High red meat intaked | 58 (11.6) | 23 (9.2) | 0.3266 | 23 (7.8) | 0.0895 | |
| Low physical activitye | 44 (8.8) | 23 (9.2) | 0.8435 | 25 (8.5) | 0.8861 | |
| Hormone-replacement therapyf | 99 (52.1) | 52 (49.1) | 0.5526 | 43 (41.8) | 0.0931 | |
| Education | ≤ 9 yrs | 282 (56.4) | 151 (60.6) | 0.5268 | 187 (64.7) | 0.0867 |
| 10–11 yrs | 111 (22.2) | 51 (20.5) | 50 (17.3) | |||
| ≥ 12 yrs | 103 (20.6) | 45 (18.4) | 52 (18.0) | |||
| Regular use of nonsteroidal anti-inflammatory drugs | 89 (17.8) | 46 (18.5) | 0.8212 | 51 (17.4) | 0.8715 | |
| Personal history of colonoscopy | 102 (20.4) | 47 (18.9) | 0.6406 | 49 (16.7) | 0.1955 | |
Note: values are expressed as n (%)
Abbreviations: AN, advanced neoplasm; NAA, non-advanced adenoma
Compared to group without neoplasm
Number of risk alleles in different categories: low (21–32), medium (33–37), high (38–47)
High alcohol intake defined as drinking alcoholic beverages on average on (1) more than five days per week or (2) more than seven standard alcohol glasses per week for women or more than 14 standard alcohol glasses per week for men
High red meat intake defined as eating either processed meat or red meat more than once per day or eating both processed meat and red meat at least once per day
Low physical activity defined as being physically active for less than 30 minutes per day
Missing values for No finding/NAA/AN: family history 9/9/7, smoking 7/1/1, body mass index 12/4/7, hormone replacement therapy 3/-/2, education 4/2/5
Proportions refer to women only
Chi2-tests were conducted to test for associations of the GRS with sex, age and other covariates among controls (see Table 1 for description of covariates). Using multiple logistic regression models, ORs with 95% confidence intervals (CI) and p-values for trend were calculated in order to quantify associations between GRS and risk for advanced neoplasms (AN, defined as either CRC or AA) and NAA. All models were calculated with two sets of adjustment: model 1 was adjusted for sex and age, and model 2 was additionally adjusted for factors that were found to be statistically associated with GRS categories in neoplasm-free study participants in bivariate analyses (Chi2-tests, p<0.2). C-statistics, continuous net reclassification improvement (NRI) and integrated discrimination improvement (IDI) were obtained. Dose-response analyses on the risk of AN according to the number of risk alleles were conducted for model 2 using cubic spline functions with the median number of risk alleles in neoplasm-free participants serving as the reference value and knots at the 5th, 50th, and 95th percentiles of the GRS. Furthermore, we assessed the joint association of the age of the participants and GRS level (low, medium, high risk) from a multiple logistic regression model with the reference value of a 60-year old participant with a medium GRS. Finally, from the same regression model, we estimated risk advancement periods (RAPs), the difference in age at which participants in the different GRS categories reach the same level of risk. RAPs were estimated by the ratios of the regression coefficients for the respective GRS categories and the regression coefficient for an increase in age by one year, as described in detail by Brenner et al.25.
SNP selection was conducted with Plink26, 27. All statistical analyses were conducted two-sided on a 0.05 significance level using the SAS software, version 9.4 (SAS institute, Cary, NC).
Replication and meta-analyses
The main analyses were replicated in a subset of participants of the Tennessee Colorectal Polyp Study (TCPS), which has been described in more detail elsewhere28. Genotyping in this subset was conducted with the Affymetrix Genome-Wide Human SNP Array 5.0, and imputation of data was performed in a similar manner as for the BLITZ participants. Only 35 SNPs of the 48 SNPs used in the main analyses passed the imputation quality control thresholds and were included in the consecutive analyses. Interaction tests were employed to investigate potential differences between studies, and results of both studies were summarized by meta-analyses.
Results
Of 6438 recruited study participants aged 50–79 years until 2013, a total of 1098 were selected for genotyping (all of CRC cases, and random samples using different sampling fractions of participants with other findings at colonoscopy), of whom 55 had to be excluded due to a lack of sufficient DNA or fail in quality control of genotyped or imputed data (Figure 1).
Main characteristics of the study population after quality control are shown in Table 1. The sample included 294 participants with AN, and 249 with NAA as the most advanced finding, 500 participants had no neoplasm at screening colonoscopy. About 60% of all participants in each group were male. Median age was 60, 63 and 65 in participants without neoplasm, with NAA and with AN, respectively. The GRS ranged from 21 to 49, with cut-offs for the tertiles in participants without finding being 32 and 37. The distribution of the GRS was very similar among participants with NAA and participants without neoplasms (Supplementary Figure 1). By contrast, much higher and lower proportions of participants with AN had a GRS in the highest and lowest tertile, respectively, compared to persons without neoplasm (p<0.0001).
The distribution of potential confounders among study participants without finding at screening colonoscopy according to GRS categories is listed in Table 2. Neither sex nor age was unequally distributed between the different GRS categories. Only for a personal history of colonoscopy and low physical activity some modest association with the distribution of GRS was seen (p<0.2), and these covariates were therefore selected for inclusion in multivariable adjustments.
Table 2.
Distribution of covariates according to GRS among study participants without neoplasm at screening colonoscopy
| Tertile of GRS
|
|||||
|---|---|---|---|---|---|
| Characteristic | Group | Low 173 (34.6) |
Medium 188 (37.6) |
High 139 (27.8) |
p-valuea |
| Sex | Female | 64 (37.0) | 69 (36.7) | 57 (41.0) | 0.6900 |
| Male | 109 (63.0) | 119 (63.3) | 82 (59.0) | ||
| Age | 50–59 | 75 (43.4) | 89 (47.3) | 58 (41.7) | 0.2335 |
| 60–69 | 73 (42.2) | 67 (35.6) | 66 (47.5) | ||
| 70–79 | 25 (14.5) | 32 (17.0) | 15 (10.8) | ||
| Family history in a 1st-degree relative | 20 (11.6) | 25 (13.3) | 16 (11.5) | 0.8497 | |
| Smoking | Never | 81 (46.8) | 92 (48.9) | 67 (48.2) | 0.8728 |
| Former | 73 (42.2) | 73 (38.8) | 58 (43.7) | ||
| Current | 17 (9.8) | 21 (11.2) | 11 (7.9) | ||
| BMI | ≤18.5 kg/m2 | 0 (0) | 0 (0) | 0 (0) | 0.5633 |
| ≤25 kg/m2 | 55 (31.8) | 69 (36.7) | 53 (38.1) | ||
| ≤30 kg/m2 | 74 (42.8) | 75 (39.9) | 61 (43.9) | ||
| >30 kg/m2 | 41 (23.7) | 36 (19.2) | 24 (17.3) | ||
| High alcohol intakeb | 56 (32.4) | 63 (33.5) | 41 (29.5) | 0.7377 | |
| High red meat intakec | 20 (11.6) | 21 (11.2) | 17 (12.2) | 0.9570 | |
| Low physical activityd | 21 (12.1) | 14 (7.5) | 9 (6.5) | 0.1520 | |
| Hormone-replacement therapye | 33 (53.2) | 34 (50.0) | 56 (56.1) | 0.7897 | |
| Education | ≤ 9 years | 100 (57.8) | 98 (52.1) | 84 (60.4) | 0.5929 |
| 10–11 years | 35 (20.2) | 47 (25.0) | 29 (20.9) | ||
| ≥ 12 years | 37 (21.4) | 41 (21.8) | 25 (18.0) | ||
| Regular use of nonsteroidal anti-inflammatory drugs | 25 (14.5) | 40 (21.3) | 24 (17.3) | 0.2338 | |
| Personal history of colonoscopy | 23 (13.3) | 45 (23.9) | 34 (24.5) | 0.0163 | |
Note: values are expressed as n (%)
Abbreviations: GRS, genetic risk score
Comparison between the three GRS groups, using Chi2-test
High alcohol intake defined as drinking alcoholic beverages on average on (1) more than five days per week or (2) more than seven standard alcohol glasses per week for women or more than 14 standard alcohol glasses per week for men
High red meat intake defined as eating either processed meat or red meat more than once per day or eating both processed meat and red meat at least once per day
Low physical activity defined as being physically active for less than 30 minutes per day
Proportions refer to women only
Missing values Low/Medium/High GRS: family history 2/3/4, smoking 2/2/3, body mass index 3/8/1, hormone-replacement therapy 2/1/0, education 1/2/1
Having a GRS in the medium and high tertile was associated with a 2.1-fold and 2.6-fold risk, respectively, for AN in sex- and age-adjusted analyses (ORs 2.07, 95% CI 1.41–3.04 and 2.64, 95% CI 1.77–3.92, Table 3). Additional adjustment for personal history of colonoscopy and low physical activity increased the estimates slightly (ORs 2.16, 95% CI 1.46–3.19 and 2.74, 95% CI 1.84–4.09, for medium and high GRS, respectively). The risk for NAA was not significantly associated with GRS in either model (OR 1.04, 95% CI 0.70–1.55 for high GRS in sex- and age-adjusted model).
Table 3.
Risk of non-advanced adenoma and advanced neoplasm according to genetic risk score (GRS)
| GRS category | No neoplasm
|
Non-advanced adenoma
|
Advanced neoplasm
|
||||
|---|---|---|---|---|---|---|---|
| N (%) | N (%) | OR (95% CI)
|
N (%) | OR (95% CI)
|
|||
| Model 1a | Model 2b | Model 1a | Model 2b | ||||
|
|
|
|
|||||
| Low | 173 (34.6) | 82 (32.9) | Ref. | Ref. | 55 (18.7) | Ref. | Ref. |
| Medium | 188 (37.6) | 98 (39.4) | 1.08 (0.75–1.55) | 1.09 (0.76–1.57) | 124 (42.2) | 2.07 (1.41–3.04) | 2.16 (1.46–3.19) |
| High | 139 (27.8) | 69 (27.7) | 1.04 (0.70–1.55) | 1.05 (0.70–1.55) | 115 (39.1) | 2.64 (1.77–3.92) | 2.74 (1.84–4.09) |
| Ptrend=0.8158 | Ptrend=0.8060 | Ptrend<0.0001 | Ptrend<0.0001 | ||||
Abbreviations: CI, confidence interval; GRS, genetic risk score; OR, odds ratio; Ref., reference
Adjusted for sex and age
Adjusted for sex, age, previous colonoscopy, physical activity; missing values, n=1
Supplementary Table 2 shows the risk for AN by subgroup of features defining the AN status, namely carcinoma, or size (>10mm), histology (cellular or structural atypia) or both size and histology of advanced adenomas. Overall, similar associations were seen in all analyses, even though some of the subgroup specific associations for the smaller groups, in particular participants with CRC, did not reach statistical significance.
C-Statistics, NRI and IDI are presented in Supplementary Table 3. For models with the outcome advanced neoplasm, the GRS improved the predictive value in all adjustment settings. No improvement of the c-statistics could be observed for predicting non-advanced adenoma when additionally considering the GRS next to traditional risk factors.
The results of cubic spline modelling for AN risk are portrayed in Supplementary Figure 2. Compared to the median number of risk alleles in neoplasm-free participants (n=34), ORs at the knots (5th and 95th percentile) were 0.40 (95% CI 0.26–0.63) and 1.84 (95% CI 1.19–2.85), respectively. The analyses also show the risk increase according to the number of risk alleles to be monotonous over the full range of the GRS assessed.
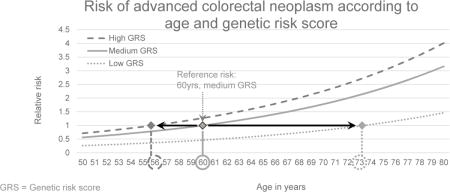
Figure 2 depicts the joint relationship of age and GRS with the risk for AN. Due to the strong variation of risk by GRS categories, people with a low GRS reach the same level of risk as those with a medium GRS at much higher ages only. For example, the risk of the 60-year old medium GRS group is reached in the low GRS group at age 73 only. Conversely, the same risk level is reached at age 56 already in the high GRS group.
Figure 2.
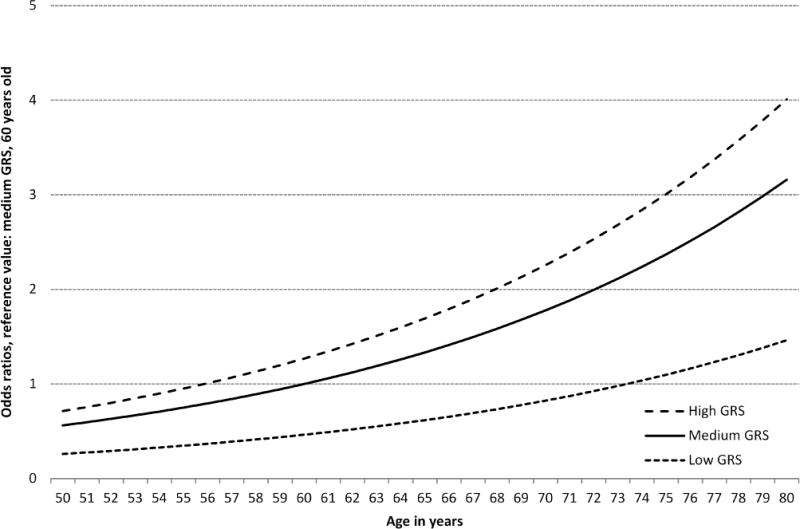
Dose-response association between age in years and risk for advanced neoplasm, stratified by genetic risk score (GRS) tertiles, plotted with a joint reference (medium GRS, 60 years)
The RAPs for comparisons between the GRS categories and their 95% CIs are shown in Table 4. The RAPs for having a medium or a high GRS compared to a low GRS were 13.4 (95% CI 4.8–22.0) years and 17.5 (95% CI 7.8–27.3) years, respectively. Persons with a high GRS had a RAP of 4.1 (95% CI −2.0–10.3) years compared to persons with a medium GRS.
Table 4.
Risk advancement periods (RAP) for comparisons between genetic risk scores (GRS) categories
| GRS comparison | OR (95% CI)a | RAP (95% CI) [years] |
|---|---|---|
| Medium vs. low | 2.16 (1.46–3.19) | 13.4 (4.8–22.0) |
| High vs. low | 2.74 (1.84–4.09) | 17.5 (7.8–27.3) |
| High vs. medium | 1.27 (0.90–1.79) | 4.1 (−2.0–10.3) |
Abbreviations: CI, confidence interval; GRS, genetic risk score; OR, odds ratio; RAP, risk advancement periods
Adjusted for sex, age, previous colonoscopy, physical activity; missing values, n=1
Supplementary Table 4 shows the risk of AN according to the GRS, stratified by age, which was divided into two groups. Associations of the GRS with the risk of AN were tentatively stronger in age group 65–79 years than in age group 50–64 years, but confidence intervals were overlapping, and sensitivity analyses showed that interaction by age was not statistically significant (p=0.7758).
Site-specific analyses are presented in Table 5. Having a higher GRS was associated with higher risks for AN in all bowel sites. The association was most pronounced for proximal neoplasms (ORs for GRS in medium and highest tertile compared to lowest tertile in the fully adjusted model: 3.55, 95% CI 1.85–6.82 and 3.61, 95% CI 1.84–7.10, respectively), with statistically significant differences in heterogeneity analyses (pairwise differences between low vs. medium/high GRS in the three sites) between the proximal and rectal location (p=0.0437). Additional adjustment for history of colonoscopy and physical activity yielded little change in all risk estimates.
Table 5.
Risk of advanced neoplasm according to genetic risk score (GRS), stratified by site of neoplasm
| Site of neoplasma | GRS | No finding
|
Advanced neoplasm
|
||
|---|---|---|---|---|---|
| N (%) | N (%) | OR (95% CI)
|
|||
| Model 1b | Model 2c | ||||
|
|
|
||||
| Proximal | Low | 173 (34.6) | 13 (13.1) | Ref. | Ref. |
| Medium | 188 (37.6) | 49 (49.5) | 3.48 (1.82–6.65) | 3.55 (1.85–6.82) | |
| High | 139 (27.8) | 37 (37.4) | 3.55 (1.81–6.96) | 3.61 (1.84–7.10) | |
| ptrend= | 0.0004 | 0.0003 | |||
|
| |||||
| Distal | Low | 173 (34.6) | 24 (18.9) | Ref. | Ref. |
| Medium | 188 (37.6) | 52 (40.9) | 1.96 (1.15–3.33) | 2.06 (1.21–3.52) | |
| High | 139 (27.8) | 51 (40.2) | 2.68 (1.57–4.60) | 2.86 (1.66–4.93) | |
| ptrend= | 0.0003 | 0.0002 | |||
|
| |||||
| Rectum | Low | 173 (34.6) | 18 (26.5) | Ref. | Ref. |
| Medium | 188 (37.6) | 23 (33.8) | 1.16 (0.60–2.24) | 1.22 (0.63–2.37) | |
| High | 139 (27.8) | 27 (39.7) | 1.87 (0.98–3.58) | 2.04 (1.06–3.92) | |
| ptrend= | 0.0542 | 0.0318 | |||
Abbreviations: CI, confidence interval; GRS, genetic risk score; OR, odds ratio; Ref., reference
Neoplasms in more than one location were allocated to the most proximal location (n=31)
Adjusted for sex and age
Adjusted for sex, age, previous colonoscopy, physical activity
Sensitivity analyses using a lower threshold for linkage disequilibrium (D′≤0.5) in the construction of the GRS, which resulted in including 39 SNPs only, and sensitivity analyses using a weighted GRS and a unweighted GRS only applied in persons without previous colonoscopies all yielded similar patterns (Supplementary Table 5, 6 and 7). ORs for AN were somewhat lower using the weighted GRS, but confidence intervals were overlapping, and very consistent null results were found for NAA both with the weighted and the unweighted GRS.
Supplementary Table 8 shows results of the replication analyses within the TCPS with a subset of 35 SNPs of the original GRS that were measured with sufficient quality. For comparability, analyses within the BLITZ population were repeated with the same 35 SNPs. Altogether, 957 persons from the TCPS could be used for replication analyses. Thereof, 140 had advanced adenoma, 355 had non-advanced adenoma and 462 had no neoplasm. Similar results were obtained in both studies for most analyses, even though ORs were overall somewhat lower in both studies than in our main analyses given the lower number of SNPs involved. ORs for AN were 1.58 (95% CI 0.92–2.71) and 2.21 (95% CI 1.33–3.68, ptrend=0.002) in TCPS compared to 1.56 (1.08–2.26) and 2.01 (1.41–2.88, ptrend<0.0001) in BLITZ for medium and high GRS, respectively. Non-advanced adenoma were not associated with GRS in the BLITZ study (ORs 0.96, 95% CI 0.67–1.39 and 0.89, 95% CI 0.61–1.29 for medium and high GRS, respectively), but a small risk increase was seen in the TCPS for the highest GRS (ORs 1.08, 95% CI 0.75–1.56 and 1.49, 95% CI 1.06–2.10 for medium and high GRS, respectively). A meta-analysis of both studies yielded ORs of 1.57 (95% CI 1.15–2.13) and 2.08 (95% CI 1.55–2.79, ptrend<0.0001) for medium and high GRS for AN, and ORs of 1.02 (95% CI 0.79–1.32) and 1.18 (95% CI 0.91–1.52, ptrend=0.5671) for medium and high GRS for NAA. RAPs for the TCPS were comparable to the BLITZ population (Supplementary Table 9), as were the analyses regarding the dose-response associations between age, GRS and the risk for advanced neoplasms (Supplementary Figure 3).
Discussion
In this study among participants of screening colonoscopy, a GRS consisting of 48 SNPs that were previously identified to be related to CRC in large scale GWAS, was highly and selectively predictive on the presence of advanced neoplasms (which are advanced adenomas in most cases in screening populations), whereas no association was seen with the presence of non-advanced adenomas. Strong associations were seen in both younger and older participants, and associations were most pronounced for advanced neoplasms located in the proximal colon. A low genetic risk goes along with much later (more than 10 years) attainment of risk for advanced neoplasms compared to persons with medium or high genetic risk.
The consistency of associations of GRS with CRC and AA is in agreement with suggestions that the vast majority of CRC develop from advanced adenomas through the adenoma-carcinoma sequence2. Although multiple studies have meanwhile confirmed the usefulness of GRS to predict CRC risk19–21, data on their association with presence of advanced adenomas have been very sparse. So far, two studies examined this association and they found significant associations of GRS with risk for advanced adenomas indeed28, 29, but both studies included only a subset of the currently known common genetic variants. Other researchers found meaningful associations between single SNPs and the risk for AA in different study populations30–32. Nevertheless, one of those previous studies already found a stronger association of GRS with proximal neoplasms than distal neoplasms and hypothesized that – equivalent to germline mutations causing Lynch syndrome – many common genetic variants are also more closely related to neoplasms in the proximal colon compared to the distal colon28, a finding fully in line with our results.
Given that prevention of CRC through detection and removal of AA (apart from early detection of CRC) is a key component of CRC screening, the strong association of the GRS with presence of AN may have important implications for risk stratification. In particular, the GRS could complement other factors commonly used for identification of high risk groups, such as a family history of CRC, by allowing to identify both high and low risk groups in whom screening recommendations different from those for the average risk population might be considered. For example, our data showed that persons with a low genetic risk reach the same AN risk as those with a medium genetic risk approximately 13 years later, which suggests that one might consider a substantially higher age for screening initiation in people with low GRS.
Previous research indicated that the majority of published common risk variants is associated with a higher risk for adenomas28. They contribute to CRC promotion as they are involved in early carcinogenesis in the adenoma-carcinoma pathway29, 33. It is assumed that the genetic risk for CRC is likely to be mediated through susceptibility to adenomas34. One would therefore expect to see associations also between GRS and the risk for non-advanced adenoma. However, no such associations were observed in our study (and although a minor risk increase for the highest GRS tertile was seen for non-advanced adenoma in TCPS, combined analyses of both studies yielded no association, neither in single GRS categories nor in trend analyses), which is in line with previous literature, which also concluded that less SNPs are associated with the risk for NAA than with the risk for AA and associations of a GRS were at least much stronger for advanced neoplasms than for non-advanced adenoma28, 33. One possible explanation for these results is that development of non-advanced adenomas might be rather driven by environmental and lifestyle factors (or epigenetic factors), whereas a possible transition to advanced adenomas and subsequent potential promotion to carcinomas might primarily be related to genetic variants.
Our results may have important clinical implications. For example, estimates of RAPs such as those derived from our analyses may help to refine personalized recommendations regarding age at screening initiation which so far are rather crude in most existing guidelines as they often use a positive family history in a first-degree relative as the only or main criterion for this purpose. Although the “family history criterion” allows to identify a small proportion of high risk individuals (typically around 10%), it does not allow any differentiation of risk among the vast majority of people without a family history. Even though risk scores based on environmental and lifestyle factors may provide such differentiation, they may vary during life course due to variation of risk factors over time. Furthermore, for many of these risk factors cumulative exposure over lifetime seems to be more important than current exposure. For example, smoking exposure cumulating over life beyond the common starting age of screening would be of little help to define a starting age for screening. By contrast, the GRS provides a constant value that could be measured once at a relatively young age, such as 40 years, and then be used for personalized advice on when to start screening. The selective association with advanced neoplasms would be a further advantage of the GRS over “environmental” risk scores, as the latter would typically lead to similar “enrichment” of people with low-risk NAA in the apparent high risk group. Most NAA would never develop into cancer during lifetime but their detection at screening might lead to unnecessary concern and burden of surveillance. Nevertheless, the best use of environmental and genetic risk scores would probably be a combination of both rather than relying on each type of score individually.
It would be of great interest to further explore to what extent the GRS would also lend itself for personalized recommendations on screening and surveillance intervals. While no direct evidence for the latter purpose can be drawn from our study, evidence for this highly plausible possibility should be sought for in further studies specifically focusing on participants of surveillance colonoscopies.
Our study has several strengths and limitations. A major strength of the BLITZ study is its conduction in a true screening setting, in which every participant undergoes the gold standard examination – colonoscopy – for detecting CRC and its precursors. Our results therefore pertain to the very target population of CRC screening, and include major targets of CRC screening, i.e. not only CRC, but also AA whose detection and removal at screening enables effective prevention of CRC.
The present study is based on a subset of participants, for whom genotyped data was obtained. Participants with relevant findings at screening colonoscopy were selected at higher proportions to enhance precision and power of the risk estimates and between group comparisons. Despite selecting all CRC patients with usable genotype data from an overall very large screening population, their numbers were still rather low leading to relatively wide confidence intervals for the risk estimates in this subgroup. Our study did not include participants with sessile serrated polyps as a specific risk group, as these lesions were not yet routinely ascertained in a standardized manner in routine screening practice during the earlier years of recruitment. Sample size limitations also hindered more refined categorization of risk strata. As illustrated in our dose-response analyses, risk stratification should be possible along the continuum of the GRS. Only SNPs identified in previous GWAS were included in the GRS. Further enhancements of the GRS are to be expected by the steady discovery of new risk alleles, or other genetic or epigenetic risk markers, mostly by large international GWAS consortia. It should also be kept in mind that our results pertain to a study population of (almost exclusively) European ancestry only. Nevertheless, similarly predictive GRS, albeit based on a partly different set of risk alleles, would be expected for populations with different ancestry. In contrast to the results in the BLITZ study, we saw a slightly increased risk for non-advanced adenoma in the TCPS cohort for the highest GRS tertile. This suggests that there might be room for improvement on the question of which SNPs to include in the GRS when aiming to selectively identify people at increased risk of advanced neoplasms only. The selection of SNPs that were included in our GRS was not driven by the association of each SNP with advanced neoplasms in our study, but by previously identified associations with CRC, and our GRS was therefore not yet optimized for selective identification of people at increased risk of advanced neoplasms only. A GRS based on SNPs explicitly associated with advanced neoplasms only might perform even better than our GRS.
In summary, despite these limitations, we were able to show that a genetic risk score based on published risk alleles might already now enable more precise risk stratification not only for CRC, but also for any advanced neoplasm. The selective (BLITZ study) or at least much stronger (TCPS) association with advanced neoplasms, the most important targets for CRC screening, compared to non-advanced adenomas, could be particularly useful in this context. Further research should aim to replicate and expand our results in larger and ethnically diverse populations and include participants of both screening and surveillance colonoscopy in order to expand the evidence base for more refined, personalized CRC prevention strategies. Further research should also explore both the possibilities to increase the potential for risk stratification of the GRS including additional informative SNPs or for achieving essentially the same potential for risk stratification at lower costs with a lower number of SNPs by excluding redundant or less informative ones. Finally, further research is needed to address the acceptance, feasibility and cost-effectiveness of GRS based risk stratification in CRC screening.
Supplementary Material
Supplementary Table 1. Previously identified GWAS findings for colorectal cancer in persons of European descent
Supplementary Table 2. Association of the genetic risk score with specific features of advanced neoplasms (AN)
Supplementary Table 3. C-Statistics, net reclassification improvement (NRI) and integrated discrimination improvement (IDI) of models including a genetic risk score (GRS) and easy collectable environmental data
Supplementary Table 4. Risk of advanced neoplasm according to genetic risk score (GRS), stratified by age of person at risk
Supplementary Table 5. Risk of non-advanced adenoma and advanced neoplasm according to genetic risk score (GRS) based on 39 SNPs, LD cut-off=0.5
Supplementary Table 6. Risk of non-advanced adenoma and advanced neoplasm according to weighted genetic risk score (GRS) based on 48 SNPs
Supplementary Table 7. Risk of non-advanced adenoma and advanced neoplasm according to genetic risk score (GRS), only including participants with no history of previous colonoscopy
Supplementary Table 8. Risk of non-advanced adenoma and advanced neoplasm according to genetic risk score (GRS) based on 35 SNPs available in both BLITZ and TCPS in high quality
Supplementary Table 9. Risk advancement periods (RAP) for comparisons between genetic risk scores (GRS) categories (based on 35 SNPs) within the TCPS
Supplementary Figure 1. Distribution of risk alleles in participants of the BLITZ study
Supplementary Figure 2. Risk of any advanced neoplasm according to sum of risk alleles
Supplementary Figure 3. Dose-response association between age in years and risk for advanced neoplasm, stratified by genetic risk score (GRS) tertiles, plotted with a joint reference (medium GRS, 60 years), using TCPS data
Acknowledgments
The authors acknowledge the excellent cooperation of gastroenterology practices and clinics in patient recruitment and of Labor Limbach in sample collection. They also thank Dr. Katja Butterbach, Dr. Katarina Cuk and Ulrike Schlesselmann for their excellent work in laboratory preparation of blood samples and Isabel Lerch, Susanne Köhler, Dr. Utz Benscheid, Jason Hochhaus, and Maria Kuschel for their contribution in data collection, monitoring, and documentation.
Grant support: The BliTz study was partly funded by a grant from the German Research Council (DFG, grant No. BR1704/16-1) and the US National Institutes of Health (NIH, grant No. U01-CA185094). The work of Yesilda Balavarca was partly supported by a grant from the German Cancer Aid (Deutsche Krebshilfe, Reference Number 111365). The TCPS study was supported by grants from the US National Institutes of Health (grant No. P50CA95103 and P30CA68485; R25/T32 CA160056 to X.O. Shu). The work of Jacklyn Hellwege was supported by R25CA160056 from the US National Institutes of Health.
Role of the Funding Source: The funding sources had no role in the design of the study; collection, analysis, and interpretation of the data; preparation or review of the manuscript; or the decision to submit the manuscript for publication.
Abbreviations
- AA
advanced adenoma
- AN
advanced neoplasm
- BMI
body-mass-index
- CI
confidence interval
- CRC
colorectal cancer
- GRS
genetic risk score
- GWAS
genome-wide association study
- NAA
non-advanced adenoma
- OR
odds ratio
- RCT
randomized controlled trial
- RAP
risk advancement periods
Footnotes
Publisher's Disclaimer: This is a PDF file of an unedited manuscript that has been accepted for publication. As a service to our customers we are providing this early version of the manuscript. The manuscript will undergo copyediting, typesetting, and review of the resulting proof before it is published in its final citable form. Please note that during the production process errors may be discovered which could affect the content, and all legal disclaimers that apply to the journal pertain.
Disclosure: The authors have nothing to disclose.
Author Contributions: KW (statistical analysis and interpretation of data, drafting of the manuscript), HT (imputation of genotyped data, critical revision of the manuscript for important intellectual content), YB (data preparation, critical revision of the manuscript for important intellectual content), JNH (genotyping and data preparation, critical revision of the manuscript for important intellectual content), MJS (TCPS study design and supervision, data preparation, critical revision of the manuscript for important intellectual content), HB (study design and supervision, drafting of the manuscript, critical revision of the manuscript for important intellectual content, obtained funding)
References
- 1.Ferlay J, Soerjomataram I, Ervik M, et al. GLOBOCAN 2012 v1.0, Cancer Incidence and Mortatlity Worldwide: IARC CancerBase No 11[Internet] 2013 http://globocan.iarc.fr, Accessed 08/05/2017.
- 2.Leslie A, Carey FA, Pratt NR, et al. The colorectal adenoma-carcinoma sequence. Br J Surg. 2002;89:845–60. doi: 10.1046/j.1365-2168.2002.02120.x. [DOI] [PubMed] [Google Scholar]
- 3.Atkin WS, Edwards R, Kralj-Hans I, et al. Once-only flexible sigmoidoscopy screening in prevention of colorectal cancer: a multicentre randomised controlled trial. Lancet. 2010;375:1624–33. doi: 10.1016/S0140-6736(10)60551-X. [DOI] [PubMed] [Google Scholar]
- 4.Schoen RE, Pinsky PF, Weissfeld JL, et al. Colorectal-cancer incidence and mortality with screening flexible sigmoidoscopy. N Engl J Med. 2012;366:2345–57. doi: 10.1056/NEJMoa1114635. [DOI] [PMC free article] [PubMed] [Google Scholar]
- 5.Brenner H, Stock C, Hoffmeister M. Effect of screening sigmoidoscopy and screening colonoscopy on colorectal cancer incidence and mortality: systematic review and meta-analysis of randomised controlled trials and observational studies. BMJ. 2014;348:g2467. doi: 10.1136/bmj.g2467. [DOI] [PMC free article] [PubMed] [Google Scholar]
- 6.Broderick P, Carvajal-Carmona L, Pittman AM, Webb E, et al. A genome-wide association study shows that common alleles of SMAD7 influence colorectal cancer risk. Nat Genet. 2007;39:1315–7. doi: 10.1038/ng.2007.18. [DOI] [PubMed] [Google Scholar]
- 7.Tomlinson I, Webb E, Carvajal-Carmona L, et al. A genome-wide association scan of tag SNPs identifies a susceptibility variant for colorectal cancer at 8q24.21. Nat Genet. 2007;39:984–988. doi: 10.1038/ng2085. [DOI] [PubMed] [Google Scholar]
- 8.Zanke BW, Greenwood CM, Rangrej J, et al. Genome-wide association scan identifies a colorectal cancer susceptibility locus on chromosome 8q24. Nat Genet. 2007;39:989–94. doi: 10.1038/ng2089. [DOI] [PubMed] [Google Scholar]
- 9.Berndt SI, Potter JD, Hazra A, et al. Pooled analysis of genetic variation at chromosome 8q24 and colorectal neoplasia risk. Hum Mol Genet. 2008;17:2665–72. doi: 10.1093/hmg/ddn166. [DOI] [PMC free article] [PubMed] [Google Scholar]
- 10.Houlston RS, Webb E, Broderick P, et al. Meta-analysis of genome-wide association data identifies four new susceptibility loci for colorectal cancer. Nat Genet. 2008;40:1426–35. doi: 10.1038/ng.262. [DOI] [PMC free article] [PubMed] [Google Scholar]
- 11.Jaeger E, Webb E, Howarth K, Carvajal-Carmona L, Rowan A, Broderick P, Walther A, Spain S, Pittman A, et al. Common genetic variants at the CRAC1 (HMPS) locus on chromosome 15q13.3 influence colorectal cancer risk. Nat Genet. 2008;40:26–8. doi: 10.1038/ng.2007.41. [DOI] [PubMed] [Google Scholar]
- 12.Tenesa A, Farrington SM, Prendergast JGD, et al. Genome-wide association scan identifies a colorectal cancer susceptibility locus on 11q23 and replicates risk loci at 8q24 and 18q21. Nat Genet. 2008;40:631–637. doi: 10.1038/ng.133. [DOI] [PMC free article] [PubMed] [Google Scholar]
- 13.Tomlinson IPM, Webb E, Carvajal-Carmona L, et al. A genome-wide association study identifies colorectal cancer susceptibility loci on chromosomes 10p14 and 8q23.3. Nat Genet. 2008;40:623–630. doi: 10.1038/ng.111. [DOI] [PubMed] [Google Scholar]
- 14.Houlston RS, Cheadle J, Dobbins SE, et al. Meta-analysis of three genome-wide association studies identifies susceptibility loci for colorectal cancer at 1q41, 3q26.2, 12q13.13 and 20q13.33. Nat Genet. 2010;42:973–977. doi: 10.1038/ng.670. [DOI] [PMC free article] [PubMed] [Google Scholar]
- 15.Tomlinson IP, Carvajal-Carmona LG, Dobbins SE, et al. Multiple common susceptibility variants near BMP pathway loci GREM1, BMP4, and BMP2 explain part of the missing heritability of colorectal cancer. PLoS Genet. 2011;7:e1002105. doi: 10.1371/journal.pgen.1002105. [DOI] [PMC free article] [PubMed] [Google Scholar]
- 16.Peters U, Jiao S, Schumacher FR, Hutter CM, et al. Identification of Genetic Susceptibility Loci for Colorectal Tumors in a Genome-Wide Meta-analysis. Gastroenterology. 2013;144:799–807.e24. doi: 10.1053/j.gastro.2012.12.020. [DOI] [PMC free article] [PubMed] [Google Scholar]
- 17.Whiffin N, Hosking FJ, Farrington SM, et al. Identification of susceptibility loci for colorectal cancer in a genome-wide meta-analysis. Hum Mol Genet. 2014;23:4729–37. doi: 10.1093/hmg/ddu177. [DOI] [PMC free article] [PubMed] [Google Scholar]
- 18.Al-Tassan NA, Whiffin N, Hosking FJ, et al. A new GWAS and meta-analysis with 1000Genomes imputation identifies novel risk variants for colorectal cancer. Sci Rep. 2015;5:10442. doi: 10.1038/srep10442. [DOI] [PMC free article] [PubMed] [Google Scholar]
- 19.Frampton MJ, Law P, Litchfield K, et al. Implications of polygenic risk for personalised colorectal cancer screening. Ann Oncol. 2015;27:429–34. doi: 10.1093/annonc/mdv540. [DOI] [PubMed] [Google Scholar]
- 20.Hsu L, Jeon J, Brenner H, et al. A model to determine colorectal cancer risk using common genetic susceptibility loci. Gastroenterology. 2015;148:1330–9.e14. doi: 10.1053/j.gastro.2015.02.010. [DOI] [PMC free article] [PubMed] [Google Scholar]
- 21.Jenkins MA, Makalic E, Dowty JG, et al. Quantifying the utility of single nucleotide polymorphisms to guide colorectal cancer screening. Future Oncol. 2016;12:503–13. doi: 10.2217/fon.15.303. [DOI] [PMC free article] [PubMed] [Google Scholar]
- 22.Hundt S, Haug U, Brenner H. Comparative Evaluation of Immunochemical Fecal Occult Blood Tests for Colorectal Adenoma Detection. Ann Intern Med. 2009;150:162–169. doi: 10.7326/0003-4819-150-3-200902030-00005. [DOI] [PubMed] [Google Scholar]
- 23.Brenner H, Tao S, Haug U. Low-dose aspirin use and performance of immunochemical fecal occult blood tests. JAMA. 2010;304:2513–2520. doi: 10.1001/jama.2010.1773. [DOI] [PubMed] [Google Scholar]
- 24.Anderson CA, Pettersson FH, Clarke GM, et al. Data quality control in genetic case-control association studies. Nat Protocols. 2010;5:1564–1573. doi: 10.1038/nprot.2010.116. [DOI] [PMC free article] [PubMed] [Google Scholar]
- 25.Brenner H, Gefeller O, Greenland S. Risk and rate advancement periods as measures of exposure impact on the occurrence of chronic diseases. Epidemiology. 1993;4:229–36. doi: 10.1097/00001648-199305000-00006. [DOI] [PubMed] [Google Scholar]
- 26.Purcell S, Chang C. PLINK v1.9. 2009 [Google Scholar]
- 27.Chang CC, Chow CC, Tellier LC, et al. Second-generation PLINK: rising to the challenge of larger and richer datasets. Gigascience. 2015;4:7. doi: 10.1186/s13742-015-0047-8. [DOI] [PMC free article] [PubMed] [Google Scholar]
- 28.Zhang B, Shrubsole MJ, Li G, et al. Association of genetic variants for colorectal cancer differs by subtypes of polyps in the colorectum. Carcinogenesis. 2012;33:2417–2423. doi: 10.1093/carcin/bgs308. [DOI] [PMC free article] [PubMed] [Google Scholar]
- 29.Abulí A, Castells A, Bujanda L, et al. Genetic Variants Associated with Colorectal Adenoma Susceptibility. PLoS ONE. 2016;11:e0153084. doi: 10.1371/journal.pone.0153084. [DOI] [PMC free article] [PubMed] [Google Scholar]
- 30.Edwards TL, Shrubsole MJ, Cai Q, et al. Genome-wide association study identifies possible genetic risk factors for colorectal adenomas. Cancer Epidemiol Biomarkers Prev. 2013;22:1219–26. doi: 10.1158/1055-9965.EPI-12-1437. [DOI] [PMC free article] [PubMed] [Google Scholar]
- 31.Wang Y-P, Zhang J, Zhu H-Y, et al. Common variation rs6983267 at 8q24.1 and risk of colorectal adenoma and cancer: evidence based on 31 studies. Tumor Biology. 2014;35:4067–4075. doi: 10.1007/s13277-013-1532-2. [DOI] [PubMed] [Google Scholar]
- 32.Tan C, Hu W, Huang Y, et al. Risk of eighteen genome-wide association study-identified genetic variants for colorectal cancer and colorectal adenoma in Han Chinese. Oncotarget. 2016;7:77651–77663. doi: 10.18632/oncotarget.12750. [DOI] [PMC free article] [PubMed] [Google Scholar]
- 33.Burnett-Hartman AN, Newcomb PA, Hutter CM, et al. Variation in the Association Between Colorectal Cancer Susceptibility Loci and Colorectal Polyps by Polyp Type. Am J Epidemiol. 2014;180:223–232. doi: 10.1093/aje/kwu114. [DOI] [PMC free article] [PubMed] [Google Scholar]
- 34.Carvajal-Carmona LG, Zauber AG, Jones AM, et al. Much of the genetic risk of colorectal cancer is likely to be mediated through susceptibility to adenomas. Gastroenterology. 2013;144:53–5. doi: 10.1053/j.gastro.2012.09.016. [DOI] [PMC free article] [PubMed] [Google Scholar]
Associated Data
This section collects any data citations, data availability statements, or supplementary materials included in this article.
Supplementary Materials
Supplementary Table 1. Previously identified GWAS findings for colorectal cancer in persons of European descent
Supplementary Table 2. Association of the genetic risk score with specific features of advanced neoplasms (AN)
Supplementary Table 3. C-Statistics, net reclassification improvement (NRI) and integrated discrimination improvement (IDI) of models including a genetic risk score (GRS) and easy collectable environmental data
Supplementary Table 4. Risk of advanced neoplasm according to genetic risk score (GRS), stratified by age of person at risk
Supplementary Table 5. Risk of non-advanced adenoma and advanced neoplasm according to genetic risk score (GRS) based on 39 SNPs, LD cut-off=0.5
Supplementary Table 6. Risk of non-advanced adenoma and advanced neoplasm according to weighted genetic risk score (GRS) based on 48 SNPs
Supplementary Table 7. Risk of non-advanced adenoma and advanced neoplasm according to genetic risk score (GRS), only including participants with no history of previous colonoscopy
Supplementary Table 8. Risk of non-advanced adenoma and advanced neoplasm according to genetic risk score (GRS) based on 35 SNPs available in both BLITZ and TCPS in high quality
Supplementary Table 9. Risk advancement periods (RAP) for comparisons between genetic risk scores (GRS) categories (based on 35 SNPs) within the TCPS
Supplementary Figure 1. Distribution of risk alleles in participants of the BLITZ study
Supplementary Figure 2. Risk of any advanced neoplasm according to sum of risk alleles
Supplementary Figure 3. Dose-response association between age in years and risk for advanced neoplasm, stratified by genetic risk score (GRS) tertiles, plotted with a joint reference (medium GRS, 60 years), using TCPS data