

SUMMARY
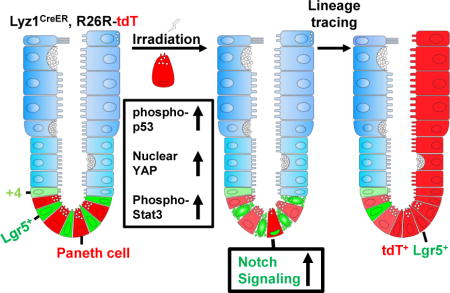
Paneth cells are post-mitotic intestinal epithelial cells supporting the stem cell niche and mucosal immunity. Paneth cell pathologies are observed in various gastrointestinal diseases, however their plasticity and response to genomic and environmental challenges remains unclear. Using a knock-in allele engineered at the mouse Lyz1 locus, we performed detailed Paneth cell-lineage tracing. Irradiation induced a subset of Paneth cells to proliferate and differentiate into villus epithelial cells. RNA-seq revealed that Paneth cells sorted from irradiated mice acquired a stem cell-like transcriptome; when cultured in vitro, these individual Paneth cells formed organoids. Irradiation activated Notch signaling, and forced expression of Notch intracellular domain (NICD) in Paneth cells, but not Wnt/beta-catenin pathway activation, induced their dedifferentiation. This study documents Paneth cell plasticity, particularly their ability to participate in epithelial replenishment following stem cell loss, adding to a growing body of knowledge detailing the molecular pathways controlling injury-induced regeneration.
Keywords: Paneth cell, Intestinal stem cell, Plasticity, Notch, Lysozyme, Lyz1, Wnt, RNA-Seq
Graphical abstract
In Brief: Using a knock-in allele engineered at the mouse Lyz1 locus, Yu et al. report that irradiation induces a subset of Paneth cells to dedifferentiate. This process can also be induced by expressing active Notch1 in this cell type. The study documents Paneth cell plasticity, expanding current understanding of intestinal regeneration.
INTRODUCTION
Intestinal epithelia undergo constant cellular turnover to maintain tissue integrity and function (Barker, 2014). In homeostasis, the crypt base columnar (CBC) stem cells identified by high levels of Lgr5 expression engage in daily self-renewal to maintain the intestinal epithelial cell (IEC) mass (Barker et al., 2007). Targeted ablation of Lgr5-expressing cells is tolerated due to the presence of a pool of reserve stem cells (Tian et al., 2011). To date, lineage tracing studies identified alternative stem cell groups marked by expression of Bmi1, HopX, Lrig1, or mTert; such cells are either quiescent at homeostasis or have characteristics of differentiated lineage progenitor cells (Jadhav et al., 2017; Yan et al., 2017) located higher in the crypt position (Barker, 2014). In contrast to Lgr5+ stem cells that are sensitive to radiation and Wnt signaling deprivation, alternative stem cells exhibit higher resistance to both insults and can reenter the cell-cycle to re-populate the epithelia in response to loss of CBC cells (Yan et al., 2012). Interconversion between Lgr5+ and other subgroups of stem cells were shown under homeostasis and injury conditions (Takeda et al., 2011; Yan et al., 2012). Recently, Dll1+ secretory precursors, alkaline phosphatase (AP)+ enterocyte precursors, and long-lived tuft cells were shown to give rise to other cell types in response to radiation or chemical injury (Tetteh et al., 2016; van Es et al., 2012; Westphalen et al., 2014). While secretory lineage precursors are capable of expressing Lgr5 and serve as stem cells (Buczacki et al., 2013), it is not known whether fully committed Paneth cells are capable of dedifferentiating back into a regenerative program. The molecular mechanisms that govern such cellular dedifferentiation events remain largely unclear.
Paneth cells represent a population of morphologically distinct and functionally specialized IECs that co-occupy the crypt base with Lgr5+ stem cells (Clevers, 2013). Paneth cells have a lifespan of approximately 60 days (Ireland et al., 2005). Canonical Wnt signaling induces the maturation of Paneth celIs (van Es et al., 2005) and is essential for cell positioning at the crypt base (Batlle et al., 2002). Once terminally differentiated, Paneth cells exit the cell cycle (Basak et al., 2014) and do not express CBC or proliferative cell markers (Barker et al., 2007). In vitro organoid-forming capability represents a unique cell-intrinsic feature of clonogenic stem cells (Sato et al., 2009). Paneth cells presumably lack self-renewal capacity as evidenced by inability to form organoids if seeded individually (Buczacki et al., 2013). Paneth cells support the crypt stem cell niche by secreting growth factors (e.g., Wnts) (Clevers and Bevins, 2013) and sustain mucosal innate immunity by producing antimicrobial peptides (Bevins and Salzman, 2011). Aberrant appearance of Paneth cells in gastrointestinal (GI) mucosal lesions, a pathology referred to as Paneth cell metaplasia, is frequently observed in GI clinical pathology, such as colorectal cancer (CRC) and inflammatory bowel disease (IBD) (Sakamori et al., 2014; Wehkamp and Stange, 2010). Paneth cells’ response to mucosal injury or CRC-driven mutations continues to require clarification.
Mature Paneth cells express characteristic markers, e.g., lysozyme, CD24, or MMP7, (Clevers and Bevins, 2013); however, Paneth cells under pathological conditions may decrease or even lose the expression of these genes (Cadwell et al., 2008; Wehkamp et al., 2005). Previous label retaining studies utilizing a doxycycline-inducible Villin promoter-driven GFP transgene in mice suggested that long-term label-retaining cells (LRCs) were enriched with Paneth cell marker-expressing cells and were capable of proliferation following irradiation (Roth et al., 2012). However, these LRCs contained a substantial proportion (~39.9%) of non-Paneth cells that did not express lysozyme or high levels of CD24 and expressed the stem cell marker Msi (Roth et al., 2012). Other studies showed that LRCs contained secretory precursors co-expressing Lgr5+ stem cell markers and secretory cell markers such as ulex europaeus agglutinin I (UEA) lectin (Buczacki et al., 2013). The dynamic and heterogeneous nature of LRC composition was further defined by a recent study (Li et al., 2016). Given the observed high degree of plasticity in the intestinal epithelium (Mills and Sansom, 2015), it is difficult to link LRCs, especially after injury, to any cell lineage and thus requires detailed genetic tracing.
Here, we performed a Paneth cell-lineage tracing study using a newly derived Lyz1-CreER knock-in allele. We show that irradiation induced mature Paneth cells to proliferate and acquire multi-potency. Paneth cells sorted from irradiated mice gained a stem cell-like transcriptome, and ectopic activation of Notch but not the Wnt pathway in Paneth cells induced their dedifferentiation.
RESULTS
Genetic labeling of Paneth cells
Mature Paneth cells are the exclusive IEC producers of C-type lysozyme, a β-1,4-N-acetylmuramoylhydrolase that cleaves bacterial cell walls (Bevins and Salzman, 2011). Mouse Lyz1 encodes the Paneth cell-specific lysozyme located 5.5-kb away from Lyz2 encoding macrophage lysozyme. By homologous recombination in embryonic stem (ES) cells, an H2BmCherry-IRES-CreER expression cassette was knocked into the Lyz1 locus, resulting in a targeted allele replacing Lyz1 at the start codon (Fig. 1A). H2BmCherry was immunolocalized to nuclei at the bottom of crypts in Lyz1H2BmCherry-IRES-CreER mice (hereafter referred to as Lyz1CreER) but not in wild type crypts (Fig. S1). To genetically mark Paneth cells, we crossed Lyz1CreER mice with Rosa26R reporter mice to derive Lyz1CreER/+; R26R-tdTomato (tdT) or Lyz1CreER/+; R26R-EYFP mice (Fig. 1B), in which the expression of tdT or EYFP will label Lyz1+ cells and their descendants. Tamoxifen administration to Lyz1CreER/+; R26R-tdT mice led to recombination in ~9% of Paneth cells that were identified by strong tdT fluorescence at the crypt base (Fig. S1; Fig. 1C), in isolated crypts, and in organoids (Fig. 1D). The tdT+ cells were exclusively detected in small intestinal (Fig. 1E) but not in colonic epithelia (Fig. 1F), consistent with a lack of Paneth cells in mouse colon. tdT+ cells showed Paneth cell-typical granules (Fig. 1D) and co-expressed endogenous Paneth cell markers, MMP7 (Fig. 1E) and lysozyme (Fig. 1H). None of the tdT+ cells expressed Ki67 (Fig. 1G), as Paneth cells are not proliferative (Basak et al., 2014; Buczacki et al., 2013). Two independently maintained Lyz1CreER mouse lines derived from distinct ES cell clones (Fig. S1) produced similar labeling results and Lyz1CreER/+; R26R-EYFP mice with a green reporter displayed a similar labeling pattern (Fig. 1H-M). For ~60 days after lineage labeling, fluorescence labeling was not seen in villus epithelia at homeostasis (Fig. S2), suggesting that this allele did not label stem cells.
Figure 1. Lyz1CreER labels Paneth cells.
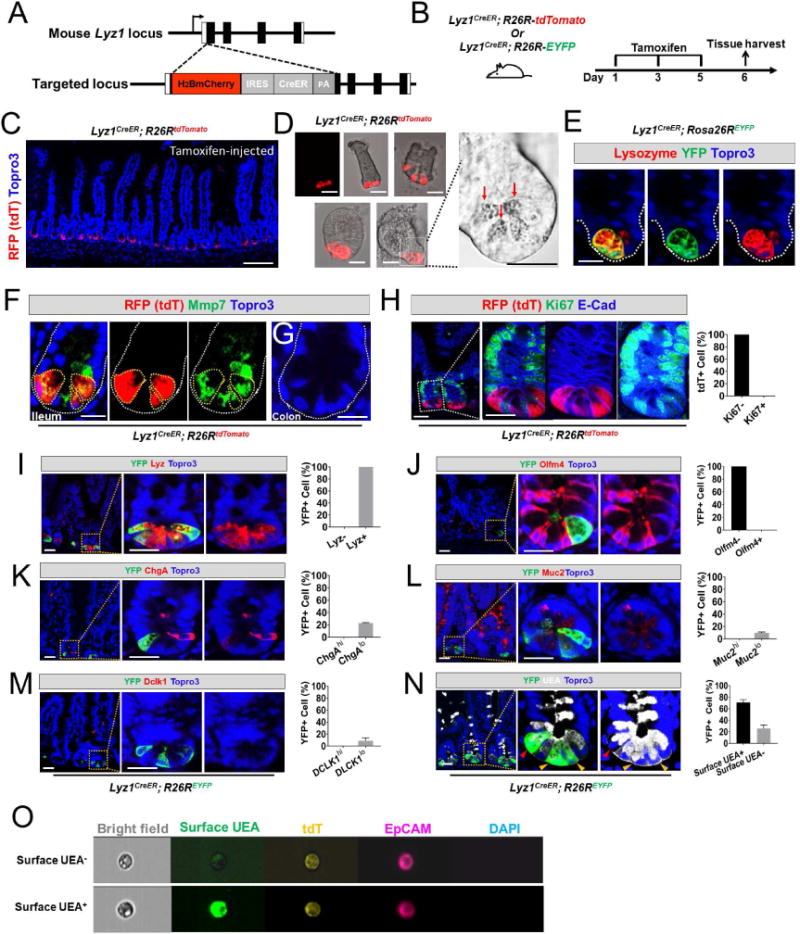
(A) Schematic diagram of the H2Bmcherry-IRES-CreER knock-in allele referred to here as Lyz1CreER.
(B) Lyz1CreER mice were crossed with R26R-tdTomato or R26R-EYFP mice to enable cell lineage labeling.
(C) Tamoxifen-injected Lyz1CreER/+; R26R-tdTomato mice showed recombined Paneth cells that were strongly positive for tdTomato (tdT) at crypt base of small intestines. Scale bar, 50 μm.
(D) Isolated crypts (top panels) and organoids (bottom panels) showed tdT+ Paneth cells (red) with large granules of typical Paneth cells (bright field panel).
(E) All recombined YFP+ cells expressed endogenous lysozyme (red) in small intestine.
(F) All recombined tdT+ cells expressed Paneth cell marker Mmp7 (green) in small intestine. Scale bar, 10 μm.
(G) No tdT+ cell was found in colon.
(H) Recombined tdT+ cells were negative for Ki67.
(I-M) Tamoxifen-injected Lyz1CreER/+; R26R-EYFP mice were analyzed for the co-expression of various cell type specific markers in the recombined EYFP+ cells. All EYFP+ cells expressed lysozyme (100%, H), none expressed Olfm4 (0%, J), and a subset of them co-expressed low levels of ChgA (22%, K), Muc2 (10%, L), Dclk1 (9%, M).
(N) UEA binding to α (1,2)-linked fucosylated proteins at cell surface indicates mature Paneth cells. 70% of EYFP+ cells exhibited surface UEA positivity (yellow arrowheads), while 30% of EYFP+ cells were negative for surface UEA (red arrowheads). Of note, intracellular vesicles were stained positive for UEA due to cell membrane permeabilization. Scale bars, 10 μm.
(O) Image String analysis of FACS-sorted single live tdT+ cells showed 2 populations of tdT+ cells: surface UEA− (top) and UEA+ (bottom). Live cells were stained without membrane permeabilization, therefore intracellular UEA was not detected.
See also Figures S1 and S2.
To test whether the Lyz1CreER allele specifically marked Paneth cells, lineage-labeled cells were examined for co-expression of markers of various IEC types. We chose EYFP or tdT for double or triple immunofluorescence analyses based on species compatibility among antibodies. We found that all lineage-marked cells co-expressed endogenous lysozyme (100%, Fig. 1H) and none expressed CBC stem cell marker Olfm4 (Fig. 1I). A subpopulation of EYFP+ cells showed low immune-reactivities to Chromogranin A (ChgA, ~22%), Dclk1 (~9%), or Mucin 2 (Muc2, ~10%), possibly identifying secretory precursors (Fig. 1J-L). Surface UEA expression was reported to distinguish mature Paneth cells (surface UEA+) from immature cells (surface UEA) (Buczacki et al., 2013). We found ~70% of EYFP+ cells positive for surface UEA (yellow arrowheads, Fig. 1N), whereas the other 30% were UEA− and tended to occupy a higher crypt position (red arrowheads, Fig. 1N). ImageStream single cell analysis of live tdT+EpCAM+ cells sorted from tamoxifen-injected Lyz1CreER/+; R26R-tdT intestines identified both surface UEA+ and surface UEA− tdT+ cells (Fig. 1O). Thus, Lyz1CreER labeled mature and immature Paneth cells.
Radiation induces a subset of Paneth cells to proliferate and differentiate
Whole-body irradiation activates the self-renewal capacity of several IEC types (Buczacki et al., 2013; Gregorieff et al., 2015; Yan et al., 2012) however, it is unclear if radiation changes the fate of Paneth cells. We genetically traced Lyz1+ lineage-marked Paneth cells following radiation. Five days after tamoxifen administration, Lyz1CreER/+; R26R-tdT mice received 12 Gy whole-body irradiation (Fig. 2A) and intestinal tissues were harvested on days 1, 3, 5, and 7 after irradiation. In non-irradiated mice, tdT+ cells did not express the proliferative marker PCNA (Fig. 2B) whereas a subset of tdT+ cells became strongly positive for PCNA 3 days after irradiation (Fig. 2D, E; arrowheads), suggesting that radiation induced the Lyz1+ Paneth cells to proliferate. This was corroborated by detection of ‘stripes’ or ‘ribbons’ of epithelial tdT+ cells 5-7 days after irradiation (Fig. 2F). Such red ribbons were only found in tamoxifen-injected Lyz1CreER/+; R26R-tdT mice following radiation and were not observed in non-tamoxifen-treated mice or in tamoxifen-treated Lyz1CreER/+; R26R-tdT mice without irradiation. Thus, the ribbons appeared to be induced by radiation from lineage-marked tdT+ cells.
Figure 2. Radiation induces proliferation and villus differentiation in a subset of Paneth cells.
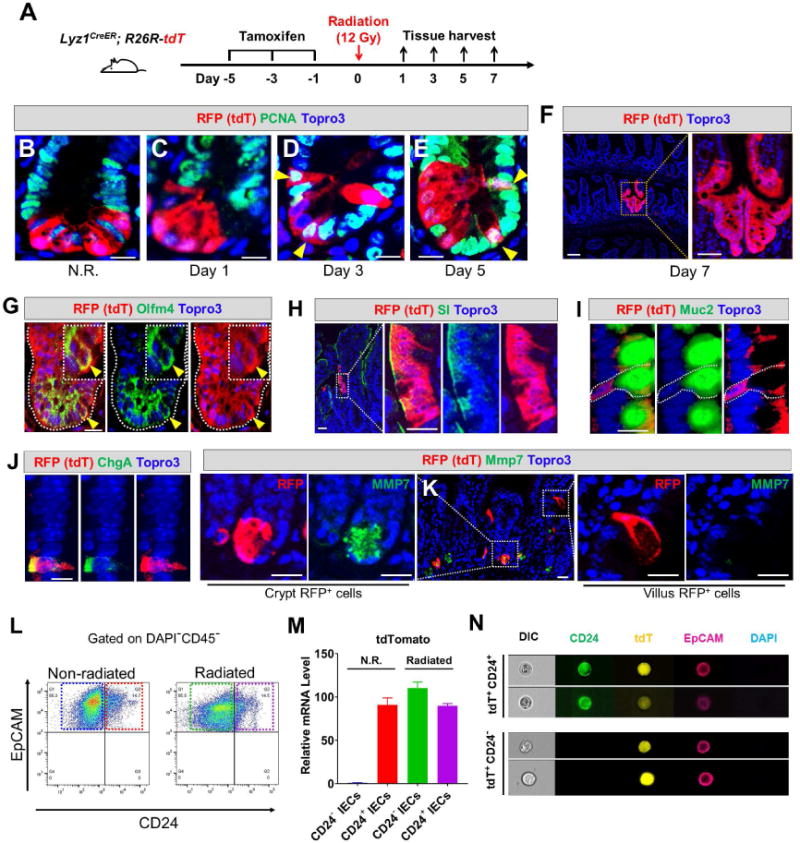
(A) Experimental scheme showing lineage labeling of adult Lyz1CreER; R26R-tdT mice by tamoxifen injection, followed by radiation and tissue analyses (3 mice for each time point).
(B-E) Non-irradiated (N.R.) tdT+ Paneth cells do not express PCNA, however after irradiation tdT+ cells became positive for PCNA on day 3 and 5 (yellow arrowheads). Scale bar, 10 μm.
(F) Radiated Lyz1CreER; R26R-tdT mice showed red epithelial stripes (a representative image of day 7 was shown).
(G-J) Some irradiated tdT+ Paneth cells co-expressed Olfm4 (yellow arrowheads in G) in the crypts, while some villus tdT+ cells co-expressed SI (H), or Muc2 (I). or ChgA (J). Scale bar, 10 μm.
(K) Some irradiated tdT+ cells retained Paneth cell marker (Mmp7, left panel), while villus tdT+ cells lost Paneth cell marker (right panel). Scale bar, 10 μm.
(L) CD24+EpCAM+CD45− and CD24−EpCAM+CD45− cells were FACS-sorted from non-irradiated (N.R.) and irradiated mice.
(M) qPCR showed that CD24−EpCAM+CD45− cells sorted from irradiated mice (green box in L) expressed the cell lineage marker tdT (green bar). CD24−EpCAM+CD45− cells from N.R. mice (blue box in L) did not express tdT (blue bar).
(N) ImageStream analysis of FACS-sorted single tdT+ cells from irradiated mice showed 2 distinct cell populations: CD24+ (top) and CD24− (bottom). Scale bar, 10 μm.
Radiation-induced red epithelial stripes contained crypt cells co-expressing Olfm4 (yellow arrowheads, Fig. 2G), as well as villus cells expressing sucrase-isomaltase (SI, an enterocyte marker, Fig. 2H), Muc2 (goblet cell marker, Fig. 2I), or ChgA (enteroendocrine cell marker, Fig. 2J). The majority of tdT+ villus cells no longer expressed Paneth cell markers such as Mmp7, indicating a loss of Paneth cell identity (right panels, Fig. 2K). However, many crypt-localized tdT+ cells retained their Paneth cell markers (Mmp7 shown in left panel, Fig. 2K). Lineage tracing frequency was approximately 3 ribbons out of 100 lineage-marked cells, potentially due to the low rates of tamoxifen-activated recombination (~9% of all Paneth cells). Thus, the observed Paneth cell conversion rate was likely an under-estimation of the event frequency in the entire intestine.
To further assess radiation-induced changes, we FACS-sorted Paneth cells (CD45−EpCAM+CD24+) from non-irradiated and irradiated Lyz1CreER/+; R26R-tdT mice (Fig. 2L). In non-irradiated mice, tdT expression was only detected in the CD24+ population (red bar, Fig. 2M), as previously reported for Paneth cells (Sato et al., 2011) and was absent in non-Paneth (CD24−) IECs (blue bar, Fig. 2M). In irradiated mice, tdT expression was strongly detected in both CD24− IECs (loss of Paneth cell identity) (green bar, Fig. 2M) and in the remaining CD24+ Paneth cells (purple bar). ImageStream single cell analysis confirmed the presence of both CD24+ and CD24− tdT+ cells in irradiated mice (Fig. 2N) indicating a subset of Paneth cells were induced to change fate.
Mature Paneth cells are capable of dedifferentiating in response to irradiation
Because Lyz1CreER labeled both mature and precursor Paneth cells (Fig. 1M, N), the observed cell lineage conversion might reflect the multi-potency of immature secretory precursor cells rather than “reversion” from mature Paneth cells. To test whether mature Paneth cells could have re-entered the cell cycle giving rise to the observed labeled non-Paneth cell types in response to radiation, we increased the time gap between tamoxifen administration and irradiation to 30 days. As previously reported (Li et al., 2016), this duration was sufficient for full maturation of secretory precursors into terminally differentiated cell types. We administered a single BrdU injection to wild type mice to label fast- and slow-cycling cells (Fig. 3A). After 30 days, we found that none of the BrdU+ cells expressed either CBC stem cell or secretory precursor cell markers: Olfm4, ChgA, Dclk1, Muc2, or Ki67 (Fig. 3C-G, 3I), while all expressed lysozyme and surface UEA+ (Fig. 3B, 3H-I). This confirmed that 30 days was sufficient to allow BrdU+-labeled cycling precursors to become mature cell types (Li et al., 2016). Following a single tamoxifen injection to Lyz1CreER; R26R-tdT mice, we found that after 30 days all tdT+ cells were positive only for Paneth cell markers (Fig. 3J), indicating that we were able to trace mature Paneth cells.
Figure 3. Radiation induced mature Paneth cells to proliferate and re-differentiate.
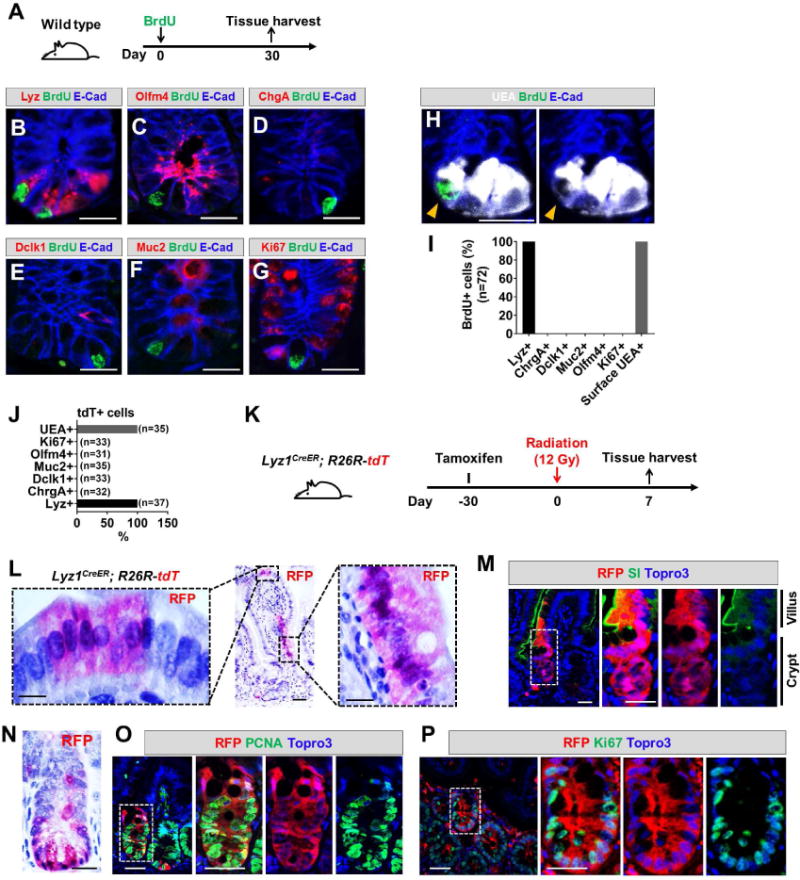
(A) Wild type mice were administered a single BrdU injection to label cycling cells. After a month, the tissue was analyzed.
(B-I) After one month, none of the remaining BrdU+ cells expressed markers of stem cell (C, G) or secretory precursor (D-F). All BrdU+ cells were positive for lysozyme (B) and surface UEA (H). Scale bar, 10 μm.
(J) One month after tamoxifen injection of Lyz1CreER/+; R26R-tdT mice, all remaining tdT+ cells were positive only for Paneth cell markers.
(K) Experimental scheme: one month after tamoxifen injection of Lyz1CreER/+; R26R-tdT mice, animals were irradiated then sacrificed 7 days after irradiation to determine whether radiation induces mature Paneth cell to proliferate.
(L, N) Radiated Lyz1CreER/+; R26R-tdT mice showed villus and crypt localized tdT+ stripes.
(M) Villus tdT+ cells in irradiated animals expressed enterocyte marker SI. Scale bar, 10 μm.
(O, P) Crypt tdT+ cells in irradiated animals showed PCNA+ (O) and Ki67+ (P) cells. Scale bar, 10 μm.
Thirty days after Lyz1CreER; R26R-tdT mice received a single tamoxifen injection, animals received 12 Gy irradiation and tissue was harvested after 7 days (Fig. 3K). We again detected tdT+ epithelial cell stripes in villus and crypt domains (Fig. 3L-N) that contained cells co-expressing enterocyte (SI shown in Fig. 4M) and proliferation markers (PCNA and Ki67, Fig. 3O, P). Long-term analysis of these mice was prohibited by the lethal dose of radiation, however, the data suggested that mature Paneth cells were capable of entering a proliferative state followed by differentiation into villus epithelial cell types after irradiation.
Figure 4. Radiated Paneth cells gain stem cell features.
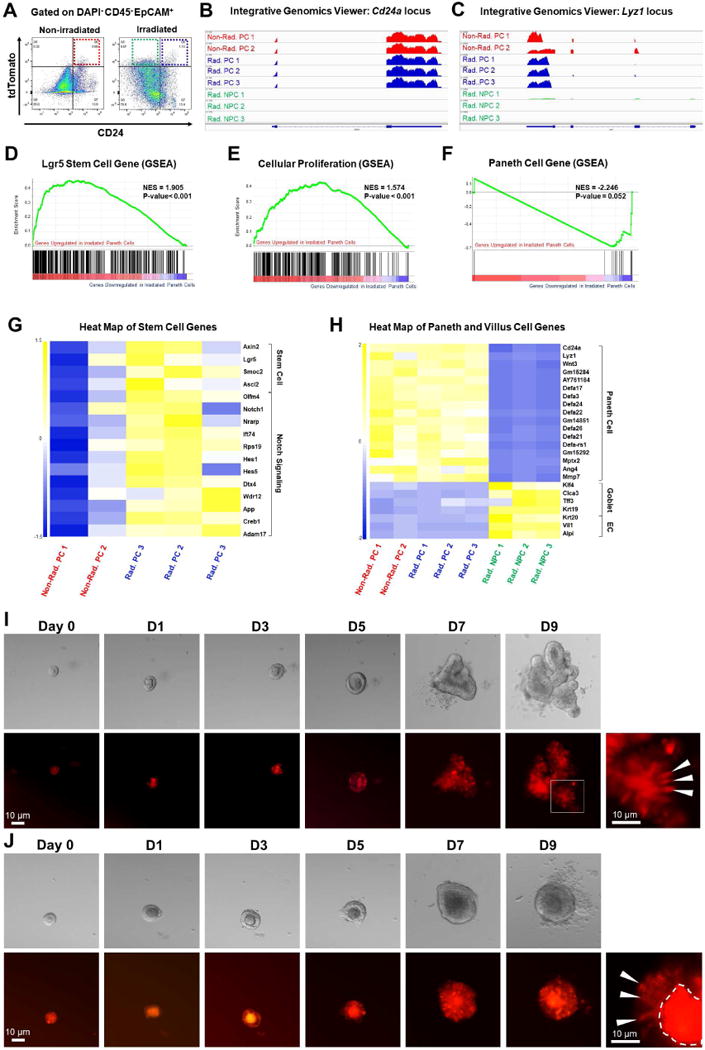
(A) Gated on DAPI−CD45−EpCAM+, FACS-sorting was performed to obtain non-irradiated tdT+CD24+ Paneth cells (red box), irradiated tdT+CD24+ Paneth cells (blue box), and irradiated tdT+CD24− non-Paneth cells (green box), for RNA-Seq analyses.
(B-C) Integrative Genomics Viewer of RNA-Seq data at Cd24a and Lyz1 loci. Non-Rad. PC: non-radiated Paneth cells; Rad. PC: radiated Paneth cells; Rad. NPC: radiated non-Paneth cells.
(D-F) Gene Set Enrichment Analysis (GSEA) showed that compared to non-irradiated Paneth cells, irradiated Paneth cells gained stem cell gene signature (D), exhibited a proliferative status (E), and reduced expression levels of Paneth cell genes (F).
(G-H) Heat map showed that irradiated Paneth cells had higher levels of stem cell gene and Notch target gene expression (G), and that irradiated tdT+CD24− non-Paneth cells showed a loss of all Paneth cell markers and an expression of villus cell genes (H).
(I-J) Single tdT+ cells sorted from irradiated mice formed organoids after 9 days. White arrowheads pointed to tdT+ cells within the organoids.
See also Figures S3-5.
Paneth cells acquire stem cell features after irradiation
Further, we performed RNA-Seq analyses on FACS-sorted tdT+ Paneth cells (tdT+CD45-EpCAM+CD24+) isolated from non-irradiated Lyz1CreER; R26R-tdT mice (n=2) as well as Paneth cells (tdT+CD45−EpCAM+CD24+) and lineage-labeled non-Paneth cells (tdT+CD45−EpCAM+CD24−) from irradiated Lyz1CreER; R26R-tdT mice (n=3). As an expansion of non-Paneth cells (tdT+CD24−) was observed 5 days after irradiation (Fig. 4A), we chose this time point to analyze the outcome of irradiation. RNA expression levels at Cd24a (Fig. 4B) and Lyz1 (Fig. 4C) loci confirmed selective isolation of CD24+ Paneth cells. Gene Set Enrichment Analysis (GSEA) showed that irradiated CD24+ Paneth cells had a significantly stronger stem cell gene signature (e.g. Axin2, Lgr5, Ascl2, Olfm4, etc.) compared to non-irradiated counterparts (Fig. 4D, G). Irradiated Paneth cells also exhibited increased expression of genes typically found in proliferative cells (Fig. 4E), with a parallel reduction of Paneth cell-specific gene expression (Fig. 4F). When compared to irradiated tdT+CD24+ Paneth cells, the transcriptome of non-Paneth cells (tdT+CD24−) from irradiated mice showed a total loss of a Paneth cell gene signature (Fig. 4H and Fig. S3), and expression of enterocyte and goblet cell enriched genes (Fig. 4H).
Organoid formation is a hallmark capacity of clonogenic intestinal stem cells (Sato et al., 2009) but not mature Paneth cells (Buczacki et al., 2013). We tested whether single tdT+ cells isolated from irradiated mice were able to form organoids when cultured in vitro as previously reported (Sato et al., 2009) (also see Methods). Single tdT+ Paneth cells sorted from irradiated animals formed organoids with an approximate efficiency of ~0.3% (Fig. 4I,J and Fig. S4), compared to an organoid-forming efficiency of 3-4% by isolated Lgr5+ cells cultured under the same conditions (not shown). Importantly, isolated CD24+tdT+ Paneth cells from non-irradiated mouse intestine did not form organoids; Paneth cells from non-irradiated mice remained as single cells over a culturing period of 7-9 days (Fig. S5). The transcriptome and organoid-forming studies support a conclusion that Paneth cells acquire stem cell features after irradiation.
Constitutive activation of Wnt/β-catenin is not sufficient for Paneth cell fate conversion
Wnt/β-catenin signaling is critical for Lgr5+ stem cell self-renewal and Paneth cell differentiation (Korinek et al., 1998; van Es et al., 2005) and constitutive activation in Lgr5+ CBC stem cells or “+4” quiescent stem cells induces intestinal adenoma (Barker et al., 2009; Nakanishi et al., 2012; Sangiorgi and Capecchi, 2008). We asked if activation of canonical Wnt signaling in Paneth cells could, by itself, initiate proliferative status. β-catenin ex3 fl mice (Harada et al., 1999) contain a Cre-activated allele where, upon exon 3 removal, β-catenin becomes constitutively active driving robust tumorigenesis (Sakamori et al., 2014). We administered tamoxifen to β-catenin ex3 fl/fl; Lyz1CreER/+; R26R-tdT mice to activate the β-catenin ex3 fl/fl allele in cells simultaneously labeled with tdT (Fig. 5A) and examined the response of tdT+ cells at 8 and 24 hours following injection. We performed a 30-min 5-ethynyl-2′-deoxyuridine (EdU) labeling in mice prior to sacrifice to mark cycling cells (Fig. 5A). Eight and 24 hours following tamoxifen treatment, tdT+ cells were readily detected (pink, Fig. 5B) and they showed notable nuclear β-catenin signals (green) compared to tdT− cells that lacked detectable nuclear fluorescence using confocal microscopy (Fig. 5B). At either time point following tamoxifen injection, we did not detect any EdU-labeled tdT+ cells (Fig. 5C), even though efficient Cre-driven recombination in these tdT+ Paneth cells was confirmed by genomic PCR analyses of cells sorted out from tamoxifen-injected β-catenin ex3 fl/fl; Lyz1CreER/+; R26R-tdT and β-catenin ex3 fl/+; Lyz1CreER/+; R26R-tdT mice (Fig. 5D).
Figure 5. Constitutive β-Catenin activation did not induce Paneth cell to proliferate.
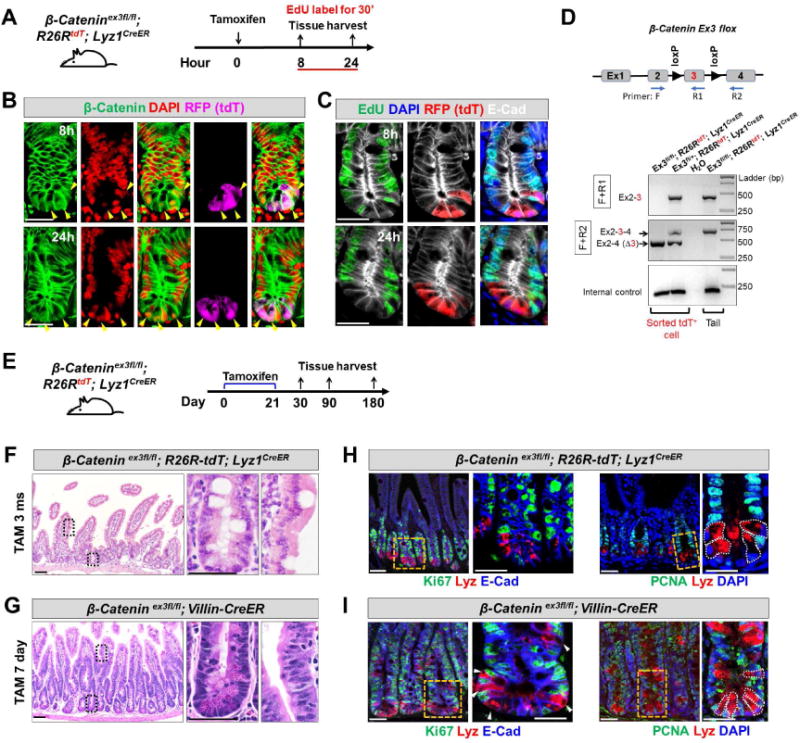
(A) Adult β-Catenin ex3fl/fl; R26R-tdT; Lyz1CreER mice were injected by tamoxifen and assessed for proliferation after 8 and 24 hours. Animals were labeled with EdU for 30 minutes before sacrifice.
(B) 8 and 24 hours after tamoxifen injection, tdT+ Paneth cells (purple) were readily detected with nuclear β-Catenin signals (green, pointed by arrowheads). β-Catenin remained largely at junctions in tdT− cells.
(C) 8 and 24 hours after tamoxifen injection to induce β-Catenin activation, tdT+ Paneth cells (red) did not show EdU incorporation (green). E-Cad (in white) was used to outline cell boundaries.
(D) Genomic PCR using two sets of PCR primers (F+R1; F+R2) revealed robust recombination (excision of exon 3) in FACS-sorted tdT+ cells from tamoxifen-injected ex3fl/fl; R26R-tdT; Lyz1CreER and ex3fl/+; R26R-tdT; Lyz1CreER mice. Water and tail DNA served as controls.
(E) Adult β-Catenin ex3fl/fl; R26R-tdT; Lyz1CreER mice was subcutaneously embedded with 21-day slow-releasing tamoxifen pellets, and assessed after a prolonged tracing up to 1, 3, and 6 months.
(F) Tamoxifen-treated β-Catenin ex3fl/fl; R26R-tdT; Lyz1CreER mice, after a long-term tracing did not show epithelial hyperplasia or adenoma formation at 3 and 6 months (total of 8 mice).
(G) Tamoxifen-treated β-Catenin ex3fl/fl; Villin-CreER mice exhibited formation of tubular adenoma within 1 week. (H-I), Lysozyme-expressing Paneth cells of above tamoxifen-treated animals did not express cell proliferation marker Ki67 (G, I) and PCNA (H, J).
Scale bars, 10 μm.
Additionally, we subcutaneously embedded the slow-releasing tamoxifen pellet (25 mg, 21-day release) in β-catenin ex3 fl/fl; Lyz1CreER/+; R26R-tdT mice, as previously described (Gao et al., 2007), which allowed a long-term continuous tamoxifen-releasing and β-catenin activation in Lyz1 cells (Fig. 2E). One-, 3- and 6-months after tamoxifen embedding, β-catenin ex3 fl/fl; Lyz1CreER/+ mice did not show any detectable epithelial hyperplasia or adenoma (Fig. 5F, 4 mice for each time point). Similarly treated β-catenin ex3 fl/fl; Villin-CreER mice showed robust epithelial hyperplasia and adenoma formation 7 days after tamoxifen treatment (Fig. 5G). In fact, 3 months after tamoxifen administration, there was no remaining tdT+ cell in β-catenin ex3 fl/fl; Lyz1CreER/+; R26R-tdT mice, suggesting that forced β-catenin activation neither prolonged Paneth cell lifespan nor induced self-renewal. Moreover, we directly assessed the expression of proliferative markers (Ki67 and PCNA) in tamoxifen treated β-catenin ex3 fl/fl; Lyz1CreER/+ mice (Fig. 5H, J) or β-catenin ex3 fl/fl; Villin-CreER mice (Fig. 5I, K). Again, lysozyme+ Paneth cells did not express these proliferation markers.
Radiated Paneth cells show increased Notch pathway activity
Under homeostatic conditions, intestinal secretory cells have low Notch activity (Sancho et al., 2015); and compared to Lgr5+ stem cells, expression of Notch1 receptor was lower in Paneth cells (Sato et al., 2011). Our RNA-Seq analyses detected an elevated Notch pathway gene signature in irradiated Paneth cells, as demonstrated by significantly increased levels of Notch target genes: Hes1, Ift74, Dtx4, Creb1, and Adam17 (Fig. 4G), indicating that irradiation might restore Notch signaling in Paneth cells.
Functional Notch signaling relies on cell surface presentation of the Notch1 receptor (Kopan and Ilagan, 2009). Staining for cell-surface Notch1 receptor (Fig. 6A) showed an 8-fold increase in Notch1+ cells in irradiated tdT+ cells as compared to non-irradiated counterpart (Fig. 6B). This was likely an underestimate as surface Notch1 was shown to be rapidly reduced by trypLE digestion (Liu et al., 2014). Radiation activates various cellular pathways (Fei and El-Deiry, 2003; Gregorieff et al., 2015; Kim et al., 2006), and among them p53, Yap and Stat3 were shown to elevate Notch receptor expression (Garner et al., 2013; Jiang et al., 2009; Taniguchi et al., 2015; Yugawa et al., 2007). We examined the expression of active Notch1, Notch intracellular domain (NICD) and Notch targets (Hes1), in irradiated tdT+ Paneth cells. Consistent with reports that irradiation eliminates fast-cycling CBCs (Yan et al., 2012), crypt cells positive for Olfm4, Notch1, and Hes1 diminished 1-2 days following radiation (Fig. S6). We found that irradiation elevated phospho-p53 (S18) levels in tdT+ cells immediately after treatment (Fig. 6C, D). In non-irradiated mice, none of the tdT+ Paneth cells showed NICD or Hes1 staining. Radiation induced nuclear NICD and Hes1 levels in tdT+ cells 3 days after the treatment (Fig. 6E-H). Starting one day after irradiation, irradiated tdT+ cells, but not non-irradiated Paneth cells, showed elevated nuclear Yap (white arrowheads, Fig. 6I) and phospho-Stat3 (Y705) levels (white arrowheads, Fig. 6J). Thus, radiation appears to re-initiate Notch signaling and possibly drive the Paneth cell response.
Figure 6. Radiation activated Notch1 signaling in a subset of Paneth cells.
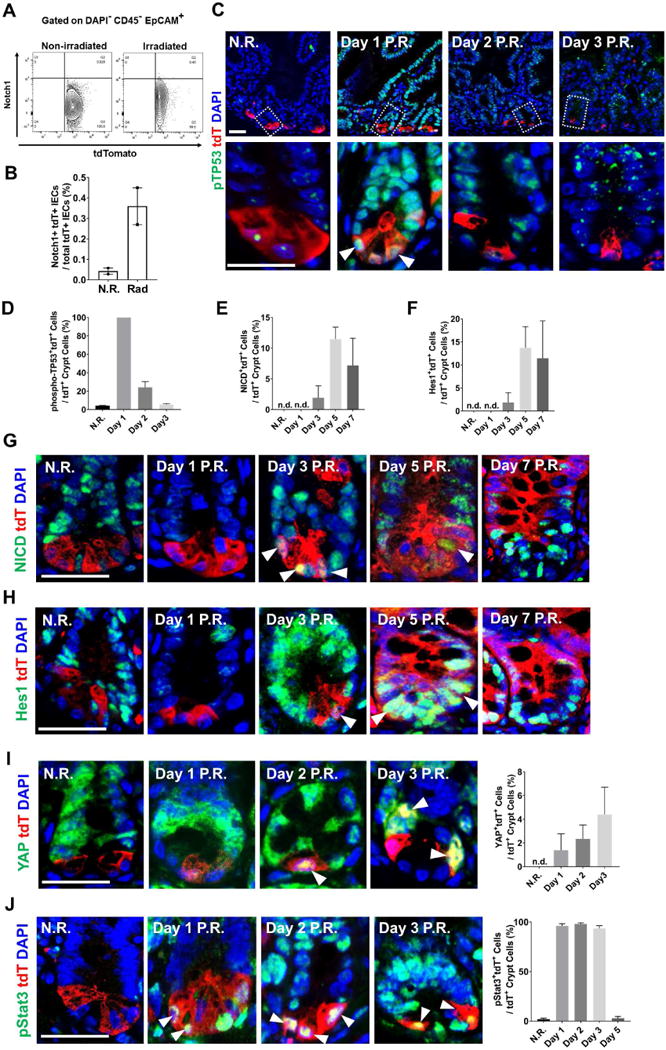
(A-B) Flow cytometry analyzing surface Notch1 receptor expression showed that irradiated tdT+ cells had higher level of surface Notch1 (approximately 8-fold higher than N.R. cells).
(C-D) Radiation immediately increased phospho-p53 (pTP53) levels in all tdT+ Paneth cells 1 day after the treatment.
(E-H) Non-irradiated Paneth cells did not express NICD or Hes1; after 3 days following radiation, tdT+ cells became positive for both NICD and Hes1.
(I) Non-irradiated Paneth cells did not express nuclear Yap; after 2 days following radiation, tdT+ cells became positive for nuclear Yap.
(J) Following radiation, tdT+ cells became positive for nuclear phospho-Stat3.
See also Figure S6.
Forced NICD1 expression in Paneth cells induce dedifferentiation
We next examined whether Notch activation in Paneth cells was sufficient to cause the observed proliferation and fate conversion. This was tested by genetically introducing NICD, the Notch pathway activator, into Paneth cells. Lyz1CreER mice were crossed with R26R-NICD1-IRES-GFP mice (Murtaugh et al., 2003), which contained a Cre-activated NICD1 along with a GFP reporter to label NICD1-expressing cells (Fig. 7A). Similar to the β-catenin constitutive activation experiments (Fig. 5), we injected Lyz1CreER; R26R-NICD1-IRES-GFP mice with a single dose of tamoxifen, and harvested tissues at 8, 24, 48, 72 and 168 hours after treatment (Fig. 7A). All mice received a 30-minute pulse-labeling by EdU prior to sacrifice to mark cycling cells.
Figure 7. Ectopic NICD expression induced Paneth cells to proliferate and differentiate.
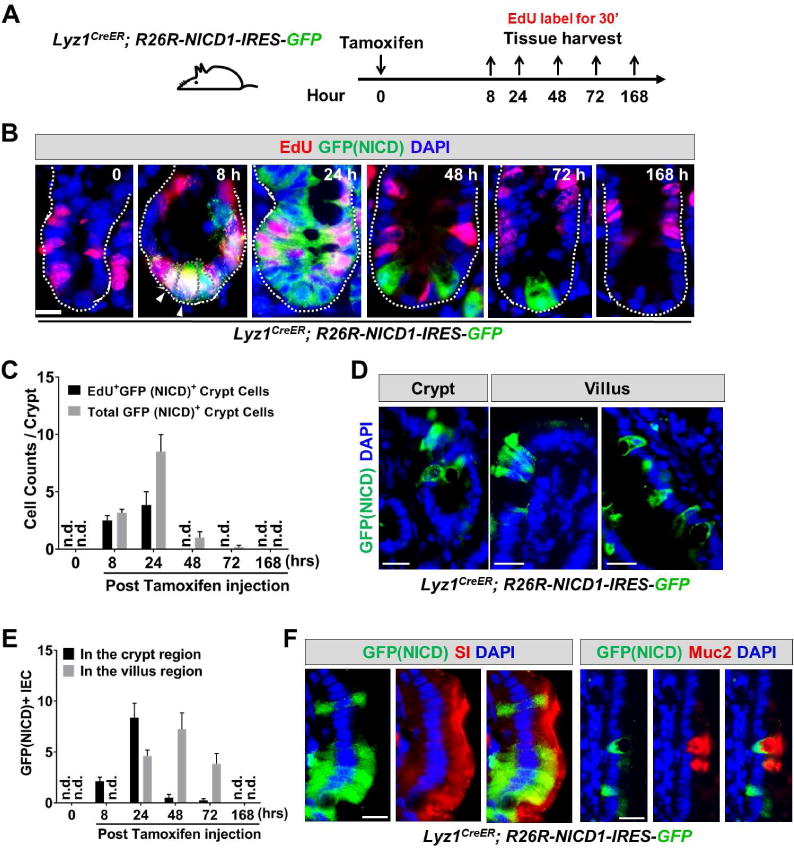
(A) Experimental scheme: Lyz1CreER; R26R-NICD1-IRES-GFP mice were injected with tamoxifen, and sacrificed at 8, 24, 48, 72, and 168 hours for tissue analyses. Mice were labeled with EdU for 30 minutes before sacrifice.
(B-C) In non-tamoxifen treated mice, there was no GFP+/NICD+ cell detected (0 hour). After 8 hours GFP+ cells became readily detectable at crypt bottom, and the majority of GFP+ cells were EdU+. The number of EdU+GFP+ cells expanded at 24 hours, then reduced and disappeared from 48 hours onwards.
(D-E) Villus GFP+/NICD+ cells were detected approximately 1 day after the initial detection of GFP+ cells in the crypts. At 168 hours, GFP+/NICD+ cell was no longer observed suggesting a transient NICD-activated proliferation and differentiation. n.d. not detected.
(F) Villus GFP+NICD+ cells showed expression of enterocyte marker (SI) and goblet cell marker (Muc2). Scale bar, 10 μm.
GFP+ cells were not detected in non-tamoxifen treated animals (0 hr, Fig. 7B,C), however, 8 hours after tamoxifen injection, GFP+ Paneth cells were observed at the bottom of crypts (8 hr, Fig. 7B,C). In contrast to β-catenin activation experiments (Fig. 5), majority of NICD-expressing Paneth cells (GFP+/NICD+) showed EdU incorporation at 8 hours after NICD induction (white arrowheads, Fig. 7B, C), indicating a near immediate induction of cell cycle entry. By 24 hours, there was an expansion of the GFP+/NICD+ cells (Fig. 7B) suggesting that new cells were derived through proliferation. Active cycling of GFP+/NICD+ cells at this stage was also evident by the EdU+ cell numbers (Fig. 7B,C). At 24 or 48 hours, there was a marked increase of GFP+ cells found in villi (Fig. 7D,E). EdU+/GFP+ cells disappeared from the crypt region after 48 hours (Fig. 7E), suggesting that forced NICD expression induced a rapid but transient proliferation by the activated Paneth cells. This transient proliferation was followed by subsequent differentiation into villus IEC types, as evidenced by appearance of villus GFP+ cells, including SI+ enterocytes and Muc2+ goblet cells (Fig. 7F). These data suggested that ectopic NICD induction, but not constitutive β-catenin activation, in Paneth cells promoted dedifferentiation. As the ectopically expressed NICD represents an uncontrollable Notch signaling domain, cells with elevated aberrant expression eventually perished (168 hours, Fig. 7B,C,E; also see (Zecchini et al., 2005). Together, both irradiation and ectopic NICD expression in Paneth cells induced proliferation and dedifferentiation, thus offering a cellular mechanism explaining the observed Paneth cell fate conversion.
DISCUSSION
The intestinal epithelia possess amazing capacity for self-renewal under normal homeostatic conditions and for regeneration in response to environmental challenges (Beumer and Clevers, 2016; Karin and Clevers, 2016). The same capacity, when unchecked, sits at the root of intestinal pathologies including cancer and IBD. The current study provides lineage evidence that in response to irradiation a subset of mature Paneth cells exhibits the ability to dedifferentiate, acquire stem cell features, undergo transient proliferation, and re-differentiate. The low recombination frequency of this allele suggests that the observed dedifferentiation rate may very well be an under estimation of the actual conversion frequency. Interestingly, pancreatic acinar and gastric chief cells, two fully mature secretory cell types, have also been shown to dedifferentiate in response to inflammation or injury (Mills and Sansom, 2015). Paneth cells share remarkable phenotypic similarities to these cells in terms of their secretory function and granular cell morphology (Case, 1978; Clevers and Bevins, 2013; Mills et al., 2003). Thus, mature secretory cell types are able to revert to progenitor states. Our work adds to and extends the growing body of literature that indicates these cell types potentially share common cellular reprogramming mechanisms (Mills and Sansom, 2015).
Epithelial injury such as inflammation leads to a reported reduction in Paneth cells expressing lysozyme or other markers (Cadwell et al., 2008; Wehkamp et al., 2005). Examining lineage-marked Paneth cells from irradiated animals by flow cytometry and transcriptome analysis, we show that a fraction of villus IECs derived from Paneth cells no longer expressed Paneth markers. Thus, it is possible that the observed reduction of Paneth cells in various disease conditions may be a consequence of Paneth cell dedifferentiation. The possibility that chemical or pathogen-induced injury may follow the same path as observed for irradiation could have important consequences on our understanding of the GI injury response and warrants future studies.
Wang and colleagues reported that a small population of Dclk1+ cells marked by a BAC-CreER transgenic strategy identifies the long-lived Tuft cells with stem cell ability (Westphalen et al., 2014). Lineage tracing of these Dclk1+ cells showed infrequent formation of villus ribbons at homeostasis while irradiation or chemical damage did not increase the frequency of the observed ribbons. In this regard, Lyz1+ Paneth cells behave differently as they do not trace into villi at steady state (or after β-catenin activation) and are activated to populate the villi after irradiation. Interestingly, deletion of APC from Tuft cells cannot activate their proliferative activity (Westphalen et al., 2014), which was in line with a similarly resistant behavior of Paneth cells to the forced β-catenin activation in our study. Nevertheless, after a chemical colitis induction, APC-deficient Tuft cells showed robust colon tumor-initiating abilities, implying that canonical Wnt activation alone may not be able to drive dedifferentiation in these cells and activation of a second pathway (by inflammation) may be required for the transformation. Temporal analysis of irradiated Paneth cells in our study detected nuclear elevation of phospho-Stat3, which can be activated by pro- or anti-inflammatory cytokines such as IL6, IL10, and IL22 (Murray, 2007; Ouyang et al., 2011). It is tempting to speculate that an inflammatory signaling cue may play a role in promoting Paneth cell fate conversion.
The potent β-catenin ex3 fl allele used in our study was shown to drive tumorigenesis in Lgr5+ and quiescent stem cell populations (Sakamori et al., 2014; Sangiorgi and Capecchi, 2008). However, it did not alter Paneth cell behavior. This suggested that Lyz1+ Paneth cells are a distinct and responsively non-overlapping cell population compared to the active or “quiescent” stem cell populations. Thus, by having a confined location at the crypt base and being exposed to a high Wnt gradient (Farin et al., 2016), Paneth cells were resistant to the introduced high canonical Wnt activity. However, as previously proposed (Mills and Sansom, 2015), incubation of such potent mutations in a long-lived mature cell type can be dangerous in terms of tumorigenesis upon unmasking of oncogenic mutation following dedifferentiation.
In contrast to a shared reliance on Wnt-signaling activity to maintain homeostasis, CBC stem cells and Paneth cells exhibit remarkably different Notch1 pathway profiles (Sato et al., 2011). Interestingly, Notch1 deletion or chemical inhibition of Notch pathway reduced CBC cell numbers but increased Paneth cell progenitors (Kim et al., 2014; VanDussen et al., 2012). Constitutive activation of Notch signaling in intestinal epithelia led to a reduction in Paneth cell number (Fre et al., 2005; Zecchini et al., 2005). These results were in line with our data and collectively suggested that the Notch pathway might represent the cell fate ‘switch’ between CBCs and Paneth cells. We added Paneth cell-specific evidence to support that switching Notch on is sufficient to induce a fate change.
The mechanisms responsible for irradiation-induced cellular reprogramming are under intensive investigations (Valerie et al., 2007). Notch pathway activation was suspected to be essential for irradiation-induced intestinal regeneration (Carulli et al., 2015). Our data suggest that irradiation rapidly induced a potentially Notch-promoting signaling network involving DNA-repair machinery (p53), inflammation (phospho-Stat3), or pro-survival pathways (Hippo/Yap). Delineating the precise causal relationship between the cellular reprograming and these interconnected pathways warrants future investigation and such studies are increasingly facilitated with lineage tracing tools. Together, our study further supported the high level of epithelial plasticity revealed at the transcriptomic level (Kim et al., 2014) by showing an injury-activated cellular reprogramming in mature Paneth cells, a cell type with high medical significance in stem cell biology and mucosal immunology.
STAR METHODS
CONTACT FOR REAGENT AND RESOURCE SHARING
Further information and requests for reagents may be directed to, and will be fulfilled by, the Lead Contact, Nan Gao at Rutgers University-Newark. ngao@newark.rutgers.edu.
EXPERIMENTAL MODEL AND SUBJECT DETAILS
Animal Models
Lyz1H2BmCherry-IRES-CreER mice were generated in mouse embryonic stem cells (of a 129 genetic background) by homologous recombination at start codon ATG of endogenous Lyz1 with an H2BmCherry-IRES-CreER cassette. Two positively targeted ES clones (C3 and G6) were injected into C57/B6 blastocysts to produce chimeric mice that were subsequently crossed with wild type C57/B6 mice to transmit the allele. After successful germline transmission, these two lines were maintained separately and bred to R26R-EYFP (Srinivas et al., 2001) or R26-tdTomato (Madisen et al., 2010) reporter mice or R26R-NICD1-IRES-GFP mice (Murtaugh et al., 2003). Lyz1CreER; R26RtdT and Lyz1CreER; R26REYFP mice used in this study were on a mixed background (C57/B6; 129), 8 to 14 weeks of age, and, of both sexes. Heterozygous Lyz1CreER mice were healthy and fertile with no phenotypical difference from their wild type littermates. Villin-CreER mice (el Marjou et al., 2004) were generated on B6D2 (C57/B6×DBA/2) background by Dr. Robine’s group (Institut Curie-CNRS, Paris, France). These mice bear a tamoxifen-inducible CreER recombinase under the control of a 9-Kb regulatory region of the murine villin gene (el Marjou et al., 2004). β-Catenin exon3fl/fl mice (Harada et al., 1999) were developed on RW4 background by Dr. Taketo’s group (University of Tokyo) using a targeting vector carrying β-catenin exon3 flanked with two loxP sites (Harada et al., 1999). All mice were maintained on a 12-hour light/dark cycle and provided with food and water ad libitum in individually ventilated cages under specific-pathogen-free (SPF) conditions at Rutgers University-Newark animal facility. Experimental procedures in this study were approved by the Institutional Animal Care and Use Committee of Rutgers University.
METHOD DETAILS
Tamoxifen administration
Mice of 8-12 weeks of age were injected intraperitoneally with 1 mg tamoxifen in corn oil on every other day for a total of 3 injections, or a single injection as detailed in each experiment. To examine adenoma formation in β-Catenin exon3 fl/fl; Lyz1CreER/+ mice, one 21-day release tamoxifen tablet was subcutaneously embedded in each mouse as previously described (Gao et al., 2007). Briefly, mice were anesthetized with an isoflurane machine and subjected to hair removal on the back using an electric razor. Exposed skin was disinfected with iodine and a 0.5-cm cut was made, followed by subcutaneous implantation of a tamoxifen tablet and closure of the wound by a sterile metal clip. Aseptic technique was followed throughout the procedure. Mice were returned to cages after waking up. Intestinal tissues were collected at various time points after tamoxifen administration. β-Catenin exon3 fl/fl; Villin-CreER mice were injected with 1 mg tamoxifen. After 7 days, intestinal tissues were analyzed.
Whole-body γ irradiation
After receiving tamoxifen as detailed in results, animals were subjected to whole body irradiation using a Caesium-137 irradiator calibrated to a dose of 12 Gy following biosafety guidelines of Rutgers-New Jersey Medical School.
Immunofluorescence, tyramide signal amplification (TSA), and immunohistochemistry
The procedure for immunofluorescence and immunohistochemistry has been previously described (Yu et al., 2014a). Briefly, intestinal tissues were collected at indicated time points and fixed in 4% PFA or 10% neutral formalin buffer and embedded in paraffin. 5 μm sections were sliced, dewaxed and subjected to antigen retrieval (0.1 M citric acid, pH 6.0 for most of antibodies except NICD1 and phospho-Stat3 using DAKO Target Retrieval Solution and SignalStain EDTA Unmasking Solution respectively). Slides were immersed boiling buffer solution for 15 minutes. To quench endogenous peroxidase activity, sections were incubated with 3% H2O2 in methanol for 10 minutes. Sections were then blocked in PBS containing 0.1% Triton-X100, 2% BSA and 2% normal serum for at least one hour at room temperature, and then probed with indicated antibodies at 4 °C overnight (see detailed information of antibody dilution in Table S1). Next morning, slides were washed in PBS three times and probed with biotinylated secondary antibody (for IHC) or fluorescence-conjugated secondary antibodies (for immunofluorescence). After one-hour incubation at room temperature, slides were washed for three times. For immunofluorescence, slides were air-dried and mounted with Prolong Gold antifade medium. For IHC, slides were incubated with streptavidin conjugated horseradish peroxidase (HRP) for an hour at room temperature. DAB HRP substrate kit was used for development. Of note, the anti-mouse secondary antibody stained lamina propria cells due to its recognition of mouse IgG producing cells.
For NICD, Hes1, YAP, phospho-Stat3 and phospho-p53 staining, TSA was used to boost staining signals according to the manufacturer’s instructions. After incubation with primary antibodies, goat anti-rabbit poly-HPR was applied following one round of wash. After one-hour incubation at room temperature, slides were washed again and subjected to tyramide labeling. Freshly prepared tyramide working solution (1× dilution buffer containing 0.0015% H2O2 and 1:200 diluted Alexa Fluor 488 labeled tyramide) was added onto each slide. After 12 minutes incubation at room temperature, slides were washed with PBS three times and subsequently subjected to anti-RFP immunofluorescence and DAPI counter-staining. Immunofluorescent images were collected by LSM 510 Laser Scanning Microscope and analyzed by AIM software (version 4.2) or Fiji software (https://fiji.sc).
Single-cell dissociation, cell surface protein staining, sorting, and imaging
Single-cell dissociation was carried out as previously described (Sato et al., 2011). Briefly, the entire small intestine was incubated in cold PBS containing 2 mM EDTA for 40 minutes. After vigorous vortex, suspensions were passed through 70-μm cell strainer and then centrifuged at 200× g for 5 minutes. Crypt pellets were dissociated with TrypLE express including 0.5 mg/ml DNaseI for 10 minutes at 37 °C. Of note, prolonged incubation severely reduced Notch1 staining due to cleavage by TrypLE. After vigorously pipetting to dissociate cell aggregates, cell suspensions were filtered through 40-μm cell strainer and spun down at 200× g for 5 minutes. Cell pellets were washed with cold PBS and re-suspended in FACS sample buffer (1×HBSS containing 2% BSA, 2% FBS and 2 mM EDTA). Cells were stained with DAPI, PerCP/Cy5.5-conjugated EpCAM (1:200), BUV395-conjugated CD45 (1:200), APC/fire 750-conjugated CD24 (1:200), FITC-conjugated UEA (1: 2,000) and APC-conjugated Notch1 (1:20) on ice for 20 minutes. Cell suspensions were subjected to sorting by BD Biosciences Aria II Flow Cytometer (BD FACSAria II) or to imaging collection by Millipore Amnis ImageStream Imaging Flow Cytometer (ImageStream X Mark II). Single viable intestinal epithelial cells were gated by forward scatter, side scatter and by negative staining for DAPI and CD45, and positive staining for EpCAM. Subpopulations were further gated based on CD24, UEA, tdTomato (using R-phycoerythrin/PE channel), or Notch1 staining. Sorted viable singlets were pelleted at 200× g for 5 minutes and subjected to mRNA extraction or in vitro culture. Flow cytometric data were analyzed using Flowjo software (TreeStar, version 10.2). Amnis Imaging data were visualized by IDEAS software (Millipore, version 6.2).
RNA-Seq Analysis
Paneth cells (tdT+CD24+) and derivative (tdT+CD24−) cells were FACS-sorted from irradiated (5 days after radiation) and non-irradiated Lyz1CreER; R26R-tdT mice, and subjected to RNA extraction using Qiagen RNeasy Plus Micro kit. Briefly, 4~7×10⁴ sorted single cells were lysed in 350 μl RLT Plus buffer and filtered through gDNA eliminator spin columns. Supernatants were mixed with equal volume of 70% ethanol and loaded onto RNeasy MinElute spin columns for centrifugation. After discarding flow-through, RNeasy MinElute columns were sequentially washed with Buffer RW1, RPE, and 80% ethanol. RNA was then eluted in 14 μl RNase-free water and sequenced using Illumina’s TruSeq RNA Library Prep kit v2. RNA reads were aligned using TopHat2 (v2.1.0) and visualized using Integrative Genomics Viewer (v2.3.72)(Kim et al., 2013; Robinson et al., 2011; Thorvaldsdottir et al., 2013). All aligned read files were run together using StringTie (v1.3.4) and Ballgown (Release 3.6) to normalize Fragments per Kilobase Million (FPKM) values using default settings (Frazee et al., 2015; Pertea et al., 2016; Pertea et al., 2015). For differential gene expression analysis, genes were pre-ranked based on signal-to-noise values [S2N = (Average Normalized FPKMCondition1 − Average Normalized FPKMCondition2)/(Standard DeviationCondition1 + Standard DeviationCondition2)]. Pre-ranked gene list was then analyzed against select gene lists of interest to determine significance of differential expression between conditions using GSEA (Subramanian et al., 2005). 1000 permutations were performed for each gene list tested, and normalized enrichment scores (NES) and p-values are reported for Lgr5 intestinal stem cell genes (Munoz et al., 2012), intestinal proliferation genes (Merlos-Suarez et al., 2011), and Paneth cell genes (Haber et al., 2017).
Real-time PCR
Real-time PCR was conducted as previously described (Yu et al., 2014a). Briefly, 4~7×10⁴ sorted cells were used for RNA extraction using Qiagen RNeasy mini Kit, according to the manufacturer’s instructions. cDNA was synthesized using the Thermo Scientific Maxima H Minus First Strand cDNA Synthesis Kit. Reaction mixtures were assembled using the SYBR Green Real-Time PCR Master Mixes (Thermo Fisher). Reactions were run in replicates by a Roche Light cycler 480. The PCR cycling conditions were 10 min pre-heating at 95 °C followed by 45 cycles of denaturing (95 °C for 10 sec), anne aling (60 °C for 10 sec) and extension (72 °C for 10 sec). Fluorescent signal was acquired during the extension phase. Melting curves were also analyzed to ensure PCR specificities. Primer sequences are listed in key resource table.
Genomic PCR for assessing β-catenin recombination in Paneth cells
Single tdT+ Paneth cells from β-catenin ex3 fl/fl; R26R-tdT; Lyz1CreER/+ and β-cateninex3 fl/+; R26R-tdT; Lyz1CreER/+ were sorted out and subjected to genomic PCR reaction previously described (Yu et al., 2014b). Briefly, 10,000 sorted cells were lysed in 100 μl lysis buffer [containing 10 mM Tris-HCl (pH 8.3), 50mM KCl, 2mM MgCl2, 0.1 mg/ml gelatin, 0.45% Nonidet P-40, 0.45% Tween 20, and 100 μg/ml Proteinase K] at 55 °C over night. Samples were denatured next morning at 95°C for 10 min. The supernatants contai ning genomic DNA were used as PCR template. PCR was conducted using the primer sets listed in key resource table. PCR program was 2-min denaturing at 94 °C followed by 35 cycles of denaturing (94 °C for 30 sec), annealing (55 °C for 30 sec) and extension (72 °C for 45 sec). PCR products were resolved by 1.5% agarose gel.
Single tdT+ cell culture
Single cell culture was conducted as previously described (Sato et al., 2011) with modifications. Live tdT+ singlets sorted from non-radiated or radiated Lyz1CreER; R26R-tdT mice (3 or 5 days after irradiation) were collected in advanced DMEM/F12 medium containing 50% FBS and subjected to centrifugation (200 g for 5 minutes at 4 °C). The singlets were resuspended in IntestiCult Organoid Growth Medium, and embedded in Matrigel. For the first two days, the culture medium was supplemented with Jagged 1 (1 μM), Wnt3a (100 ng/ml) and ROCK inhibitor Thiazovivin (2 μM). Culture medium was replenished every other day.
Quantification and Statistical Analysis
Statistical and graphic data analysis was conducted using Prism GraphPad 7.04 (https://www.graphpad.com) and Microsoft Excel 2016. The immunofluorescent results were reported from 3 to 20 sections of each animal; 3 to 6 mice were used in each experiment unless stated differently. The data were presented as mean ± S.E.M. in bar graphs. For Fig. 1, percentage was calculated from 249 detectable tdT+ cells from 6 mice (1H), and 15 to 94 YFP+ cells from 3 mice. For Fig. 3, percentage was calculated from 72 detectable BrdU+ cells (2 mice, 3I), and from 236 tdT+ cells (2 mice, 3J). For Fig. 6D-F, 6I and 6J, 4 mice were used at each time point. The percentage was calculated from 126 to 146 tdT+ cells (6D); 198 to 258 tdT+ cells (6E); 162 to 194 tdT+ cells (6F); 134 to 154 tdT+ cells (6I); and 171 to 178 tdT+ cells (6J). Two independent experiments were performed for flow cytometry quantification of surface Notch1 in Fig. 6B. For Fig. 7C and 7E, 2 mice were used at each time point, and a total of 0 to 51 (7C) and 0-104 (7E) GFP+ cells were detected at each time point. As described in (Subramanian et al., 2005), the significance level of enrichment score in the GSEA was evaluated by an empirical phenotype-based permutation test procedure carried out to reserve the complex correlation structure of gene expression profile. The phenotype labels were permuted and then the enrichment score of the gene set was recomputed for the permuted data, therefore ending up with a null distribution for the enrichment score. The nominal p value of the achieved enrichment score was empirically calculated relative to this null distribution (Subramanian et al., 2005). For Fig. S6, 3 mice were used at each time point for Hes1, Notch1 and Olfm4 staining, respectively, and the percentages were calculated for Olfm4+ cells from 312 to 529 crypt cells, for Notch1+ cells from 326 to 359 crypt cells, and for Hes1+ cells from 316 to 541 crypt cells. Statistical comparisons between 2 groups were performed using unpaired two-tailed Student’s t test. p-value was indicated in corresponding graphs.
Data and Software Availability
The accession number for the sequencing data reported in this paper is NCBI GEO: GSE113536.
KEY RESOURCES TABLE
| REAGENT or RESOURCE | SOURCE | IDENTIFIER |
|---|---|---|
| Antibodies | ||
| Goat anti-GFP | Abcam | ab6673, RRID: AB_305643 |
| Rabbit anti-RFP | Rockland | 600-401-379, RRID: AB_2209751 |
| Mouse anti-RFP (clone RF5R) | Thermo Fisher Scientific | MA5-15257, RRID: AB_10999796 |
| Mouse anti-E-Cadherin (clone 36/E-Cadherin) | BD Biosciences | 610182, RRID: AB_397581 |
| Rabbit anti-Notch1 (clone D1E11) | Cell Signaling | 3608, RRID: AB_2153354 |
| Rabbit anti-Cleaved Notch1 (Val1744) (clone D3B8) | Cell Signaling | 4147, RRID: AB_2153348 |
| Rabbit anti-Hes1 (clone D6P2U) | Cell signaling | 11988 |
| Rabbit anti-Olfm4 (clone D6Y5A) | Cell Signaling | 39141, RRID: AB_2650511 |
| Rabbit anti-YAP (clone D8H1X) | Cell Signaling | 14074, RRID: AB_2650491 |
| Rabbit anti-Ki67 (clone SP6) | Abcam | ab16667, RRID:AB_302459 |
| Rat anti-Ki67 (clone SolA15) | Thermo Fisher Scientific | 14-5698-82, RRID: AB_10854564 |
| Mouse anti-PCNA (clone CP10) | Santa Cruz Biotechnology | sc-56, RRID: AB_628110 |
| Rabbit anti-lysozyme | Biogenex | AR024-10R |
| Goat anti-Sucrase-Isomaltase | Santa Cruz Biotechnology | sc-27603, RRID: AB_2188721 |
| Goat anti-MMP7 | Santa Cruz Biotechnology | sc-8832, RRID: AB_649337 |
| Rabbit anti-Mucin 2 | Santa Cruz Biotechnology | sc-15334, RRID: AB_2146667 |
| Rabbit anti-Dclk1/DCAMKL1 | Abcam | ab37994, RRID: AB_873538 |
| Rabbit anti-Chromogranin A | ImmunoStar | 20085 |
| Rat anti-BrdU (clone BU1/75 [ICR1]) | Accurate Chemical | OBT0030G, RRID: AB_609567 |
| Rabbit anti-Phospho-TP53 (S18) | R &D Systems | AF1043-SP |
| Rabbit anti-Phospho-Stat3 (Y705) (clone D3A7) | Cell Signaling | 9145, RRID: AB_2491009 |
| BUV395 Rat anti-mouse CD45 (Clone 30-F11) | BD Biosciences | 564279 |
| PerCP/Cy5.5 Rat anti-mouse EpCAM (clone G8.8) | Biolegend | 118219 |
| APC/Fire750 Rat anti-mouse CD24 (clone M1/69) | Biolegend | 101839 |
| FITC Rat anti-mouse CD24 (clone M1/69) | Biolegend | 101805 |
| APC Armenian Hamster anti-mouse Notch1 (clone HMN1-12) | Biolegend | 130613 |
| Donkey anti-Rabbit, Alexa Fluor 488 | Thermo Fisher Scientific | A-21206 |
| Donkey anti-Rabbit, Alexa Fluor 546 | Thermo Fisher Scientific | A10040 |
| Donkey anti-Goat, Alexa Fluor 488 | Thermo Fisher Scientific | A-11055 |
| Donkey anti-Goat, Alexa Fluor 555 | Thermo Fisher Scientific | A-21432 |
| Donkey anti-Rat, Alexa Fluor 488 | Thermo Fisher Scientific | A-21208 |
| Donkey anti-Mouse, Alexa Fluor 555 | Thermo Fisher Scientific | A-31570 |
| Donkey anti-Mouse, Alexa Fluor 647 | Thermo Fisher Scientific | A-31571 |
| Biotinylated Horse Anti-Rabbit IgG Antibody | Vector Laboratories | BA-1100 |
| Bacterial and Virus Strains | ||
| / | / | / |
| / | / | / |
| Biological Samples | ||
| / | / | / |
| / | / | / |
| Chemicals, Peptides, and Recombinant Proteins | ||
| Tamoxifen | Sigma-Aldrich | T5648 |
| Tamoxifen tablet (21-day release) | Innovative Research of America | E-361 |
| Citric acid | Sigma-Aldrich | 251275 |
| Donkey serum | Sigma-Aldrich | D9663 |
| Bovine Serum Albumin | Sigma-Aldrich | A3294 |
| Thiazovivin | Sigma-Aldrich | SML1045 |
| Jagged1 | AnaSpec | 61298 |
| Recombinant Murine Wnt-3a | Peprotech | 315-20 |
| BrdU labeling reagent | Thermo Fisher Scientific | 000103 |
| EdU (5-ethynyl-2′-deoxyuridine) | Thermo Fisher Scientific | A10044 |
| TrypLE Express Enzyme (1X), phenol red | Thermo Fisher Scientific | 12605010 |
| Deoxyribonuclease I from bovine pancreas (DNase I) | Sigma-Aldrich | DN25 |
| Advanced DMEM/F12 medium | Thermo Fisher Scientific | 12634028 |
| IntestiCult™ Organoid Growth Medium | STEMCELL Technologies | 06005 |
| Fluorescein labeled Ulex Europaeus Agglutinin I (UEA) | Vector Laboratories | FL-1061 |
| Rhodamine labeled Ulex Europaeus Agglutinin I | Vector Laboratories | RL-1062 |
| TO-PRO-3 Iodide (642/661) | Thermo Fisher Scientific | T3605 |
| 4′,6-Diamidino-2-Phenylindole (DAPI) | Thermo Fisher Scientific | D1306 |
| SignalStain EDTA Unmasking Solution (10X) | Cell Signaling | 14747 |
| Dako Target Retrieval Solution, pH 6.1 (10×) | Agilent | S1699 |
| Prolong Gold antifade medium | Thermo Fisher Scientific | P36930 |
| Critical Commercial Assays | ||
| VECTASTAIN Elite ABC HRP Kit (Peroxidase, Standard) | Vector Laboratories | PK-6100 |
| DAB Peroxidase (HRP) Substrate Kit (with Nickel), 3,3′-diaminobenzidine | Vector Laboratories | SK-4100 |
| Click-iT™ EdU Alexa Fluor™ 555 Imaging Kit | Thermo Fisher Scientific | C10338 |
| Alexa Fluor™ 488 Tyramide SuperBoost™ Kit, goat anti-rabbit IgG | Thermo Fisher | B40922 |
| Alexa Fluor™ 488 Tyramide Reagent | Thermo Fisher | B40953 |
| RNeasy Plus Micro kit | Qiagen | 74034 |
| Deposited Data | ||
| Raw and analyzed data | This paper | GEO: GSE113536 |
| Experimental Models: Cell Lines | ||
| / | / | / |
| / | / | / |
| Experimental Models: Organisms/Strains | ||
| Mouse: Lyz1mCherry-IRES-CreER | This paper | In-house |
| Mouse: B6.129X1-Gt(ROSA)26Sortm1(EYFP)Cos/J | Jackson Laboratory | https://www.jax.org/strain/006148 |
| Mouse: B6. Cg-Gt(ROSA)26Sortm14(CAG-tdTomato) Hze/J | Jackson Laboratory | https://www.jax.org/strain/007914 |
| Mouse: Gt(ROSA)26Sortm1(Notch1)Dam/J | Jackson Laboratory | https://www.jax.org/strain/008159 |
| Mouse: Villin-CreER | Robine, S. | (el Marjou et al., 2004) |
| Mouse: β-Catenin flox (exon3) | Taketo, M. M. | (Harada et al., 1999) |
| Oligonucleotides | ||
| tdT primers: Forward, 5′-GCCCGGCTACTACTACGTGG-3′ and reverse, 5′-TACAGGAACAGGTGGTGGCG-3′ | This Paper | N/A |
| Hprt primers: Forward, 5′-TCCCTGGTTAAGCAGTACAGC-3′ and reverse, 5′-TCCAACAAAGTCTGGCCTGT-3′ | This Paper | N/A |
| Primers for β-Catenin exon 3 detection: F, 5′-CTGCGTGGACAATGGCTAC-3′, R1, 5′-CAGGGAAGGAGCTGTGGTGG-3′; and R2, 5′-TCGGACCCTCTGAGCCCTAG-3′ | This Paper | N/A |
| Primers for Internal control detection: oIMR8744, 5′-CAAATGTTGCTTGTCTGGTG-3′ and oIMR8745, 5′-GTCAGTCGAGTGCACAGTTT-3′ | This Paper | N/A |
| Recombinant DNA | ||
| / | / | / |
| / | / | / |
| Software and Algorithms | ||
| AIM 4.2 Service Pack 1 | Zeiss | https://www.zeiss.com/microscopy/us/downloads/lsm-5-series.html |
| Fiji software | https://fiji.sc | |
| Flowjo software 10.2 | TreeStar-BD | https://www.flowjo.com/solutions/flowjo/downloads |
| IDEAS software version 6.2 | Millipore | http://www.emdmillipore.com/US/en/life-science-research/cell-analysis-flow-cytometry/amnis-imaging-flow-cytometers/analysis-acquisition-software/ideas-software/qe2b.qB.Oq8AAAFLQM8Jx34R,nav |
| GSEA | Broad Institute | http://software.broadinstitute.org/gsea/index.jsp |
| Other | ||
| / | / | / |
| / | / | / |
Supplementary Material
Highlights.
Irradiation induced a subset of Paneth cells to acquire multi-potency
Irradiated Paneth cells had a stem cell-like transcriptome and organoid-forming ability
Forced activation of Notch pathway induced Paneth cell fate change
Constitutive activating Wnt/β-catenin pathway did not induce dedifferentiation
Acknowledgments
The authors are grateful to Drs. Alexis Rodriguez and Lanjing Zhang for helpful discussion of the project, and investigators in the group of Dr. Linda C. Samuelson (U. of Michigan) and Dr. Ken Lau (Vanderbilt U.) for sharing immunohistochemistry protocols. We are indebted to Dr. Ghassan Yehia (Rutgers Genome Editing Core Facility), Drs. Sukhwinder Singh, Hong Liu, and Tammy Mui-Galenkamp (Rutgers-NJMS Flow Cytometry Core), Kay Long, Larry Barbour and staffs (Newark Animal Facility), and Luke Fritzky (Rutgers-NJMS Histology Core) for numerous technical assistances and experimental coordination. This work was supported by grants from NIH (DK102934, DK093809, CA178599), NSF/BIO/IDBR [1353890], American Cancer Society [RSG-15-060-01-TBE], a Rutgers IMRT award to NG; R01CA190558 to MPV; R01AI134040 to GSY; a NSF Grant (IOS-1456673) to RPF; and two instruments grants (1S10ODO18103, 1S10RR027022-01A1) to Rutgers NJMS Flow Cytometry and Immunology Core Laboratory. SY is supported by a CCFA career development award (406794).
Footnotes
Publisher's Disclaimer: This is a PDF file of an unedited manuscript that has been accepted for publication. As a service to our customers we are providing this early version of the manuscript. The manuscript will undergo copyediting, typesetting, and review of the resulting proof before it is published in its final citable form. Please note that during the production process errors may be discovered which could affect the content, and all legal disclaimers that apply to the journal pertain.
AUTHOR CONTRIBUTIONS
Conceptualization, S.Y., E.M.B., M.P.V., and N.G.; Methodology, S.Y., K.T., Y.Z., I.B., R.P.F., and N.G.; Investigation, S.Y., K.T., M.P.V., and N.G.; Writing-Review & Editing, S.Y., E.M.B. I.B. M.P.V., and N.G.; Funding Acquisition, N.G.; M.P.V.; G.S.Y., R.P.F., and S.Y.; Resources, N.G., G.S.Y., R.P.F., and M.P.V.; Supervision, N.G., G.S.Y., and M.P.V.
DECLARATION OF INTERESTS
The authors declare no competing interests.
References
- Barker N. Adult intestinal stem cells: critical drivers of epithelial homeostasis and regeneration. Nat Rev Mol Cell Biol. 2014;15:19–33. doi: 10.1038/nrm3721. [DOI] [PubMed] [Google Scholar]
- Barker N, Ridgway RA, van Es JH, van de Wetering M, Begthel H, van den Born M, Danenberg E, Clarke AR, Sansom OJ, Clevers H. Crypt stem cells as the cells-of-origin of intestinal cancer. Nature. 2009;457:608–611. doi: 10.1038/nature07602. [DOI] [PubMed] [Google Scholar]
- Barker N, van Es JH, Kuipers J, Kujala P, van den Born M, Cozijnsen M, Haegebarth A, Korving J, Begthel H, Peters PJ, et al. Identification of stem cells in small intestine and colon by marker gene Lgr5. Nature. 2007;449:1003–1007. doi: 10.1038/nature06196. [DOI] [PubMed] [Google Scholar]
- Basak O, van de Born M, Korving J, Beumer J, van der Elst S, van Es JH, Clevers H. Mapping early fate determination in Lgr5+ crypt stem cells using a novel Ki67-RFP allele. EMBO J. 2014 doi: 10.15252/embj.201488017. [DOI] [PMC free article] [PubMed] [Google Scholar]
- Batlle E, Henderson JT, Beghtel H, van den Born MM, Sancho E, Huls G, Meeldijk J, Robertson J, van de Wetering M, Pawson T, et al. Beta-catenin and TCF mediate cell positioning in the intestinal epithelium by controlling the expression of EphB/ephrinB. Cell. 2002;111:251–263. doi: 10.1016/s0092-8674(02)01015-2. [DOI] [PubMed] [Google Scholar]
- Beumer J, Clevers H. Regulation and plasticity of intestinal stem cells during homeostasis and regeneration. Development. 2016;143:3639–3649. doi: 10.1242/dev.133132. [DOI] [PubMed] [Google Scholar]
- Bevins CL, Salzman NH. Paneth cells, antimicrobial peptides and maintenance of intestinal homeostasis. Nat Rev Microbiol. 2011;9:356–368. doi: 10.1038/nrmicro2546. [DOI] [PubMed] [Google Scholar]
- Buczacki SJ, Zecchini HI, Nicholson AM, Russell R, Vermeulen L, Kemp R, Winton DJ. Intestinal label-retaining cells are secretory precursors expressing Lgr5. Nature. 2013;495:65–69. doi: 10.1038/nature11965. [DOI] [PubMed] [Google Scholar]
- Cadwell K, Liu JY, Brown SL, Miyoshi H, Loh J, Lennerz JK, Kishi C, Kc W, Carrero JA, Hunt S, et al. A key role for autophagy and the autophagy gene Atg16l1 in mouse and human intestinal Paneth cells. Nature. 2008;456:259–263. doi: 10.1038/nature07416. [DOI] [PMC free article] [PubMed] [Google Scholar]
- Carulli AJ, Keeley TM, Demitrack ES, Chung J, Maillard I, Samuelson LC. Notch receptor regulation of intestinal stem cell homeostasis and crypt regeneration. Dev Biol. 2015;402:98–108. doi: 10.1016/j.ydbio.2015.03.012. [DOI] [PMC free article] [PubMed] [Google Scholar]
- Case RM. Synthesis, intracellular transport and discharge of exportable proteins in the pancreatic acinar cell and other cells. Biol Rev Camb Philos Soc. 1978;53:211–354. doi: 10.1111/j.1469-185x.1978.tb01437.x. [DOI] [PubMed] [Google Scholar]
- Clevers H. The intestinal crypt, a prototype stem cell compartment. Cell. 2013;154:274–284. doi: 10.1016/j.cell.2013.07.004. [DOI] [PubMed] [Google Scholar]
- Clevers HC, Bevins CL. Paneth cells: maestros of the small intestinal crypts. Annu Rev Physiol. 2013;75:289–311. doi: 10.1146/annurev-physiol-030212-183744. [DOI] [PubMed] [Google Scholar]
- el Marjou F, Janssen KP, Chang BH, Li M, Hindie V, Chan L, Louvard D, Chambon P, Metzger D, Robine S. Tissue-specific and inducible Cre-mediated recombination in the gut epithelium. Genesis. 2004;39:186–193. doi: 10.1002/gene.20042. [DOI] [PubMed] [Google Scholar]
- Farin HF, Jordens I, Mosa MH, Basak O, Korving J, Tauriello DV, de Punder K, Angers S, Peters PJ, Maurice MM, et al. Visualization of a short-range Wnt gradient in the intestinal stem-cell niche. Nature. 2016;530:340–343. doi: 10.1038/nature16937. [DOI] [PubMed] [Google Scholar]
- Fei P, El-Deiry WS. P53 and radiation responses. Oncogene. 2003;22:5774–5783. doi: 10.1038/sj.onc.1206677. [DOI] [PubMed] [Google Scholar]
- Frazee AC, Pertea G, Jaffe AE, Langmead B, Salzberg SL, Leek JT. Ballgown bridges the gap between transcriptome assembly and expression analysis. Nat Biotechnol. 2015;33:243–246. doi: 10.1038/nbt.3172. [DOI] [PMC free article] [PubMed] [Google Scholar]
- Fre S, Huyghe M, Mourikis P, Robine S, Louvard D, Artavanis-Tsakonas S. Notch signals control the fate of immature progenitor cells in the intestine. Nature. 2005;435:964–968. doi: 10.1038/nature03589. [DOI] [PubMed] [Google Scholar]
- Gao N, White P, Doliba N, Golson ML, Matschinsky FM, Kaestner KH. Foxa2 controls vesicle docking and insulin secretion in mature Beta cells. Cell Metab. 2007;6:267–279. doi: 10.1016/j.cmet.2007.08.015. [DOI] [PubMed] [Google Scholar]
- Garner JM, Fan M, Yang CH, Du Z, Sims M, Davidoff AM, Pfeffer LM. Constitutive activation of signal transducer and activator of transcription 3 (STAT3) and nuclear factor kappaB signaling in glioblastoma cancer stem cells regulates the Notch pathway. J Biol Chem. 2013;288:26167–26176. doi: 10.1074/jbc.M113.477950. [DOI] [PMC free article] [PubMed] [Google Scholar]
- Gregorieff A, Liu Y, Inanlou MR, Khomchuk Y, Wrana JL. Yap-dependent reprogramming of Lgr5(+) stem cells drives intestinal regeneration and cancer. Nature. 2015;526:715–718. doi: 10.1038/nature15382. [DOI] [PubMed] [Google Scholar]
- Haber AL, Biton M, Rogel N, Herbst RH, Shekhar K, Smillie C, Burgin G, Delorey TM, Howitt MR, Katz Y, et al. A single-cell survey of the small intestinal epithelium. Nature. 2017;551:333–339. doi: 10.1038/nature24489. [DOI] [PMC free article] [PubMed] [Google Scholar]
- Harada N, Tamai Y, Ishikawa T, Sauer B, Takaku K, Oshima M, Taketo MM. Intestinal polyposis in mice with a dominant stable mutation of the beta-catenin gene. EMBO J. 1999;18:5931–5942. doi: 10.1093/emboj/18.21.5931. [DOI] [PMC free article] [PubMed] [Google Scholar]
- Ireland H, Houghton C, Howard L, Winton DJ. Cellular inheritance of a Cre-activated reporter gene to determine Paneth cell longevity in the murine small intestine. Dev Dyn. 2005;233:1332–1336. doi: 10.1002/dvdy.20446. [DOI] [PubMed] [Google Scholar]
- Jadhav U, Saxena M, O’Neill NK, Saadatpour A, Yuan GC, Herbert Z, Murata K, Shivdasani RA. Dynamic Reorganization of Chromatin Accessibility Signatures during Dedifferentiation of Secretory Precursors into Lgr5+ Intestinal Stem Cells. Cell Stem Cell. 2017;21:65–77 e65. doi: 10.1016/j.stem.2017.05.001. [DOI] [PMC free article] [PubMed] [Google Scholar]
- Jiang H, Patel PH, Kohlmaier A, Grenley MO, McEwen DG, Edgar BA. Cytokine/Jak/Stat signaling mediates regeneration and homeostasis in the Drosophila midgut. Cell. 2009;137:1343–1355. doi: 10.1016/j.cell.2009.05.014. [DOI] [PMC free article] [PubMed] [Google Scholar]
- Karin M, Clevers H. Reparative inflammation takes charge of tissue regeneration. Nature. 2016;529:307–315. doi: 10.1038/nature17039. [DOI] [PMC free article] [PubMed] [Google Scholar]
- Kim D, Pertea G, Trapnell C, Pimentel H, Kelley R, Salzberg SL. TopHat2: accurate alignment of transcriptomes in the presence of insertions, deletions and gene fusions. Genome Biol. 2013;14:R36. doi: 10.1186/gb-2013-14-4-r36. [DOI] [PMC free article] [PubMed] [Google Scholar]
- Kim KW, Mutter RW, Cao C, Albert JM, Shinohara ET, Sekhar KR, Lu B. Inhibition of signal transducer and activator of transcription 3 activity results in down-regulation of Survivin following irradiation. Mol Cancer Ther. 2006;5:2659–2665. doi: 10.1158/1535-7163.MCT-06-0261. [DOI] [PubMed] [Google Scholar]
- Kim TH, Li F, Ferreiro-Neira I, Ho LL, Luyten A, Nalapareddy K, Long H, Verzi M, Shivdasani RA. Broadly permissive intestinal chromatin underlies lateral inhibition and cell plasticity. Nature. 2014;506:511–515. doi: 10.1038/nature12903. [DOI] [PMC free article] [PubMed] [Google Scholar]
- Kopan R, Ilagan MXG. The Canonical Notch Signaling Pathway: Unfolding the Activation Mechanism. Cell. 2009;137:216–233. doi: 10.1016/j.cell.2009.03.045. [DOI] [PMC free article] [PubMed] [Google Scholar]
- Korinek V, Barker N, Moerer P, van Donselaar E, Huls G, Peters PJ, Clevers H. Depletion of epithelial stem-cell compartments in the small intestine of mice lacking Tcf-4. Nat Genet. 1998;19:379–383. doi: 10.1038/1270. [DOI] [PubMed] [Google Scholar]
- Li N, Nakauka-Ddamba A, Tobias J, Jensen ST, Lengner CJ. Mouse Label-Retaining Cells Are Molecularly and Functionally Distinct From Reserve Intestinal Stem Cells. Gastroenterology. 2016;151:298–310 e297. doi: 10.1053/j.gastro.2016.04.049. [DOI] [PMC free article] [PubMed] [Google Scholar]
- Liu W, Morgan KM, Pine SR. Activation of the Notch1 Stem Cell Signaling Pathway during Routine Cell Line Subculture. Front Oncol. 2014;4:211. doi: 10.3389/fonc.2014.00211. [DOI] [PMC free article] [PubMed] [Google Scholar]
- Madisen L, Zwingman TA, Sunkin SM, Oh SW, Zariwala HA, Gu H, Ng LL, Palmiter RD, Hawrylycz MJ, Jones AR, et al. A robust and high-throughput Cre reporting and characterization system for the whole mouse brain. Nat Neurosci. 2010;13:133–140. doi: 10.1038/nn.2467. [DOI] [PMC free article] [PubMed] [Google Scholar]
- Merlos-Suarez A, Barriga FM, Jung P, Iglesias M, Cespedes MV, Rossell D, Sevillano M, Hernando-Momblona X, da Silva-Diz V, Munoz P, et al. The intestinal stem cell signature identifies colorectal cancer stem cells and predicts disease relapse. Cell Stem Cell. 2011;8:511–524. doi: 10.1016/j.stem.2011.02.020. [DOI] [PubMed] [Google Scholar]
- Mills JC, Andersson N, Stappenbeck TS, Chen CC, Gordon JI. Molecular characterization of mouse gastric zymogenic cells. J Biol Chem. 2003;278:46138–46145. doi: 10.1074/jbc.M308385200. [DOI] [PubMed] [Google Scholar]
- Mills JC, Sansom OJ. Reserve stem cells: Differentiated cells reprogram to fuel repair, metaplasia, and neoplasia in the adult gastrointestinal tract. Science signaling. 2015;8:re8. doi: 10.1126/scisignal.aaa7540. [DOI] [PMC free article] [PubMed] [Google Scholar]
- Munoz J, Stange DE, Schepers AG, van de Wetering M, Koo BK, Itzkovitz S, Volckmann R, Kung KS, Koster J, Radulescu S, et al. The Lgr5 intestinal stem cell signature: robust expression of proposed quiescent ‘+4’ cell markers. Embo J. 2012;31:3079–3091. doi: 10.1038/emboj.2012.166. [DOI] [PMC free article] [PubMed] [Google Scholar]
- Murray PJ. The JAK-STAT signaling pathway: input and output integration. J Immunol. 2007;178:2623–2629. doi: 10.4049/jimmunol.178.5.2623. [DOI] [PubMed] [Google Scholar]
- Murtaugh LC, Stanger BZ, Kwan KM, Melton DA. Notch signaling controls multiple steps of pancreatic differentiation. Proc Natl Acad Sci U S A. 2003;100:14920–14925. doi: 10.1073/pnas.2436557100. [DOI] [PMC free article] [PubMed] [Google Scholar]
- Nakanishi Y, Seno H, Fukuoka A, Ueo T, Yamaga Y, Maruno T, Nakanishi N, Kanda K, Komekado H, Kawada M, et al. Dclk1 distinguishes between tumor and normal stem cells in the intestine. Nat Genet. 2012;45:98–103. doi: 10.1038/ng.2481. [DOI] [PubMed] [Google Scholar]
- Ouyang W, Rutz S, Crellin NK, Valdez PA, Hymowitz SG. Regulation and functions of the IL-10 family of cytokines in inflammation and disease. Annu Rev Immunol. 2011;29:71–109. doi: 10.1146/annurev-immunol-031210-101312. [DOI] [PubMed] [Google Scholar]
- Pertea M, Kim D, Pertea GM, Leek JT, Salzberg SL. Transcript-level expression analysis of RNA-seq experiments with HISAT, StringTie and Ballgown. Nat Protoc. 2016;11:1650–1667. doi: 10.1038/nprot.2016.095. [DOI] [PMC free article] [PubMed] [Google Scholar]
- Pertea M, Pertea GM, Antonescu CM, Chang TC, Mendell JT, Salzberg SL. StringTie enables improved reconstruction of a transcriptome from RNA-seq reads. Nat Biotechnol. 2015;33:290–295. doi: 10.1038/nbt.3122. [DOI] [PMC free article] [PubMed] [Google Scholar]
- Robinson JT, Thorvaldsdottir H, Winckler W, Guttman M, Lander ES, Getz G, Mesirov JP. Integrative genomics viewer. Nat Biotechnol. 2011;29:24–26. doi: 10.1038/nbt.1754. [DOI] [PMC free article] [PubMed] [Google Scholar]
- Roth S, Franken P, Sacchetti A, Kremer A, Anderson K, Sansom O, Fodde R. Paneth cells in intestinal homeostasis and tissue injury. PLoS ONE. 2012;7:e38965. doi: 10.1371/journal.pone.0038965. [DOI] [PMC free article] [PubMed] [Google Scholar]
- Sakamori R, Yu S, Zhang X, Hoffman A, Sun J, Das S, Vedula P, Li G, Fu J, Walker F, et al. CDC42 Inhibition Suppresses Progression of Incipient Intestinal Tumors. Cancer Res. 2014;74:5480–5492. doi: 10.1158/0008-5472.CAN-14-0267. [DOI] [PMC free article] [PubMed] [Google Scholar]
- Sancho R, Cremona CA, Behrens A. Stem cell and progenitor fate in the mammalian intestine: Notch and lateral inhibition in homeostasis and disease. EMBO Rep. 2015;16:571–581. doi: 10.15252/embr.201540188. [DOI] [PMC free article] [PubMed] [Google Scholar]
- Sangiorgi E, Capecchi MR. Bmi1 is expressed in vivo in intestinal stem cells. Nat Genet. 2008;40:915–920. doi: 10.1038/ng.165. [DOI] [PMC free article] [PubMed] [Google Scholar]
- Sato T, van Es JH, Snippert HJ, Stange DE, Vries RG, van den Born M, Barker N, Shroyer NF, van de Wetering M, Clevers H. Paneth cells constitute the niche for Lgr5 stem cells in intestinal crypts. Nature. 2011;469:415–418. doi: 10.1038/nature09637. [DOI] [PMC free article] [PubMed] [Google Scholar]
- Sato T, Vries RG, Snippert HJ, van de Wetering M, Barker N, Stange DE, van Es JH, Abo A, Kujala P, Peters PJ, et al. Single Lgr5 stem cells build crypt-villus structures in vitro without a mesenchymal niche. Nature. 2009;459:262–265. doi: 10.1038/nature07935. [DOI] [PubMed] [Google Scholar]
- Srinivas S, Watanabe T, Lin CS, William CM, Tanabe Y, Jessell TM, Costantini F. Cre reporter strains produced by targeted insertion of EYFP and ECFP into the ROSA26 locus. BMC Dev Biol. 2001;1:4. doi: 10.1186/1471-213X-1-4. [DOI] [PMC free article] [PubMed] [Google Scholar]
- Subramanian A, Tamayo P, Mootha VK, Mukherjee S, Ebert BL, Gillette MA, Paulovich A, Pomeroy SL, Golub TR, Lander ES, et al. Gene set enrichment analysis: a knowledge-based approach for interpreting genome-wide expression profiles. Proc Natl Acad Sci U S A. 2005;102:15545–15550. doi: 10.1073/pnas.0506580102. [DOI] [PMC free article] [PubMed] [Google Scholar]
- Takeda N, Jain R, LeBoeuf MR, Wang Q, Lu MM, Epstein JA. Interconversion between intestinal stem cell populations in distinct niches. Science. 2011;334:1420–1424. doi: 10.1126/science.1213214. [DOI] [PMC free article] [PubMed] [Google Scholar]
- Taniguchi K, Wu LW, Grivennikov SI, de Jong PR, Lian I, Yu FX, Wang K, Ho SB, Boland BS, Chang JT, et al. A gp130-Src-YAP module links inflammation to epithelial regeneration. Nature. 2015 doi: 10.1038/nature14228. [DOI] [PMC free article] [PubMed] [Google Scholar]
- Tetteh PW, Basak O, Farin HF, Wiebrands K, Kretzschmar K, Begthel H, van den Born M, Korving J, de Sauvage F, van Es JH, et al. Replacement of Lost Lgr5-Positive Stem Cells through Plasticity of Their Enterocyte-Lineage Daughters. Cell Stem Cell. 2016;18:203–213. doi: 10.1016/j.stem.2016.01.001. [DOI] [PubMed] [Google Scholar]
- Thorvaldsdottir H, Robinson JT, Mesirov JP. Integrative Genomics Viewer (IGV): high-performance genomics data visualization and exploration. Brief Bioinform. 2013;14:178–192. doi: 10.1093/bib/bbs017. [DOI] [PMC free article] [PubMed] [Google Scholar]
- Tian H, Biehs B, Warming S, Leong KG, Rangell L, Klein OD, de Sauvage FJ. A reserve stem cell population in small intestine renders Lgr5-positive cells dispensable. Nature. 2011;478:255–259. doi: 10.1038/nature10408. [DOI] [PMC free article] [PubMed] [Google Scholar]
- Valerie K, Yacoub A, Hagan MP, Curiel DT, Fisher PB, Grant S, Dent P. Radiation-induced cell signaling: inside-out and outside-in. Mol Cancer Ther. 2007;6:789–801. doi: 10.1158/1535-7163.MCT-06-0596. [DOI] [PubMed] [Google Scholar]
- van Es JH, Jay P, Gregorieff A, van Gijn ME, Jonkheer S, Hatzis P, Thiele A, van den Born M, Begthel H, Brabletz T, et al. Wnt signalling induces maturation of Paneth cells in intestinal crypts. Nat Cell Biol. 2005;7:381–386. doi: 10.1038/ncb1240. [DOI] [PubMed] [Google Scholar]
- van Es JH, Sato T, van de Wetering M, Lyubimova A, Nee AN, Gregorieff A, Sasaki N, Zeinstra L, van den Born M, Korving J, et al. Dll1+ secretory progenitor cells revert to stem cells upon crypt damage. Nat Cell Biol. 2012;14:1099–1104. doi: 10.1038/ncb2581. [DOI] [PMC free article] [PubMed] [Google Scholar]
- VanDussen KL, Carulli AJ, Keeley TM, Patel SR, Puthoff BJ, Magness ST, Tran IT, Maillard I, Siebel C, Kolterud A, et al. Notch signaling modulates proliferation and differentiation of intestinal crypt base columnar stem cells. Development. 2012;139:488–497. doi: 10.1242/dev.070763. [DOI] [PMC free article] [PubMed] [Google Scholar]
- Wehkamp J, Salzman NH, Porter E, Nuding S, Weichenthal M, Petras RE, Shen B, Schaeffeler E, Schwab M, Linzmeier R, et al. Reduced Paneth cell alpha-defensins in ileal Crohn’s disease. Proc Natl Acad Sci U S A. 2005;102:18129–18134. doi: 10.1073/pnas.0505256102. [DOI] [PMC free article] [PubMed] [Google Scholar]
- Wehkamp J, Stange EF. Paneth’s disease. J Crohns Colitis. 2010;4:523–531. doi: 10.1016/j.crohns.2010.05.010. [DOI] [PubMed] [Google Scholar]
- Westphalen CB, Asfaha S, Hayakawa Y, Takemoto Y, Lukin DJ, Nuber AH, Brandtner A, Setlik W, Remotti H, Muley A, et al. Long-lived intestinal tuft cells serve as colon cancer-initiating cells. J Clin Invest. 2014;124:1283–1295. doi: 10.1172/JCI73434. [DOI] [PMC free article] [PubMed] [Google Scholar]
- Yan KS, Chia LA, Li X, Ootani A, Su J, Lee JY, Su N, Luo Y, Heilshorn SC, Amieva MR, et al. The intestinal stem cell markers Bmi1 and Lgr5 identify two functionally distinct populations. Proc Natl Acad Sci U S A. 2012;109:466–471. doi: 10.1073/pnas.1118857109. [DOI] [PMC free article] [PubMed] [Google Scholar]
- Yan KS, Gevaert O, Zheng GXY, Anchang B, Probert CS, Larkin KA, Davies PS, Cheng ZF, Kaddis JS, Han A, et al. Intestinal Enteroendocrine Lineage Cells Possess Homeostatic and Injury-Inducible Stem Cell Activity. Cell Stem Cell. 2017;21:78–90 e76. doi: 10.1016/j.stem.2017.06.014. [DOI] [PMC free article] [PubMed] [Google Scholar]
- Yu S, Nie Y, Knowles B, Sakamori R, Stypulkowski E, Patel C, Das S, Douard V, Ferraris RP, Bonder EM, et al. TLR sorting by Rab11 endosomes maintains intestinal epithelial-microbial homeostasis. The EMBO journal. 2014a;33:1882–1895. doi: 10.15252/embj.201487888. [DOI] [PMC free article] [PubMed] [Google Scholar]
- Yu S, Yehia G, Wang J, Stypulkowski E, Sakamori R, Jiang P, Hernandez-Enriquez B, Tran TS, Bonder EM, Guo W, et al. Global ablation of the mouse Rab11a gene impairs early embryogenesis and matrix metalloproteinase secretion. J Biol Chem. 2014b;289:32030–32043. doi: 10.1074/jbc.M113.538223. [DOI] [PMC free article] [PubMed] [Google Scholar]
- Yugawa T, Handa K, Narisawa-Saito M, Ohno S, Fujita M, Kiyono T. Regulation of Notch1 gene expression by p53 in epithelial cells. Mol Cell Biol. 2007;27:3732–3742. doi: 10.1128/MCB.02119-06. [DOI] [PMC free article] [PubMed] [Google Scholar]
- Zecchini V, Domaschenz R, Winton D, Jones P. Notch signaling regulates the differentiation of post-mitotic intestinal epithelial cells. Genes Dev. 2005;19:1686–1691. doi: 10.1101/gad.341705. [DOI] [PMC free article] [PubMed] [Google Scholar]
Associated Data
This section collects any data citations, data availability statements, or supplementary materials included in this article.