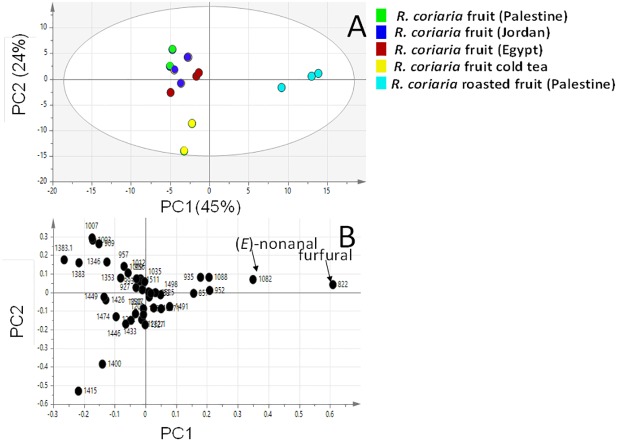
Figure 4. Principal component analyses of fresh, roasted and cold tea Rhus coriaria fruit (sumac) analyzed by SPME-GC–MS (n = 3).
Clusters are located at the distinct positions in two-dimensional space described by two vectors of principal component 1 (PC1) = 45% and PC2 = 24%. (A) Score plot of PC1 vs. PC2 scores. (B) Loading plot for PC1 & PC2 contributing mass peaks and their assignments, with each volatile denoted by its KI value.

