

Abstract
Objective:
Differences in insulin regulation of free fatty acids (FFA) are not readily apparent at the same insulin concentrations used to differentiate relative insulin-mediated glucose disposal. Resistance to insulin-mediated glucose disposal and higher daylong FFA concentrations occur more commonly in obese individuals. However, the relationship between the ability of insulin to suppress FFA release from adipose tissue and stimulate glucose disposal in muscle has not been clearly defined in this population. The current study was initiated to test the hypothesis that these two facets of insulin action are related, with greater defects in insulin-mediated glucose disposal associated with less effective insulin inhibition of FFA release from adipose tissue.
Methods:
Subjects included 56 healthy nondiabetic overweight/moderately-obese women classified as IR or IS based on whole-body glucose disposal. All underwent a modified 240min two-stage insulin-infusion, with basal (~15 uU/ml) and physiologically elevated (~80 uU/mL) steady-state insulin concentrations. Plasma glucose, insulin, FFA, and glycerol were measured throughout.
Results:
While plasma glucose differed most during physiological hyperinsulinemia in IR vs IS subjects, plasma FFA/glycerol differed most during basal insulin concentrations. FFA concentrations during the basal insulin steady state correlated highly (r=0.85, p<0.001) with glucose concentrations during the hyperinsulinemic steady state.
Conclusion:
Overweight/moderately-obese women exhibit dramatic differences in the ability of insulin to suppress plasma FFA, which correlate highly with differences in insulin-mediated glucose disposal. Variability in insulin-regulation of FFA is most apparent at basal insulin concentrations whereas differences in glucose disposal are most apparent during physiologic hyperinsulinemia. Both can be quantified using a simple two-stage insulin infusion study, with first-stage FFA concentrations and second-stage glucose concentrations being most informative.
Keywords: Insulin Resistance, Obesity, Lipolysis, Free Fatty Acids
Introduction
Although it has been apparent for at least 30 years that impairment in insulin-mediated glucose disposal by muscle is more likely to occur in obese individuals (1, 2), the ability of insulin to modulate adipose tissue release of free fatty acid (FFA) has been more controversial. Indeed, at one point it was argued (3) that while insulin-mediated glucose uptake by muscle was clearly abnormal in obese individuals with “maturity onset diabetes”, the ability of insulin to regulate FFA metabolism was normal, and that “insulin resistance may be selective for carbohydrate metabolism in these individuals.” It is now clear that this is not the case, and the confusion resulted from failure to take into account the fact that the dose response curve for these two aspects of insulin action is quite different (4, 5). Specifically, a much smaller increment in plasma insulin concentration is needed to lower plasma FFA concentration than is required to stimulate muscle glucose uptake (4, 5).
Abnormalities in insulin regulation of both muscle and adipose tissue play central roles in the pathogenesis of type 2 diabetes (6), and these defects in insulin action can also be seen in insulin resistant, nonobese, nondiabetic individuals (7, 8). Less information is available concerning the relationship between insulin action on muscle and adipose tissue associated with obesity, although there is evidence that daylong plasma insulin and FFA concentrations in response to test meals are higher in obese vs. nonobese, nondiabetic individuals (9). However, it is not clear if this is due to obesity, per se, or the fact that insulin resistance is more prevalent in obese individuals (1, 2). The current study was initiated to address this issue, based on the hypothesis that insulin-mediated glucose disposal by muscle and insulin inhibition of FFA release from adipose tissue are closely related in overweight/obese individuals, and the greater the defect in insulin action on muscle, the higher will be the plasma FFA concentrations. To accomplish this task, we performed a simpler version of the two-stage continuous infusion method described by Korenblat, et al (10). This approach recognizes the difference in the dose-response curves of insulin action on muscle and adipose tissue (4, 5), and involves measurements of relevant variables during a first stage at a “low” plasma insulin concentration, followed by a second state at a “high” plasma insulin concentration.
Materials and methods
Subjects
The experimental population consisted of 56 overweight/obese women from the greater San Francisco Bay area recruited by newspaper advertisements to participate in a study of the relationship between adiposity and insulin resistance. In order to be eligible for this study volunteers were required to have a body mass index (BMI) between 25.0 and 35.0 kg/m2, to be nondiabetic (fasting plasma glucose < 126 mg/dL), and without known major organ disease, chronic inflammatory conditions, pregnancy or lactation, active psychiatric condition, prior bariatric surgery, or malignancy, or laboratory evidence of anemia, liver, or kidney disease. Half of the women were postmenopausal (n=28) and the other half were pre (n=20) or perimenopausal (n=3) or on hormone replacement therapy (n=5). All subjects gave written, informed consent, and the study protocol was approved by the Stanford University Human Subjects Committee.
Description of Two-stage Insulin Infusion Study:
Volunteers meeting the general eligibility requirements were admitted to the Stanford Clinical Translational Research Unit (CTRU) for determination of the ability of insulin to stimulate muscle glucose uptake and inhibit adipose tissue lipolysis, using a simpler version of the two-stage infusion method described by Korenblat (10). The targeted “low” and “high” plasma insulin concentrations to be achieved during the two-stage infusion were ~ 15 μU/mL and ~ 80 μU/ml, respectively. These values were chosen to approximate the fasting plasma insulin concentrations of the participants (“low insulin”) and the postprandial values that occur (11, 12) in response to test-meals (“high insulin”).
In order to suppress endogenous insulin secretion, subjects were infused with octreotide (0.27 μg/m2 • min) during the entire study. Infusion rates of insulin and glucose during the first stage were 6 mU/m2 m2 • min, and 50 mg/ m2 • min, respectively. At 100–120 min, when steady state of the first stage was reached, blood was drawn at 10-min intervals, centrifuged and frozen, for measurement of plasma insulin, glucose, FFA, and glycerol concentrations. The mean of these three values represents the first stage steady-state plasma glucose SSPG), insulin (SSPI), FFA, and glycerol concentrations for each individual. After 120 min, the infusion of insulin and glucose were increased to 32 mU/m2 •min, and 267 mg/m2 •min, respectively. As during the first infusion, blood was drawn at 10-min intervals from 210 to 240 min of the infusion, and again centrifuged and frozen, for measurement of plasma glucose, insulin, FFA, and glycerol concentrations. The means of these four values represent the second stage steady-state plasma glucose, insulin, FFA, and glycerol concentrations. As SSPI concentrations are similar in all subjects during both stages of this test (due to octreotide suppression of endogenous insulin secretion), the glucose concentrations provide a direct measure of the ability of insulin to mediate muscle glucose uptake, and FFA and glycerol concentrations reflect the ability of insulin to suppress adipose tissue lipolysis.
Classification of subjects as IR or IS:
SSPG concentrations obtained during the second stage of the infusion were used to classify subjects as being IR or IS. Using the distribution of SSPG concentrations in 449 apparently healthy individuals with BMI distribution similar to that in NHANES (13), we classified those individuals whose SSPG concentrations put them in the upper 40% of the reference group as being IR, and those whose SSPG concentrations were in the lower 40% of as being IS. This designation is based on prospective studies demonstrating increased clinical morbidity in individuals with SSPG values in the top 30–40% of the distribution, with almost no morbid events occurring in the bottom 30–40% of the distribution (14, 15). Subjects not fitting into these operational definitions of IR and IS were excluded from further study.
Experimental measurements:
After a 12-hour overnight fast, lipid/lipoprotein concentrations were determined in the Clinical Laboratory at Stanford Medical Center. Glucose, insulin concentrations were determined as described in previous studies from our laboratory (7–9). FFA was measured via the WAKO enzymatic method (Richmond, VA), and free glycerol by enzymatic method (Sigma, St Louis, MO). Other experimental measurements included weight, measured with the subject in light clothing and bare feet, height, BMI, calculated as weight (kg) divided by height (m2), and waist circumference, measured at end-expiration as the point midway between the iliac crest and lower costal margin, race/ethnicity, and blood pressure (average of six readings taken after sitting quietly for 5 min).
Stastical analysis:
Student’s unpaired t-tests were used to compare normally-distributed variables between IR and IS groups, and chi-squared test was used for categorical variables. Comparisons included glucose, insulin, FFA, and glycerol during first (“low insulin”) and second (“high insulin”)-stages of the infusion, as well as clinical and demographic data. Fasting triglyceride and steady-state FFA concentrations during the second stage were log-transformed for normality. Pearson’s correlation coefficients were calculated for relationships between mean glucose and FFA (or log FFA) and glycerol during the steady states of the first and second stages, as well as between all metabolic variables and BMI. P<0.05 was defined as statistically significant.
Results
Table 1 presents the baseline characteristics of the two groups of experimental subjects. The IS and IR groups were well-matched in terms of age, race, BMI, and waist circumference. The IR group had significantly higher fasting plasma triglyceride and ALT concentrations, and systolic blood pressure tended to be higher.
Table 1.
Comparison of the Demographic and Clinical Characteristics of the Insulin Sensitive (IS) and Insulin Resistant (IR) Experimental Groups (mean ± SD)
| Variable | IS (n=28) | IR (n=28) | p-value |
|---|---|---|---|
| Age (yrs) | 51 ± 9 | 49 ± 9 | 0.49 |
| Race (a/b/c/h) | 1/0/24/2 | 6/2/17/3 | 0.11 |
| BMI (kg/m2) | 28.9 ± 1.8 | 29.5 ± 3.1 | 0.41 |
| Waist circumference (cm) | 96 ± 9 | 95 ± 8 | 0.80 |
| Systolic blood pressure (mmHg) | 118 ± 14 | 125 ± 14 | 0.08 |
| Diastolic blood pressure (mmHg) | 69 ± 8 | 73 ± 7 | 0.11 |
| Total cholesterol (mg/dL) | 196 ± 33 | 194 ± 30 | 0.84 |
| Triglycerides (mg/dL) | 74 ± 32 | 118 ± 59 | 0.001* |
| HDL-cholesterol (mg/dL) | 56 ± 13 | 50 ± 17 | 0.18 |
| LDL-cholesterol (mg/dL) | 125 ± 26 | 123 ± 27 | 0.83 |
| ALT (mg/dL | 21 ± 5 | 27 ± 9 | 0.004 |
log triglycerides used for statistical comparison
Plasma insulin, glucose, FFA, and glycerol concentrations of the IR and IS subgroups, before and at the end of each stage of the two-stage infusion study are seen in Table 2 and illustrated in Fig. 1. It should be emphasized that there were no differences in the plasma insulin concentrations between the two groups during either the “low insulin” (p=0.43) or “high insulin” (p=0.37) steady states. These data demonstrate that plasma glucose, FFA, and glycerol concentration were significantly higher in the IR subjects at the end of the ‘low insulin” infusion. It can also be seen from these data that the magnitude of the differences between the two groups was greatest in the case of FFA concentrations (2.5-fold) and least in terms of the glucose concentrations (1.3-fold).
Table 2.
Plasma Insulin, Glucose, FFA, and Glycerol Concentrations Before and at the End of the Two-Stage (100–120 min and 210–240 min) Insulin Suppression Test in the Insulin Sensitive (IS) and Insulin Resistant (IR) Experimental Groups (Mean ± SD). Stage I Represents “Low Insulin” and Stage II Represents “High Insulin” Infusion Periods.
| Variable | IS (n=28) | IR (n=28) | p-value | |
|---|---|---|---|---|
| Insulin (uU/mL) | Fasting | 11 ± 5 | 17 ± 7 | 0.001 |
| 100 – 120 min* | 16 ± 5 | 17 ± 6 | 0.43 | |
| 210 – 240 min** | 76 ± 21 | 82 ± 28 | 0.37 | |
| Stage I to II change | 419 ± 168% | 394 ± 120% | 0.52 | |
| Glucose (mg/dL) | Fasting | 86 ± 9 | 94 ± 12 | 0.01 |
| 100 – 120 min* | 88 ± 19 | 117 ± 28 | <0.001 | |
| 210 – 240 min** | 76 + 30 | 228 ± 43 | <0.001 | |
| Stage I to II change | −15 ± 20% | 99 ± 29% | <0.001 | |
| FFA (mmol/L) | Fasting | 496 ± 167 | 570 ± 175 | 0.11 |
| 100 – 120 min* | 186 ± 105 | 468 ± 140 | <0.001 | |
| 210 – 240 min** | 25 ± 17 | 64 ± 41 | <0.001 | |
| Stage I to II change | −85 ± 10% | −87 ± 7% | 0.40 | |
| Glycerol (umol/L) | Fasting | 89 ± 34 | 112 ± 40 | 0.03 |
| 100–120 min* | 51 ± 16 | 84 ± 20 | <0.001 | |
| 210–240 min** | 31 ± 10 | 42 ± 12 | <0.001 | |
| Stage I to II change | −40 ± 18% | −49 ± 13% | 0.045 |
100–120=mean of three measurements made 100, 110, and 120 min into the infusion
210–240=mean of four measurements made 210,220,230, and 240 min into the infusion; log of mean value used for statistical tests
Figure 1.
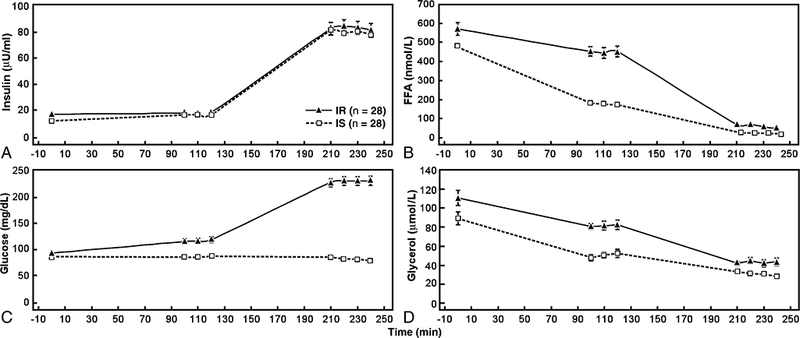
Mean (± SD) plasma insulin, FFA, glucose, and glycerol concentrations at baseline; during steady state of the first stage of the insulin suppression test (“low” insulin concentration); and during the steady state of the second stage of the insulin suppression test (“high” insulin concentration) in insulin sensitive (IS) and insulin resistant (IR) healthy overweight women.
Plasma glucose, FFA, and glycerol concentrations were also significantly higher in the IR group at the end of the “high insulin” infusion period, but the magnitude of the differences between the two groups was quite different. In this instance, plasma glucose concentrations were 3.0-fold higher in the IR group, whereas there was only a 1.4-fold difference in glycerol concentration. Figure 1 highlights the relative differences in substrates at each stage in IR vs IS subjects. Utilization of the two-stage test brings brings out greater relative disparity in FFA concentrations during the first stage (“low insulin”), and greater relative differences in glucoses concentrations during the second stage (“high insulin”). Finally, the % change in substrates between the “low insulin” and “high insulin” infusion rates showed no differences between IR and IS subjects with the exception of a significantly greater increase in glucose in IR subjects and a significantly greater decrease in glycerol in IR subjects.
As shown in Figure 2, the correlation between second-stage glucose concentrations and first-stage FFA concentrations was robust (r=0.85, p<0.001). Correlation between second-stage glucose concentrations and first-stage glycerol concentrations were similarly robust (r=0.71, p<0.001). Correlations between second-stage glucose concentrations and second-stage FFA and glycerol concentrations were not as strong, although they also reached statistical significance (r= 0.30, p=0.026 for FFA, and r=0.44, p=0.001 for glycerol). Interestingly, correlations with BMI were absent for FFAs (and glycerol) from either the “high” or “low insulin” steady states. Indeed, the only metabolic variable that correlated with BMI was glucose during the “high insulin” steady state (r=0.30, p<0.03).
Figure 2.
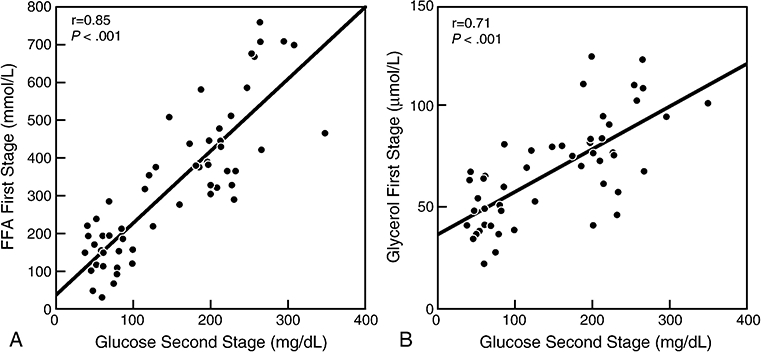
Panel A: Relationship between glucose concentration at the end of the second stage of the insulin suppression test (“high” insulin concentration) and free fatty acid (FFA) concentration at the end of the first stage of insulin suppression test (“low” insulin concentration); Panel B: Relationship between glucose concentration at end of second stage of the insulin suppression test and glycerol concentration at the end of the first stage of the insulin suppression test.
Discussion
The results of this study demonstrate that the presence of higher circulating FFA concentrations previously described in nondiabetic, obese individuals (9) is not a simple function of obesity, but is secondary to resistance of adipose tissue to insulin inhibition of lipolysis in the subgroup of obese individuals who also demonstrate resistance to insulin-mediated glucose disposal by muscle. As such, these data complement similar findings described in nonobese, nondiabetic individuals (7, 8). In addition, results of this study clearly demonstrate that the defects in insulin action on muscle and adipose tissue are highly correlated within any given individual. Specifically, individuals with relatively greater muscle insulin sensitivity, indicated by lower plasma glucose concentrations during the second stage of the insulin-suppression test (“high insulin”) also had low FFA and glycerol concentrations at the end of first stage of the test (“low insulin”), consistent with a decrease in the ability of insulin to suppress lipolysis. Conversely, individuals with high plasma glucose concentrations at the end of the second-stage of the test also had significantly higher FFA and glycerol concentrations at the end of the first stage of the test. Furthermore, FFA and glycerol concentrations at the end of the “low insulin” infusion period correlated highly with glucose concentrations at the end of the “high insulin “infusion period. These findings in overweight/obese individuals extend our prior findings that defects in the ability of insulin to suppress plasma FFA concentrations are correlated with comparable decreases in insulin-mediated glucose disposal in nonobese individuals (7, 8). The fact that glycerol concentrations were also different in the two obesity subgroups supports the conclusion that the higher plasma FFA concentrations in the IR group were the result of a decrease in insulin suppression of lipolysis, not increased re-esterification in adipose tissue. The lack of association between FFA concentrations and BMI within our specified range of 25–35 kg/m2 highlights the relative importance of the association between FFA and muscle insulin resistance. Indeed, prior findings of increased FFA concentrations in obese vs lean individuals (9) may be attributable to the obese groups being more “insulin resistant” than the lean groups, whereas in our study the resistant and sensitive groups were balanced according to BMI.
In an effort to be cognizant of the different dose-response curves characterizing insulin–mediated glucose disposal by muscle and insulin suppression of lipolysis by adipose tissue, we used a simpler version of the two-stage insulin infusion method described by Korenblat, et al (10). Our approach differed in that we modified the insulin suppression test as previously described by our research group (16–18), whereas they used the glucose clamp method. Furthermore, since we did not use isotopes to measure flux rates, the two insulin infusion periods were much shorter in our study. Perhaps of greater importance was our choice of the targeted insulin concentrations during each stage. Thus, the plasma insulin concentration during the “low insulin” infusion period in our study was ~ one-third less (~17vs.~50 μU/mL) than that used by Korenblat. (10). We selected that value for two reasons: 1) it approximated the fasting insulin concentrations of the two experimental groups; and 2) we had shown previously that plasma insulin concentration of ~ 20 μU/mL were capable of significantly decreasing plasma FFA concentrations during somatostatin-inhibition of insulin secretion (5). Furthermore, the insulin concentrations during our “high insulin” infusion period were somewhat less (~80 vs. ~100 μU/ml), a function of our effort to mimic plasma insulin concentrations in response to test-meals (11, 12).
The changes we have made to the protocol introduced by Korenblat, et al (10) certainly makes this test much simpler, and we feel that our use of a lower insulin concentration during the “low insulin” infusion is advantageous. On the other, we did not determine flux rates, and based on the studies of Bonen, et al it could be argued that the lower FFA concentrations In the IR group were due to a defect in FFA uptake, not decreased lipolysis. We cannot rule out that possibility, but there are two reasons why we suggest it might not apply. Firstly, Carpentier, et al (20) have shown in an elegant study that insulin modulates plasma FFA concentrations in vivo by regulating intracellular lipolysis in adipose tissue, not by affecting tissue FFA uptake. These findings are consistent with earlier findings by Groop, et al (21) who showed that plasma FFA concentrations and turnover over are highly correlated. Finally, the fact that changes in glycerol concentration paralleled those in FFA concentration does not support the view that resistance to insulin’s ability to promote FFA uptake is responsible for the changes we have described, as glycerol is not re-esterified in adipose tissue.
It could also be argued that the plasma insulin concentration during the “high insulin” infusion period were not high enough to have shut of hepatic glucose production, and we would have been better advised to use the higher insulin concentration as employed by Korenblat, et al (10). However, it should be noted that the mean plasma glucose concentration during the “high dose” insulin infusion period was 228 mg/dL. Given the combined effects of an insulin concentration of ~ 80 μU/mL and the ability of glucose to suppress hepatic glucose production (22), it seems unlikely that hepatic glucose production would not be inhibited in the IR subjects during the “high insulin” infusion period.
On a practical level, the results of this study demonstrate that it is possible to simultaneously quantify the ability of insulin to stimulate muscle glucose uptake and inhibit adipose tissue lipolysis in a relatively simple 4 hour infusion study. Measurements of plasma FFA concentrations in IR and IS individuals in the fasting state reveal only marginal and non-statistically-significant differences between the two groups, largely due to the fact that the fasting insulin concentrations in IR subjects are higher to compensate for insulin resistance and to maintain normoglycemia. However, during the first stage (“low insulin”) of the infusion study, when experimentally-induced insulin concentrations are comparable in all subjects, the ability of insulin to suppress FFA concentration is dramatically reduced in the IR as compared with the IS individuals, with a similar pattern seen for glycerol concentrations, emphasizing the resistance to insulin suppression of adipose tissue lipolysis in these individuals. In contrast, the difference in plasma glucose concentrations in the two groups at the end of the first-stage insulin infusion is modest. Thus, during the “low insulin” infusion period, the defect in the ability of insulin to inhibit adipose tissue lipolysis in IR individuals is magnified, and is clearly more apparent than the evidence of a defect in insulin stimulation of muscle glucose uptake.
Just the opposite conclusion can be drawn from the data obtained during the second-stage (“high Insulin”) infusion period. In this instance, plasma glucose concentrations at the end of the infusion are dramatically elevated in IR vs IS individuals, whereas the plasma FFA and glycerol concentrations are highly suppressed in both groups, albeit to a significantly greater degree in the IS vs the IR group. Under these experimental conditions, characterized by higher insulin concentrations, the defect in the ability of insulin to stimulate muscle glucose uptake in IR individuals is magnified, whereas differences between the two experimental groups in the inhibition of FFA and glycerol release are minimized.
We did not evaluate the use of even lower steady-state concentrations of insulin, and it is possible that at concentrations of 5–10 uU/ml the differences in FFA would be even more dramatic. Other limitations include application to a largely Caucasian and female-only population. Furthermore, these results may not necessarily apply to extremely obese individuals. Nevertheless, the current results extend those of our prior studies in nonobese individuals, demonstrating significant correlations between FFA concentrations during low-dose insulin infusion and glucose concentrations during high-dose insulin infusion done on a separate day (7, 8).
In conclusion, we have provided evidence that overweight/obese, nondiabetic women display considerable variability in the ability of insulin to promote glucose disposal and inhibit FFA release into plasma. Furthermore, these two facets of insulin action are highly correlated within a given individual; the greater the defect in glucose disposal, the higher will be the plasma FFA concentrations. A simple 4-hour test can be used to quantify both insulin-suppression of FFA (first stage) and insulin-mediated glucose disposal (second stage) by using standardized low and high-dose insulin concentrations.
Acknowledgements
None
Grant Support
NIH/NIDDK R01DK071309–01 and RR2HLL406, and by the Stanford Center for Clinical and Translational Education and Research (SCCTER) grant 1UL1 RR025744 from the National Center for Research Resources, National Institutes of Health
Abbreviations
- FFA
free fatty acids
- IR
insulin resistant
- IS
insulin sensitive
- SSPG
steady-state plasma glucose
- SSPI
steady-state plasma insulin
Footnotes
Disclosures
None
Author Contributions
Dr. McLaughlin oversaw this study, collected and analyzed data and was primarily responsible for the manuscript; Ms. Yee and Mr. Glassford performed all serum analyses; Ms. Lamendola assisted with human subjects issues, recruiting, and performing metabolic tests, and Dr. Reaven contributed to the design of the metabolic test and preparation of the manuscript.
Clinical Trials Indentifiers: NCT00186459, NCT00285844, NCT01336777
References
- 1.Rabinowitz D, Zierler KL, Forearm metabolism in obesity and its response to intra-arterial insulin: Characterization of insulin resistance and evidence for adaptive hyperinsulinism, J Clin Invest 41 (1962): 2173–2181. [DOI] [PMC free article] [PubMed] [Google Scholar]
- 2.Olefsky JM Reaven GM, Farquhar JW, Effects of weight reduction on obesity: studies of carbohydrate and lipid metabolism, J Clin Invest 53 (1974):64–76. [DOI] [PMC free article] [PubMed] [Google Scholar]
- 3.Howard BV, Savage PJ, Nagulesparan B, Bennion LJ, Unger RH, Bennett PH, Evidence for marked sensitivity to the anti-lipolytic action of insulin in obese maturity-onset-diabetes. Metabolism, 28 (1979):744–750. [DOI] [PubMed] [Google Scholar]
- 4.Rizza RA, Mandarino LJ, Gerich JE, Dose response characteristics for effects of insulin on production on utilization of glucose in man, Am J Physiol 240 (1981): E630–E639. [DOI] [PubMed] [Google Scholar]
- 5.Swislocki ALM, Chen Y-DI, Golay A, Chang M-O, Reaven GM, Insulin suppression of plasma-free fatty acid concentration in normal individuals, and patients with type 2 diabetes, Diabetologia 30 (1987): 622–626. [DOI] [PubMed] [Google Scholar]
- 6.Reaven GM, The Fourth Musketeer--from Alexandre Dumas to Claude Bernard, Diabetologia 38 (1995):3–13. [DOI] [PubMed] [Google Scholar]
- 7.Pei D, Chen Y-DI, Hollenbeck CB, Bhargava R, Reaven G, Relationship between insulin-mediated glucose disposal by muscle and adipose tissue lipolysis in healthy volunteers. J Clin Endocrinol Metab 80 (1995):3368–3372. [DOI] [PubMed] [Google Scholar]
- 8.Abbasi F, McLaughlin T, Lamendola C, Reaven GM, The relationship between glucose disposal in response to physiological hyperinsulinemia and basal glucose and free fatty acid concentrations in healthy volunteers, J Clin Endocrinol Metab 85 (2000):1251–1254. [DOI] [PubMed] [Google Scholar]
- 9.Golay A, Swislocki ALM, Chen Y-DI, Jaspan JB, Reaven GM, Effect of obesity on ambient plasma glucose free fatty acid, insulin, growth hormone, and glucagon concentrations, J Clin Endocrinol Metab 63 (1986):481–484. [DOI] [PubMed] [Google Scholar]
- 10.Korenblat KM, Fabbrini E, Mohammed BS, Klein S, Liver, muscle and adipose tissue insulin action is directly relied to intrahepatic triglyceride content in obese subjects, Gastroenterology 134 (2008): 1369–1375. [DOI] [PMC free article] [PubMed] [Google Scholar]
- 11.Kim SH, Abbasi F, Chu JW, McLaughlin TL, Lamendola C, Polonsky KS, Reaven GM, Rosiglitazone reduces glucose-stimulated insulin secretion and increases insulin clearance in nondiabetic, insulin resistant individuals, Diabetes 54 (2005); 2447–2452. [DOI] [PubMed] [Google Scholar]
- 12.McLaughlin T, Carter S, Lamendola C, Abbasi F, Yee G, Schaaf P, Basina M, Reaven GM, Effects of moderate variations in macronutrient composition on weight loss and reduction in cardiovascular disease risk in obese, insulin-resistant adults, Am J Clin Nutr 84 (2006): 813–821. [DOI] [PubMed] [Google Scholar]
- 13.Yeni-Komshian H, Carantoni M, Abbasi F, Reaven GM, Relationship between several surrogate estimates of insulin resistance and quantification of insulin -mediated glucose disposal in 490 healthy, nondiabetic volunteers, Diabetes Care 23 (2000): 171–5. [DOI] [PubMed] [Google Scholar]
- 14.Yip J, Facchini FS, Reaven GM, Resistance to insulin-mediated glucose disposal as a predictor of cardiovascular disease, J Clin Endocrinol Metab 83 (1998):2773–6. [DOI] [PubMed] [Google Scholar]
- 15.Facchini FS, Hua N, Abbasi F, Reaven GM, Insulin resistance as a predictor of age-related diseases, J Clin Endocrinol Metab 86 (2001):3574–8. [DOI] [PubMed] [Google Scholar]
- 16.Shen SW, Reaven GM, Farquhar JW, Comparison of impedance to insulin-mediated glucose uptake in normal subjects and in subjects with latent diabetes, J Clin Invest 49 (1970):2151–60. [DOI] [PMC free article] [PubMed] [Google Scholar]
- 17.Greenfield MS, Doberne L, Kraemer F, Tobey TA, Reaven GM, Assessment of insulin resistance with the insulin suppression test and the euglycemic clamp, Diabetes 30 (1981):387–92. [DOI] [PubMed] [Google Scholar]
- 18.Pei D, Jones CN, Bhargava R, Chen YD, Reaven GM, Evaluation of octreotide to assess insulin-mediated glucose disposal by the insulin suppression test, Diabetologia 37 (1994):843–5. [DOI] [PubMed] [Google Scholar]
- 19. Bonen A, Campbell SE, Benton CR, et al. , Regulation of fatty acid transport by fatty acid translocase/CD36, Proc Nutr Soc 63 (2004): 245–249. [DOI] [PubMed] [Google Scholar]
- 20.Carpenetier AC, Frisch F, Brassard P, et al. , Mechanism of insulin-stimulated clearance of plasma nonesterifed fatty acids in humans, Am J Physiol Endocrinol Metab 292 (2007): E693–E701. [DOI] [PubMed] [Google Scholar]
- 21.Groop LC, Bonadonna RC, DelPrato S, et al. , Glucose and free fatty acid metabolism in non-insulin –dependent diabetes mellitus: Evidence for multiple sites of insulin resistance, J Clin Invest 84 (1989): 205–213. [DOI] [PMC free article] [PubMed] [Google Scholar]
- 22.Wolfe RR, Allsop JR, Burke JF, Glucose metabolism in man, Metabolism 28 (1979): 210–220. [DOI] [PubMed] [Google Scholar]