

Abstract
The oral mucosa is a critical barrier tissue that protects the oral cavity against invading pathogens and foreign antigens. Interestingly, inflammation in the oral cavity is rarely observed, indicating that overt immune activation in this site is actively suppressed. Whether Foxp3+ Treg cells are involved in controlling immunity of the oral mucosa, however, is not fully understood. Here, we show that the oral mucosa is highly enriched for Foxp3+ Treg cells, and that oral mucosa Treg cells are phenotypically distinct from those of LN or spleen, as they expressed copious amounts of the tissue-retention molecule CD103 and unusually high-levels of CTLA-4. Acute depletion of Foxp3+ Treg cells had catastrophic effects, resulting in dramatic infiltration of activated effector T cells that were associated with autoimmunity and tissue destruction of the oral mucosa. Moreover, adoptive transfer of naïve CD4 T cells revealed that the oral mucosa is highly ineffective in inducing Foxp3 Treg cells in situ, so that it depends on recruitment and migration of exogenous Treg cells to populate this mucosal site. Collectively, these results demonstrate a previously unappreciated role and a distinct developmental pathway for Foxp3+ Treg cells in the oral mucosa, which were essential to control local tissue immunity.
Keywords: CD103, CTLA4, IFNγ, Scurfy
Introduction
The immune system faces a unique challenge in the oral mucosa. On the one hand, it needs to maintain immune quiescence to non-pathogenic food-, water- and air-borne antigens that are constantly ingested and inhaled. On the other hand, it also needs to remain immunocompetent against invading microbial pathogens1. In lymphoid tissues, the balance of tolerance versus immune activation is primarily controlled by T cells. The contribution of CD4+ regulatory T cells that express the transcription factor Foxp3 (Foxp3+ Tregs) is chief among them, as illustrated by the lethal systemic autoimmunity in Foxp3-deficient humans and mice2. Thus, understanding the role of Foxp3+ Tregs remains a key question in understanding tissue immunity. Whether Foxp3+ Treg cells also control immunity of the oral mucosa is an important question, that has not been fully addressed and remains incompletely understood3, 4.
The oral mucosa is densely populated with cells of hematopoietic origin5, 6, that not only contains macrophages, monocytes, and dendritic cells5, 7, but also comprise significant numbers of B and T cells6. We previously reported that the oral mucosa was highly enriched for CD4 T cells, which contrasts to the intestinal mucosa where CD8 lineage cells dominate6. While the precise phenotype of oral mucosal CD4 T cells is still under investigation, we were immediately intrigued whether such an increased frequency of CD4 T cells could be due to the accumulation of a particular CD4 T cell subset. Specifically, we asked whether the increased CD4 T cell frequency would reflect an increase in Foxp3+ CD25+ Treg cells to suppress overt autoimmune reactions against self-antigens or commensal bacterial antigens in the oral cavity.
While the oral mucosa is fully equipped to mount effective immune responses6, 8, it has remained unclear into which extent the antigen responsiveness of oral mucosal lymphocytes is subject to regulation by local Foxp3+ Treg cells. Treg cells have been identified and described in many peripheral organs, but their frequencies and detailed phenotypes widely differ in a tissue dependent manner9. Also, the origin of Foxp3 Treg cells varies in non-lymphoid tissues, so that thymus-derived Foxp3+ Treg cells (tTreg) are recruited by chemotactic signals to commingle with Foxp3+ Treg cells that are generated on site by activation and expansion through tissue specific antigens (pTreg)9, 10. Regardless of the developmental origin, however, tissue Foxp3 Treg cells are critical and non-redundant mediators of local immune tolerance11. Notably, tissue Treg cells control local inflammation not only by suppressing T cell activation but also by impacting the activity of neutrophils, macrophages and other myeloid subsets12. Despite their biological importance, there is little information available on the function and phenotype of Foxp3+ Treg cells within the oral mucosa. Most studies so far utilized immunohistochemistry or bulk cell RT-PCR analysis to identify the presence of Foxp3+ Treg cells in oral tissues13–15, so that a detailed understanding of the phenotype and function of Foxp3+ Treg cells at single cell resolution had been lacking.
In the current study, we analyzed Foxp3+ Treg cells from single cell suspension of enzymatically dissociated oral mucosal tissues and examining them by fluorescence-activated flow cytometry for their activation and differentiation status. Notably, we found that the oral mucosa was highly enriched for Foxp3+ Treg cells that further displayed a distinct phenotype from Treg cells in other peripheral tissues. Moreover, we document a previously unappreciated role of Foxp3+ Treg cells to induce and to maintain immune quiescence in mucosal tissues of the oral cavity, demonstrating a critical requirement of Foxp3+ Treg cells in this site.
Results
Identification of Foxp3+ Treg cells in the oral mucosa
Foxp3+ CD25+ CD4+ Treg cells in the oral mucosa were analyzed from pooled cells of the oral cavity epithelium and lamina propria of wild-type (WT) C57BL/6 mice. Immunohistochemistry showed that Foxp3+ Treg cells were present throughout the oral cavity, but mostly found in the lamina propria and enriched in the buccal mucosa and the posterior area of the tongue (Supplementary Figure 1a, b). Notably, the oral mucosa was highly enriched for mature Foxp3+ CD25+ Treg cells when compared to other mucosal barrier sites, such as the small intestine lamina propria (SI LP) and intraepithelial lymphocytes (IELs), (Figure 1a). Moreover, oral mucosa Treg cell frequency was also significantly increased compared to those in secondary lymphoid organs (SLO), such as lymph node (LN) and spleen. Altogether, we found that the oral mucosa contained the highest frequency of Foxp3+ Treg cells among all tissues that we assessed in this study (Figure 1b).
Figure 1. Identification and characterization of Foxp3+ Treg cells in the oral mucosa.
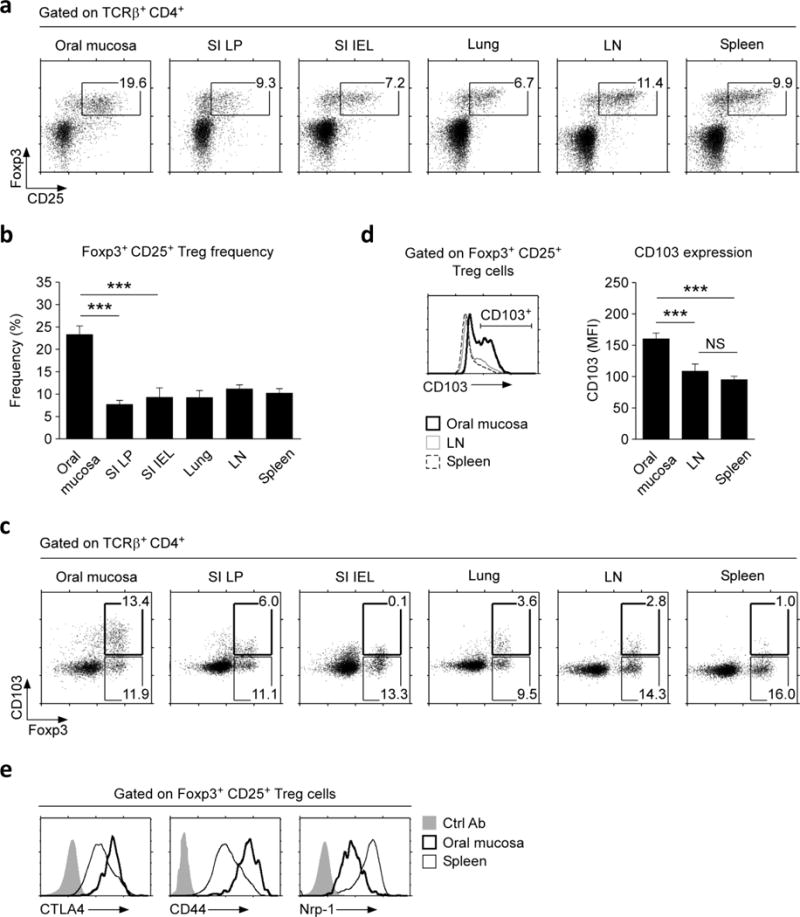
(a) Foxp3+ CD25+ Treg cells were identified among CD4+ T cells from the indicated organs of wild-type (WT) B6 mice. Dot plots are representative of three independent experiments.
(b) Frequencies of Foxp3+ CD25+ Treg cells among CD4+ T cells in the indicated organs, summarized from three independent experiments.
(c) CD103 expression was assessed on Foxp3+ CD4+ T cells from the indicated organs and tissues. Dot plots are representative of three independent experiments.
(d) CD103 expression on Foxp3+ Treg cells (histogram, left) and Mean Fluorescence Intensity (MFI) of CD103 expression levels on CD103+ Foxp3+ Treg cells (bar graph, right) from the oral mucosa, LN, and spleen. Results are representative and show summary of nine independent experiments.
(e) Activation/differentiation marker expression on Foxp3+CD25+ Treg cells from oral mucosa or spleen. Histograms are representative of three independent experiments and compared to control antibody (Ctrl Ab) staining.
To understand the molecular basis of Treg cell accumulation in the oral mucosa, we asked if oral mucosal Treg cells express tissue retention molecules that would entrap them in this site. Integrin CD103 is a surface molecule that binds to E-cadherin on epithelial cells to retain T cells in the skin and other barrier tissues16. Notably, a large fraction of oral mucosa Foxp3+ Treg cells were D103+ (Figure 1c, and Supplementary Figure 2a), and such CD103+ Treg cells expressed CD103 surface proteins in large quantities (Figure 1d). This was in marked contrast to Foxp3+ Treg cells from other tissues, where only a small fraction of Foxp3+ Treg cells expressed CD103, and the CD103 expression itself was also significantly lower (Figure 1c, d, and Supplementary Figure 2a). Thus, highly elevated CD103 expression is a discriminating feature of oral mucosal Foxp3+ Treg cells.
To examine if there are other distinguishing features of oral mucosa Treg cells, we assessed the expression of Cytotoxic T-lymphocyte-Associated protein 4 (CTLA4), CD44, and neuropilin-1 (Nrp-1), which are commonly used markers of Treg cell activation and differentiation17, 18. Oral mucosa Treg cells expressed large amounts of CTLA4 and CD44, and at significantly heightened levels compared to Treg cells in other tissues (Figure 1e and Supplementary Figure 2b, c). Expression of Nrp-1, however, was dramatically reduced (Figure 1e and Supplementary Figure 2b). Lack of Nrp-1 expression suggested that oral mucosal Treg cells might correspond to peripherally induced pTreg cells, but with the caveat that the fidelity of Nrp-1 as a thymus-derived Treg marker is controversial19–21. Altogether, we report that the oral mucosa harbors a uniquely large frequency of Foxp3+ Treg cells that are distinct in their activation and differentiation marker expression compared to Treg cells from other peripheral tissues.
Immune activation in the oral mucosa of Foxp3-deficient scurfy mice
To examine a requirement for Foxp3+ Treg cells in the oral mucosa, next, we analyzed scurfy mice, which are germline-deficient for Foxp3 (Foxp3sf)2. Scurfy mice display multi-organ failure due to systemic autoimmune reactions, as illustrated by heavy lymphocytic infiltrations into skin, lung, and LN (Supplementary Figure 3a)2, 22. Curiously, autoimmune inflammation in the small intestine mucosa of scurfy mice is markedly reduced, indicating a tissue-specific reliance on Foxp3+ Treg cells for maintaining peripheral tolerance (Supplementary Figure 3b)23. Consequently, we wished to know whether Foxp3 deficiency would affect immune tolerance in the oral mucosa. Upon assessing Foxp3sf scurfy mice, we found a dramatic increase in oral mucosa T cell frequencies concomitant to a loss of B cell frequencies (Figure 2a). Strikingly, the loss of B cell numbers was specific to the oral mucosa, because B cell numbers in peripheral lymphoid organs remained unaffected (Figure 2b, top). The increase in T cell numbers, on the other hand, was observed in all tissues, with the oral mucosa displaying the largest fold increase in T cell numbers (~10-fold) (Figure 2b, bottom). Increased T cell frequencies were further associated with massive T cell infiltration, as illustrated by anti-CD3 staining of tissue sections of the tongue, palate, and sublingual mucosa of Foxp3sf mice (Figure 2c). Characterization of infiltrating T cells showed that both CD4 and CD8 T cell populations were well represented (Figure 2d), but significantly skewed toward CD8 lineage cells (Figure 2d, lower left). The increase in CD8 frequency was not due to a decrease in CD4 T cell numbers, because we found CD4 T cell numbers being dramatically increased compared to those of WT mice (Figure 2d, lower right). Importantly, T cells from Foxp3sf mice displayed a highly activated phenotype, with heightened CD44 expression and increased frequencies of CD69+ cells (Supplementary Figure 4a, b). In agreement, CD4 effector T cells in the Foxp3sf oral mucosa also produced copious amounts of IFNγ (Figure 2e). Altogether, these results demonstrate that immune quiescence in the oral mucosa is breached in the absence of Foxp3+ Treg cells.
Figure 2. Oral mucosa lymphocytes in Foxp3-deficient scurfy mice.
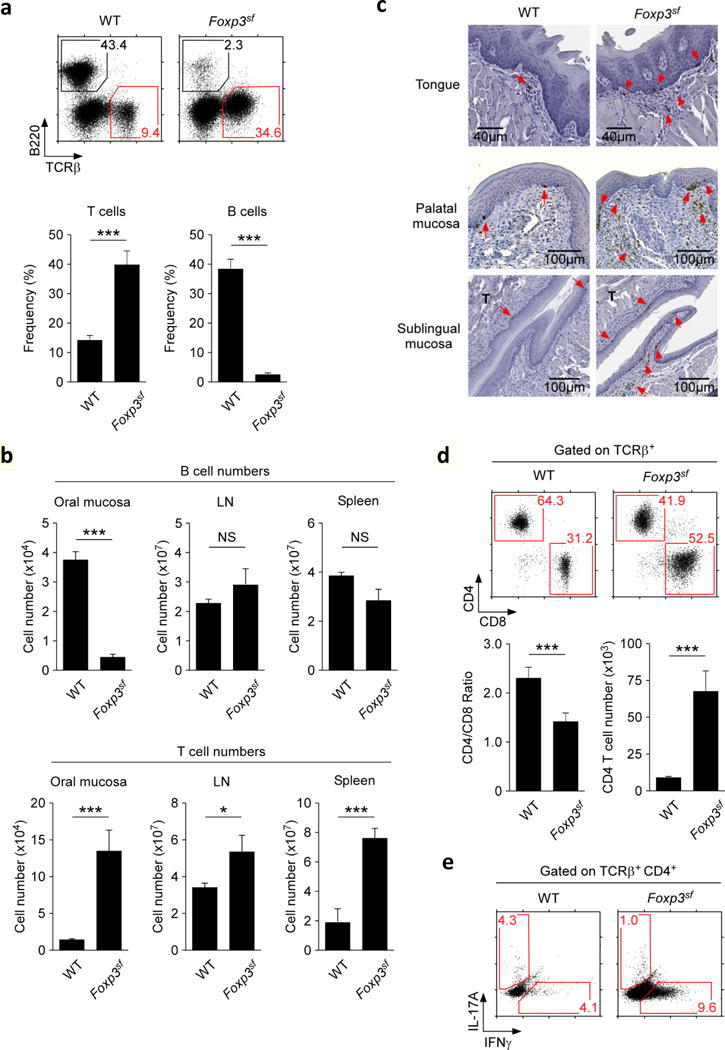
(a) Decreased frequencies of B cells (identified as B220+) but increased frequencies of T cells (identified as TCRβ+) in the oral mucosa of Foxp3sf mice. Dot plots (top) are representative and bar graphs (bottom) are summary of five independent experiments.
(b) B cell (top) and T cell numbers (bottom) from the indicated organs of WT and Foxp3sf mice. Results show summary of five independent experiments.
(c) Immunohistochemistry of the tongue, palatal, and sublingual mucosa of WT and Foxp3sf mice. CD3+ cells were identified with anti-CD3 antibodies and HRP-conjugated secondary antibodies (indicated by red arrow heads). Sections were counterstained with hematoxylin.
(d) CD4 versus CD8 expression of oral mucosa T cells in WT and Foxp3sf mice. Dot plots (top) are representative and bar graph (bottom) show summary of CD4/CD8 ratio and CD4 T cells numbers of five independent experiments.
(e) Intracellular staining for IL-17A and IFNγ in PMA + ionomycin stimulated oral mucosal CD4+ T cells of WT and Foxp3sf mice. Dot plots are representative of three independent experiments.
Along these lines, tissue migration and residency were also affected for myeloid cells and other antigen presenting cells, as documented in significant increase of CD11b+ cells but loss of CD11c+ dendritic cells (Supplementary Figure 4c, top), that was further associated with a decrease in CD11b+Ly6C− cells which are conventionally defined as patrolling monocytes (Supplementary Figure 4c, bottom)24, 25. Collectively, these results demonstrate a critical role for Foxp3+ Treg cells in maintaining immune quiescence of the oral mucosa.
Foxp3 is required to maintain immune quiescence in the oral mucosa
Scurfy mice are born with Foxp3-deficiency. Thus, the autoimmune phenotype of scurfy mice could indicate a role of Foxp3 Treg cells in establishing but also in maintaining immune tolerance in the oral mucosa. To discriminate between these possibilities, we acutely depleted Foxp3+ Treg cells in adult mice utilizing the Foxp3-DTR (Foxp3DTR) experimental system. In Foxp3DTR mice, a human diphtheria toxin receptor (DTR) is knocked-in into the Foxp3 gene locus, so that all Foxp3+ Treg cells express this receptor26. Administration of diphtheria toxin (DT) results in rapid depletion of Foxp3+ Treg cells, which we confirmed in the oral mucosa and other peripheral organs (Figure 3a and Supplementary Figure 5a). Loss of Foxp3+ cells resulted in a dramatic decrease of B cells in the oral mucosa that was concomitant to a significant increase of both T cell frequencies and numbers, thus phenocopying the immune phenotype of scurfy mice (Figure 3b and Supplementary Figure 5b). Similarly, we found that oral mucosal T cells in DT-injected Foxp3DTR mice displayed a highly activated phenotype, as indicated by expression of large amounts of the activation/differentiation marker CD44 (Figure 3c). Detailed analysis of CD4 T cell effector function revealed a dramatic increase in IL-4 and IFNγ production (Figure 3d), which would explain the increased expression of the activation memory marker CD44 on infiltrating T cells (Figure 3c)27. Furthermore, the change in the cytokine milieu and T cell activation also affected the myeloid compartment, so that we observed a substantial increase in CD11bhi CD11cneg monocytes in both frequencies and numbers (Figure 3e). Among the CD11bhi CD11cneg cells, the most dramatic increase was seen in the Ly6Cint population (Figure 3e, bottom), which could potentially correspond to neutrophils and/or pro-inflammatory monocytes25, 28.
Figure 3. Acute depletion of Foxp3+ Tregs induces T cell activation in the oral mucosa.
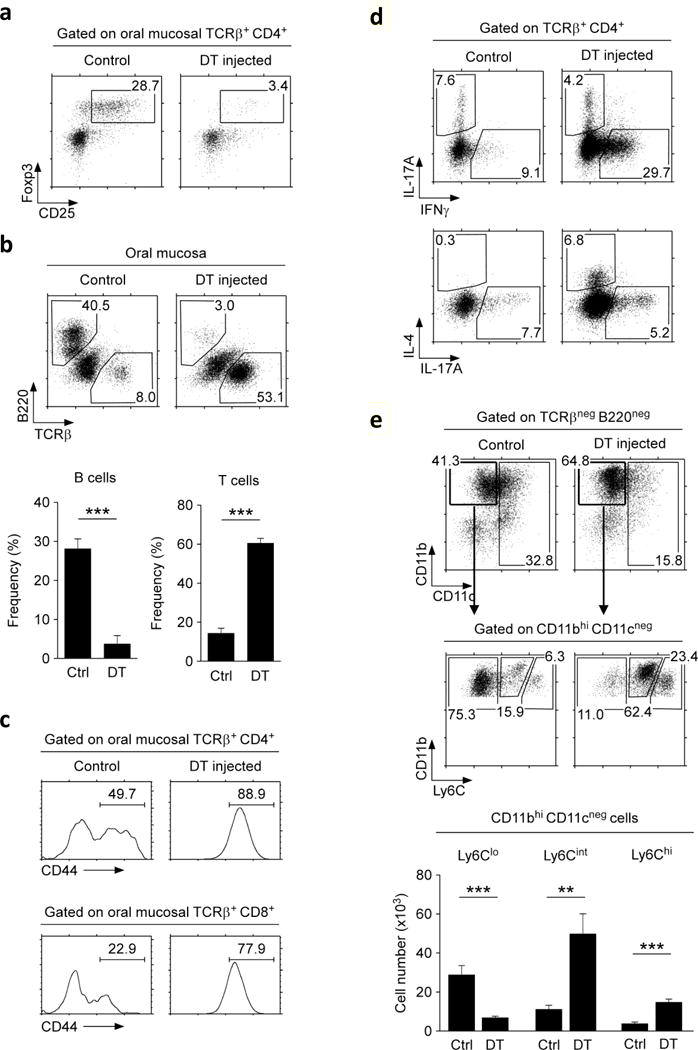
(a) Loss of Foxp3+CD25+ T cells upon DT administration into Foxp3DTR mice. CD4+ T cells from the oral mucosa were assessed for intracellular Foxp3 expression. Dot plots are representative of four independent experiments.
(b) Loss of B cells but increase in T cell frequency in the oral mucosa of Foxp3DTR mice. Dot plots (top) are representative and bar graphs (bottom) are summary of four independent experiments.
(c) Surface CD44 expression on oral mucosal CD4 and CD8 T cells of control- and DT-injected Foxp3DTR mice. Histograms are representative of four independent experiments.
(d) Intracellular staining for IL-17A versus IFNγ (top) and IL-4 versus IL-17A (bottom) in PMA + ionomycin stimulated oral mucosal CD4+ T cells of control and DT-injected Foxp3DTR mice. Dot plots are representative of three independent experiments.
(e) CD11c versus CD11b expression on non-T, non-B cells in the oral mucosa of control and DT-injected Foxp3DTR mice (top). CD11bhi CD11cneg cells were further assessed for Ly6C expression (middle) and enumerated for each subset based on the amount of surface Ly6C expression (bottom). Results are summary of three independent experiments.
To understand the underlying mechanism of autoimmune inflammation in the oral mucosa, we further characterized the infiltrating T cells. Increased of T cell numbers could be attributed to both CD4 and CD8 T cells, with a modest but preferential accumulation of CD8 T cells (Figure 4a). Notably, surface analysis for CD103 and CD69 expression showed a dramatic increase in CD69 expression for both CD4 and CD8 T cells (Figure 4b, c). CD69 can act as both an activation marker and a tissue retention molecule29. In context of T cell migration, CD69 interferes with S1P1 signaling so that it impairs T cell recirculation29. Because a large fraction of CD69+ cells co-expressed CD103, such CD69+CD103+ cells would be effectively entrapped in tissues. CD103 would cause tissue-retention and CD69 would inhibit tissue migration. In fact, we observed a dramatic accumulation of oral mucosal T cells upon Foxp3 depletion, and we found them to be highly enriched in the epithelial-lamina propria junction of the all sites in the oral mucosa (Figure 4d). Collectively, these findings demonstrate a previously underappreciated role for Foxp3+ Treg cells in maintaining immune quiescence of the oral mucosa.
Figure 4. Tissue retention molecule expression on DT-injected Foxp3DTR oral mucosal T cells.
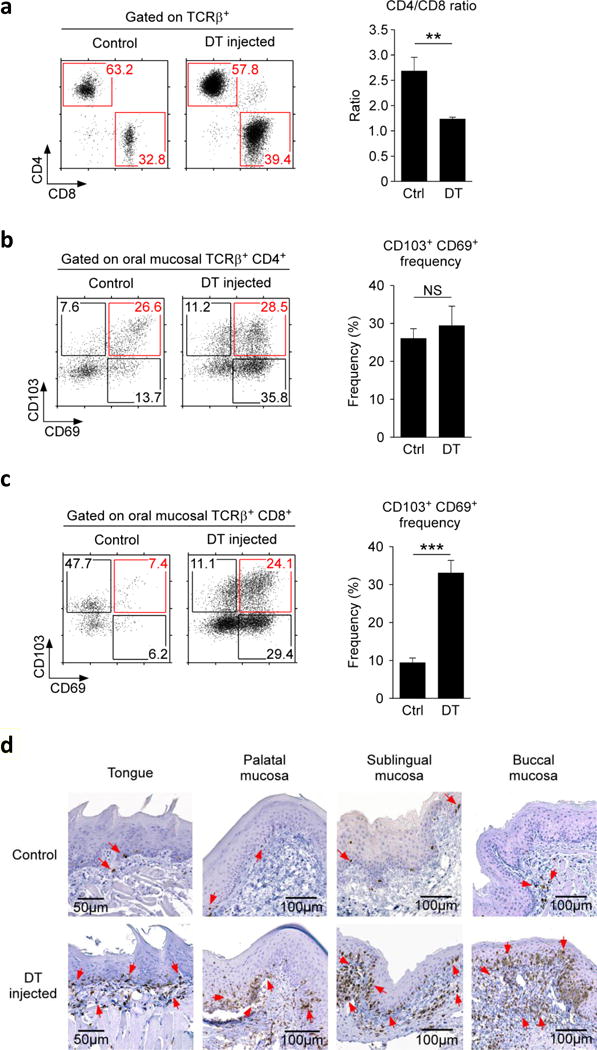
(a) CD4 versus CD8 expression profiles and ratio of oral mucosal T cells in control or DT injected Foxp3DTR mice. Dot (left) plots are representative and bar graphs (right) are summary of four independent experiments.
(b, c) CD69 versus CD103 expression on oral mucosal CD4 (b) and CD8 T cells (c) of Foxp3DTR mice. Dot plots are representative and bar graphs are summary of five independent experiments.
(d) Immunohistochemistry of the tongue, palatal, sublingual and buccal mucosa of control and DT-injected Foxp3DTR mice. CD3+ cells were identified with anti-CD3 antibodies and HRP-conjugated secondary antibodies (indicated by red arrow heads). Sections were counterstained with hematoxylin.
CD103 is dispensable for tissue residency of Foxp3+ Treg cells in the oral mucosa
Because of the uniquely large amounts of CD103 that they expressed, we wished to know if CD103 is required to establish tissue residency of Foxp3+ Treg cells in the oral cavity. Analysis of CD103-deficient mice (Cd103KO), however, revealed that the size of the Treg compartment in the oral mucosa were virtually unaffected compared to WT mice (Figure 5a). Thus, we report the unexpected finding that increased CD103 expression is associated with oral mucosa Treg cells but not required for their retention in tissues. To exclude the possibility that Cd103KO Treg cells would differ in their activation or differentiation status compared to WT cells, we also examined CTLA4, CD44, and Nrp-1 expression (Figure 5b). We did not find any significant phenotypic differences between WT and Cd103KO Treg cells in the oral mucosa, which indicated that CD103 is also not required to establish the phenotypic characteristics of oral mucosal Foxp3+ Treg cells (Figure 5b). Altogether, these results report that oral mucosa Foxp3+ Treg cells express surface markers, i.e. CD69 and CD103, similar to tissue-resident memory T cells30, but do not depend on CD103 for their tissue residency in the oral mucosa.
Figure 5. Identification of oral mucosa Foxp3+ Treg cells in the absence of CD103.
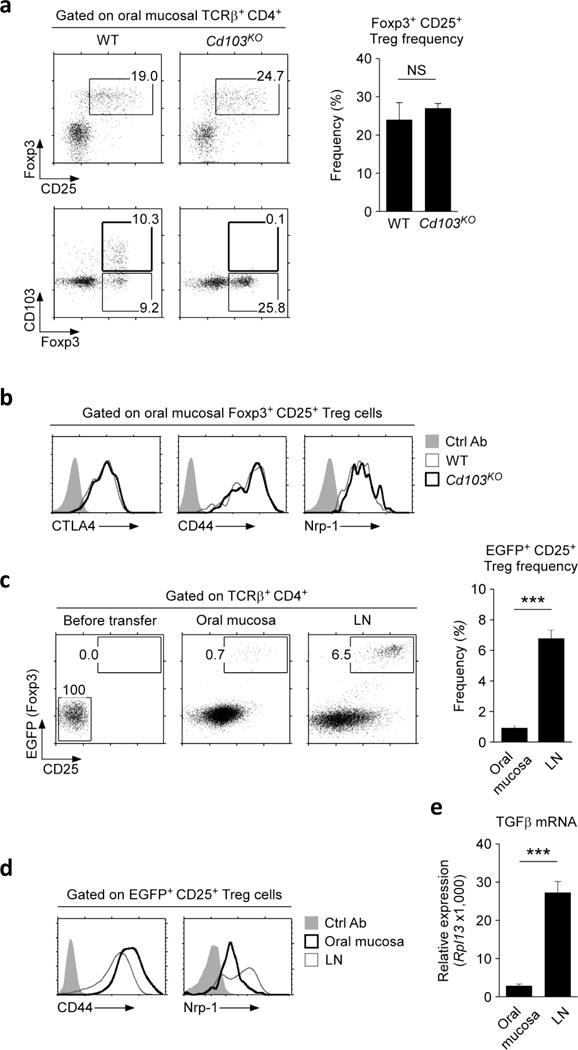
(a) Frequency and phenotype of Foxp3+CD25+ T cells in the oral mucosa of WT and Cd103KO mice. Dot plots are representative and bar graphs are summary of three independent experiments.
(b) Activation/differentiation marker expression on oral mucosal Foxp3+CD25+ Treg cells from WT and Cd103KO mice. Histograms are representative of three independent experiments.
(c) CD25 and Foxp3-EGFP reporter protein expression in adoptively transferred naïve CD4+ T cells. CD25, Foxp3-negative donor cells were electrically sorted from Foxp3-EGFP reporter LN and spleen T cells (left), and transferred into Rag2KO host mice. Five~ six weeks after transfer, donor T cells were recovered from the oral mucosa (middle) or LN (right) and assessed for CD25 and Foxp-EGFP reporter protein expression. Dot plots are representative and bar graphs are summary of five independent experiments with nine host mice.
(d) Activation/differentiation marker expression on Foxp3-EGFP+CD25+ Treg cells from the oral mucosa or LN after adoptive transfer. Histograms are representative of three independent experiments.
(e) TGFβ mRNA expression was determined from the oral mucosa or LN of unmanipulated Rag2KO mice. qRT-PCR signals were normalized to Rpl13 mRNA expression, and data are summary of two independent experiments.
Inefficient generation of Foxp3+ Treg cells in the oral mucosa
To further understand the tissue origin of oral mucosal Foxp3+ Treg cells, we asked if the oral mucosa itself can give rise to Treg cells. To this end, we electronically sorted Foxp3, CD25-negative CD4+ LN and spleen T cells (Tconv) from Foxp3-EGFP reporter mice31, and adoptively transferred them into Rag2-deficient hosts. Because donor CD4+ Tconv cells were devoid of pre-existing Foxp3+ Treg cells, any Foxp3-EGFP reporter positive cells in the host are necessarily generated from Tconv donor cells in peripheral tissues. Treg cells that are peripherally induced in situ are commonly referred to as pTregs32, 33, and this adoptive transfer system has been previously established as an effective model to visualize generation of pTreg cells34. After 5–6 weeks of transfer, we recovered donor T cells from the oral mucosa and LN and assessed generation of Foxp3+ Treg cells. While CD4 donor T cells efficiently populated both tissues (Supplementary Figure 6a, b), Foxp3-EGFP+ CD25+ pTreg cells were conspicuously absent in the oral mucosa (Figure 5c). These results report the surprising finding that the oral mucosa is an inefficient site to induce pTreg cell differentiation. Interestingly, other mucosal tissues such as the SI LP, IEL and lung, also displayed markedly reduced efficiency in inducing pTreg cells (Supplementary Figure 6c), suggesting that mucosal sites in general represent an unfavorable environment for Foxp3+ Treg cell development. Notably, the few Foxp3+ Treg cells that were found in the oral mucosa expressed features that characteristic of oral mucosa Treg cells as they were CD44hi, but Nrp-1low (Figure 5d). Thus, the tissue environment drives the phenotypic differentiation of Foxp3+ Treg cells. Mechanistically, we found that the oral mucosa expressed significantly less amounts of TGFβ, a cytokine that is essential for pTreg cell generation35, compared to the LN (Figure 5e). These results suggest that the lack of TGFβ signaling could be a contributing factor to the inability of the oral mucosa to induce Foxp3+ Treg cells. Collectively, these results suggest that the tissue origin of oral mucosal Treg cells is extrinsic to the oral mucosa. Presumably, these Foxp3+ Treg cells are generated in peripheral tissues or in the thymus, from which they migrate into and then take residency in the oral mucosa to control T cell immunity.
Discussion
The oral mucosa comprises a complex assembly of stromal and hematopoietic origin cells that protect the oral cavity from pathogenic agents6. Here, we examined the distribution and phenotype of lymphoid cells in the oral mucosa, and specifically focused on Foxp3+ Treg cells. Notably, Foxp3+ Treg cells were highly enriched in the oral mucosa, and we found them necessary to maintain immune quiescence in this site. Treg cells in the oral mucosa differed from their counterparts in other peripheral organs, as they expressed large amounts of CD103 at high frequency. While increased CD103 expression correlated with accumulation of oral mucosal Treg cells, interestingly, CD103 was not required to recruit or to retain Foxp3+ Treg cells in the oral mucosa. Consequently, the frequency and effector phenotype of oral mucosal Foxp3+ Treg cells did not differ between WT and CD103-deficient mice. Collectively, these results reveal a role for Foxp3+ Treg cells to suppress autoimmunity and inflammation in oral tissues, and they identify Foxp3+ Treg cells as a critical component of the immune landscape of the oral mucosa.
Foxp3+ T cells are either generated in the thymus or induced in peripheral tissues, and they are known as tTreg or pTreg, respectively33. Depending on their tissue origin, Foxp3+ Treg cells are proposed to have different functions so that tTreg cells would be selected by self-antigens to control systemic immunity, while pTreg cells are induced by local tissue antigens to be involved in local immune suppression36. Reliable phenotypic markers to discriminate between these two populations are currently not available. Nonetheless, expression of some activation markers, such as helios and Nrp-1, have been associated with features corresponding to tTreg cells21, 33, 37. Along these lines, oral mucosal Treg cells expressed substantially lower amounts of Nrp-1, which suggested a peripherally induced tissue origin of these cells20. However, our naïve CD4 T cell adoptive transfer experiments reported the oral mucosa as a highly ineffective site for pTreg cell generation. Thus, oral mucosal Treg cells are presumably recruited from other peripheral sites. Importantly, we found that other mucosal tissues such as the small intestine mucosa and the lung were also inefficient in inducing Treg cells in situ. Because donor CD4 T cells effectively populated these mucosal sites, we consider this result an indication that the mucosal environment represents an unfavorable environment for Foxp3+ Treg cell differentiation. The underlying molecular basis for such inefficiency is currently not clear to us, but we consider diminished availability of cytokines, such as TGFβ or IL-2, in these tissues as a possibility. Per this scenario, tTreg or pTreg cells would migrate into and populate the oral mucosa, upon which the local tissue environment would impose their characteristic phenotype of expressing large quantities of CTLA-4 and CD103.
CD103 is widely accepted as a surface marker that is required for tissue-resident memory CD8 T cells38. A role of CD103 in CD4 lineage T cells, however, is uncertain because newly generated CD4+ thymocytes and mature CD4 T cells in peripheral tissues do not express CD10339. Nonetheless, a small (2~6%) population of CD103+ CD4 T cells in lymphoid organs do express CD103. Curiously, most of these CD103+ CD4 T cells (~75%) corresponded to Foxp3+ Treg cells40. Thus, Foxp3+ Treg cells are quite unusual among CD4 T cells by expressing CD103. Further detailed analysis, however, revealed that not all Treg cells express CD103, and that CD103 expression is heterogenous among Foxp3+ Treg cells41, 42. On the other hand, CD103 expression has been associated with distinct Treg cell effector functions, so that CD103+ Treg cells are the most potent regulatory T cells40, 43, 44. In fact, CD103+ Foxp3+ Treg cells express higher levels of IL-10 than their CD103− counterpart, and they are also more potent in in vitro suppression assays and in suppressing in vivo SCID colitis40. Finally, only the CD103+, and not the CD103− Treg cell subset suppressed chronic GVHD in a mouse model44, further demonstrating the significance and potency of this subset. Thus, we consider it important that the oral mucosa is highly enriched in CD103+ Treg cells, suggesting a special requirement for this subset to suppress frequent immune challenges in this tissue.
A role for CD103+ Foxp3+ Treg cells is exemplified in gut immunity, where they were found to be critical to maintain immune quiescence41, 43. Contrary to these observations, however, a study by the Powrie group proposed that CD103 expression on T cells is not relevant and, instead, CD103 expression on dendritic cells (DC) is critical to maintain immune quiescence, at least in a T cell transfer model of colitis45. These contradictory observations can be reconciled if CD103 would be considered as a surface marker rather than a direct mediator of immune suppression. As such, our finding that Foxp3+ Treg cell frequency and their phenotype did not differ between WT and Cd103KO mice further supports the idea that CD103 expression marks mucosal Foxp3+ T cells but it is not required for their tissue residency or function.
The biological significance of the heavy accumulation of Foxp3+ Treg cells in the oral mucosa is not quite clear. The oral mucosa is proposedly an immune privileged tissue which maintains tolerance towards commensal microbes and food antigens by the orchestrated efforts of different cells and molecules, that include CD1a+ resident dendritic cells and secretory IgA molecules produced by plasma cells in salivary glands46, 47. So far, a non-redundant tolerogenic effect of Foxp3+ Treg cells for the oral mucosa, however, had not been directly demonstrated. The oropharyngeal area serves as the entry port for both the gastrointestinal and respiratory tracts, and thus experiences the most frequent trafficking of particulate and soluble air- and water-borne antigens. Consequently, immune suppression by Foxp3+ Treg cells would be important. In fact, the acute loss of Foxp3+ Treg cells resulted in massive infiltration of CD11c-negative Ly6Chi proinflammatory monocytes, which was accompanied by a dramatic increase in Ly6Cint cells that could either represent neutrophils or Ly6Chi cells that are in the process of transitioning into Ly6Clo monocytes with anti-inflammatory function24, 48. In this regard, the current study directly demonstrated their requirement to maintain homeostasis and prevent autoimmunity in the oral mucosa. Indiscriminative T cell suppression, however, needs to be avoided. Active T cell effector function is critical to protect the oral mucosa, as illustrated in immunocompromised HIV patients who are highly susceptible to oral and pharyngeal Candida albicans infection49. The same can be observed in mouse models of IL-17-producing Th17 cell deficiencies where they develop severe candidiasis in the oral cavity50. Thus, the oral mucosa also requires competent T cell immunity to fight off infections and prevent colonization of pathogenic microbes. Because Treg cells are immunosuppressive, at first sight, the accumulation of Foxp3+ Treg cells in the oral mucosa seems counterintuitive to elicit potent T cell immune response. However, there is an increasing body of evidence that Foxp3+ Treg cells can promote generation of pro-inflammatory effector T cells, as demonstrated in mouse models of oral candidiasis and experimental encephalomyelitis51, 52. Mechanistically, Foxp3+ Treg cells were found to promote generation of IL-17-producing Th17 cells by consuming IL-2, which is an important survival factor but also a negative regulator of Th17 differentiation53–55, and by producing cytokine TGF-β56. Thus, Foxp3+ Treg cells in the oral mucosa could also play a critical role in maintaining the balance of immune suppression and activation in face of both commensal and pathogenic antigens. Along these lines, it would be interesting and important to examine any changes in the microbiota of the oral mucosa in the presence or absence of Foxp3+ T reg cells, and these are precisely issues that we aim to address in our future studies. Collectively, the current study identified and characterized Foxp3+ Treg cells in the oral mucosa, providing new insights into the concerted actions of Treg cells in maintaining both immune competence and quiescence in mucosal barrier tissues.
Materials and Methods
Animals
C57BL/6 (wild-type) mice of both sexes were purchased from Charles River Laboratories and analyzed between 6–12 weeks of age. Rag2KO, Foxp3sf (scurfy), Foxp3DTR, Foxp3-EGFP reporter (Foxp3EGFP/icre), and Cd103KO mice were acquired from Jackson Laboratory. Foxp3tm1Kuch reporter mice were a kind gift of Dr. V. Kuchroo (Harvard Medical School, Boston, MA)31. All animal experiments were approved by the NCI Animal Care and Use Committee, and all mice were cared for in accordance with NIH guidelines.
Reagents and Antibodies
The following antibodies were used for flow cytometry staining: Foxp3 (FJK-16s), CD25 (PC61.5), IL-17A (eBio17B7), TCRβ (H57-597), B220 (RA3-6B2), CD11b (M1/70), CD44 (IM7), CD103 (2E7), CD69 (H1.2F3), all from eBioscience; CD4 (GK1.5), CD8α (53-6-7), CD11c (HL3), CTLA4 (UC10-4F10-11) all from BD Biosciences; CD45 (30-F11), Ly6C (HK1.4), IFNγ (XMG1.2) all from BioLegend; Nrp-1 (BAF566) from R&D. For immunohistochemistry, anti-CD3 (SP7) was purchased from Abcam.
Flow cytometry
Single cell suspensions were prepared from the indicated tissues as previously reported6. Data were acquired on LSR Fortessa or LSRII flow cytometers (BD Biosciences) and analyzed using FlowJo v9.3 (FlowJo) or software designed by the Division of Computer Research and Technology, NCI. Live cells were gated using forward scatter exclusion of dead cells stained with propidium iodide. For fixed cells, dead cells were excluded by Aqua Live/Dead (Invitrogen) staining and fixation and permeabilization were performed with IC fixation and permeabilization buffers (eBioscience). Cytokine expression was assessed on cells upon stimulated in vitro with PMA (25 ng/ml) and ionomycin (1 μM) for 4 hours as previously described53.
Cell isolation
Oral mucosa leukocytes were isolated by the staggered enzyme digestion method as previously described6. In brief, oral mucosal tissues including the epithelium and the LP were first dissected from the buccogingival, sublingual, palatal areas, and the tongue, followed by chopping and proteolytic enzyme digestion. Specifically, tissues were treated with Liberase DL (0.5 mg/ml) for 20 mins followed by Liberase TL (0.25 mg/ml) for another 20 mins at 37 °C under continuous rotation. Protease reaction was stopped by addition of EDTA (1 mM), and digested tissues were filtered through a 70 μm cell strainer (BD Biosciences). Collected cells were passed through a density gradient with 40% and 70% Percoll (GE Healthcare) for 25 min at 2,200 rpm with no brake. Lymphocytes accumulated at the interphase and cells were harvested, washed, and resuspended in cell culture media before further analysis. Small intestine intraepithelial leukocytes (SI IELs) were isolated as previously described57. For isolation of lung mononuclear cells (MNC) and small intestine lamina propria, harvested tissues were diced into pieces and treated with collagenase IV (1.0 mg/ml) for 1 hour at 37 °C followed by Percoll gradient centrifugation.
Immunohistochemistry
Immunohistochemical staining was performed on 5 μm-thick sections. Tissue sections were deparaffinized with xylene and dehydrated through a graded ethanol series. Heat-induced antigen retrieval was conducted for 20 min in a pH 6.0 citrate antigen retrieval buffer (Dako) using a pressure cooker. Endogenous peroxidase activity was quenched with 3% H2O2 for 10 min, and sections were incubated with protein block (Dako) for another 15 min. The sections were incubated with rabbit monoclonal anti-CD3 antibodies (SP7; dilution 1:100; Abcam) and rabbit monoclonal anti-FoxP3 antibodies (D608R; dilution 1:200; Cell Signaling) for 60 min at room temperature. Antigen-antibody reaction was detected using Envision+ System-HRP (Dako) and visualized with 3,3-diaminobenzadine (Dako). Tissue sections were lightly counterstained with hematoxylin and examined by light microscopy.
Ablation of Foxp3+ cells in Foxp3DTR mice
To deplete Foxp3+ cells in vivo, diphtheria toxin (DT, Sigma) 0.5 μg was i.p. injected into Foxp3DTR mice every other day for 14 days.
Adoptive transfer
Naïve CD4 T cells were isolated from LN and spleen of Foxp3-EGFP or Foxp3tm1Kuch reporter mice by electronically sorting (FACSAria, BD) for CD4 T cells that were negative for both CD25 and EGFP. 4 × 10⁶ naïve CD4 T cells were tail-vein injected into Rag2-deficient host mice (Rag2KO). 5–6 weeks after injection, donor cells were recovered from host oral mucosa and LN for analysis.
Quantitative real-time PCR
Total RNA was isolated from LN and oral mucosa of unmanipulated Rag2KO mice using TRIzol (ThermoFisher). RNA was reverse transcribed into cDNA by oligo(dT) priming with the QuantiTect Reverse transcription kit (Qiagen). Quantitative RT-PCR was performed with an ABI PRISM 7900HT Sequence Detection System and the QuantiTect SYBR Green detection system (Qiagen) with the following primers: tgfb1 (F: 5′-TGCGCTTGCAGAGATTAAAA-3′; R: 5′-AGCCCTGTATTCCGTCTCCT-3′), Rpl13 (F: 5′-CGAGGCATGCTGCCCCACAA-3′; R: 5′-AGCAGGGACCACCATCCGCT-3′). Gene expression values were normalized to those of Rpl13 in the same sample.
Statistical Analysis
Data are shown as mean ± SEM. Two-tailed Mann-Whitney U-test was used to calculate P-values, where *, P < 0.05; **, P<0.01; ***, P<0.001 were considered statistically significant. NS = not significant.
Supplementary Material
Acknowledgments
We thank Dr. A. Singer for critical review of this manuscript. This work was supported by the Intramural Research Program of the National Institutes of Health, National Cancer Institute, Center for Cancer Research.
Footnotes
Author Contributions
J-Y. P. designed the study, performed and analyzed experiments, prepared figures, and wrote the manuscript; H.C., D.T.D., and X.T. performed experiments and analyzed data; J-H.P. directed the study, analyzed data, and wrote the manuscript.
Competing interests
The authors declare no conflict of interest.
References
- 1.Wu RQ, Zhang DF, Tu E, Chen QM, Chen W. The mucosal immune system in the oral cavity-an orchestra of T cell diversity. Int J Oral Sci. 2014;6(3):125–132. doi: 10.1038/ijos.2014.48. [DOI] [PMC free article] [PubMed] [Google Scholar]
- 2.Ramsdell F, Ziegler SF. FOXP3 and scurfy: how it all began. Nat Rev Immunol. 2014;14(5):343–349. doi: 10.1038/nri3650. [DOI] [PubMed] [Google Scholar]
- 3.Moutsopoulos NM, Konkel JE. Tissue-Specific Immunity at the Oral Mucosal Barrier. Trends Immunol. 2017 doi: 10.1016/j.it.2017.08.005. [DOI] [PMC free article] [PubMed] [Google Scholar]
- 4.Pereira LMS, Gomes STM, Ishak R, Vallinoto ACR. Regulatory T Cell and Forkhead Box Protein 3 as Modulators of Immune Homeostasis. Front Immunol. 2017;8:605. doi: 10.3389/fimmu.2017.00605. [DOI] [PMC free article] [PubMed] [Google Scholar]
- 5.Pandiyan P, Bhaskaran N, Zhang Y, Weinberg A. Isolation of T cells from mouse oral tissues. Biol Proced Online. 2014;16(1):4. doi: 10.1186/1480-9222-16-4. [DOI] [PMC free article] [PubMed] [Google Scholar]
- 6.Park JY, Chung H, Choi Y, Park JH. Phenotype and Tissue Residency of Lymphocytes in the Murine Oral Mucosa. Front Immunol. 2017;8:250. doi: 10.3389/fimmu.2017.00250. [DOI] [PMC free article] [PubMed] [Google Scholar]
- 7.Hovav AH. Dendritic cells of the oral mucosa. Mucosal Immunol. 2014;7(1):27–37. doi: 10.1038/mi.2013.42. [DOI] [PubMed] [Google Scholar]
- 8.Nudel I, Elnekave M, Furmanov K, Arizon M, Clausen BE, Wilensky A, et al. Dendritic cells in distinct oral mucosal tissues engage different mechanisms to prime CD8+ T cells. J Immunol. 2011;186(2):891–900. doi: 10.4049/jimmunol.1002943. [DOI] [PubMed] [Google Scholar]
- 9.Burzyn D, Benoist C, Mathis D. Regulatory T cells in nonlymphoid tissues. Nat Immunol. 2013;14(10):1007–1013. doi: 10.1038/ni.2683. [DOI] [PMC free article] [PubMed] [Google Scholar]
- 10.Pesenacker AM, Broady R, Levings MK. Control of tissue-localized immune responses by human regulatory T cells. Eur J Immunol. 2015;45(2):333–343. doi: 10.1002/eji.201344205. [DOI] [PubMed] [Google Scholar]
- 11.Sather BD, Treuting P, Perdue N, Miazgowicz M, Fontenot JD, Rudensky AY, et al. Altering the distribution of Foxp3(+) regulatory T cells results in tissue-specific inflammatory disease. J Exp Med. 2007;204(6):1335–1347. doi: 10.1084/jem.20070081. [DOI] [PMC free article] [PubMed] [Google Scholar]
- 12.Shevach EM. Mechanisms of foxp3+ T regulatory cell-mediated suppression. Immunity. 2009;30(5):636–645. doi: 10.1016/j.immuni.2009.04.010. [DOI] [PubMed] [Google Scholar]
- 13.Allam JP, Duan Y, Winter J, Stojanovski G, Fronhoffs F, Wenghoefer M, et al. Tolerogenic T cells, Th1/Th17 cytokines and TLR2/TLR4 expressing dendritic cells predominate the microenvironment within distinct oral mucosal sites. Allergy. 2011;66(4):532–539. doi: 10.1111/j.1398-9995.2010.02510.x. [DOI] [PubMed] [Google Scholar]
- 14.Okui T, Ito H, Honda T, Amanuma R, Yoshie H, Yamazaki K. Characterization of CD4+ FOXP3+ T-cell clones established from chronic inflammatory lesions. Oral Microbiol Immunol. 2008;23(1):49–54. doi: 10.1111/j.1399-302X.2007.00390.x. [DOI] [PubMed] [Google Scholar]
- 15.Scadding GW, Shamji MH, Jacobson MR, Lee DI, Wilson D, Lima MT, et al. Sublingual grass pollen immunotherapy is associated with increases in sublingual Foxp3-expressing cells and elevated allergen-specific immunoglobulin G4, immunoglobulin A and serum inhibitory activity for immunoglobulin E-facilitated allergen binding to B cells. Clin Exp Allergy. 2010;40(4):598–606. doi: 10.1111/j.1365-2222.2010.03462.x. [DOI] [PubMed] [Google Scholar]
- 16.Agace WW, Higgins JM, Sadasivan B, Brenner MB, Parker CM. T-lymphocyte-epithelial-cell interactions: integrin alpha(E)(CD103)beta(7), LEEP-CAM and chemokines. Curr Opin Cell Biol. 2000;12(5):563–568. doi: 10.1016/s0955-0674(00)00132-0. [DOI] [PubMed] [Google Scholar]
- 17.Li MO, Rudensky AY. T cell receptor signalling in the control of regulatory T cell differentiation and function. Nat Rev Immunol. 2016;16(4):220–233. doi: 10.1038/nri.2016.26. [DOI] [PMC free article] [PubMed] [Google Scholar]
- 18.Sarris M, Andersen KG, Randow F, Mayr L, Betz AG. Neuropilin-1 expression on regulatory T cells enhances their interactions with dendritic cells during antigen recognition. Immunity. 2008;28(3):402–413. doi: 10.1016/j.immuni.2008.01.012. [DOI] [PMC free article] [PubMed] [Google Scholar]
- 19.Szurek E, Cebula A, Wojciech L, Pietrzak M, Rempala G, Kisielow P, et al. Differences in Expression Level of Helios and Neuropilin-1 Do Not Distinguish Thymus-Derived from Extrathymically-Induced CD4+Foxp3+ Regulatory T Cells. PLoS One. 2015;10(10):e0141161. doi: 10.1371/journal.pone.0141161. [DOI] [PMC free article] [PubMed] [Google Scholar]
- 20.Weiss JM, Bilate AM, Gobert M, Ding Y, Curotto de Lafaille MA, Parkhurst CN, et al. Neuropilin 1 is expressed on thymus-derived natural regulatory T cells, but not mucosa-generated induced Foxp3+ T reg cells. J Exp Med. 2012;209(10):1723–1742, S1721. doi: 10.1084/jem.20120914. [DOI] [PMC free article] [PubMed] [Google Scholar]
- 21.Yadav M, Louvet C, Davini D, Gardner JM, Martinez-Llordella M, Bailey-Bucktrout S, et al. Neuropilin-1 distinguishes natural and inducible regulatory T cells among regulatory T cell subsets in vivo. J Exp Med. 2012;209(10):1713–1722. S1711–1719. doi: 10.1084/jem.20120822. [DOI] [PMC free article] [PubMed] [Google Scholar]
- 22.Ju ST, Sharma R, Gaskin F, Kung JT, Fu SM. The Biology of Autoimmune Response in the Scurfy Mice that Lack the CD4+Foxp3+ Regulatory T-Cells. Biology (Basel) 2012;1(1):18–42. doi: 10.3390/biology1010018. [DOI] [PMC free article] [PubMed] [Google Scholar]
- 23.Lehtimaki S, Lahesmaa R. Regulatory T Cells Control Immune Responses through Their Non-Redundant Tissue Specific Features. Front Immunol. 2013;4:294. doi: 10.3389/fimmu.2013.00294. [DOI] [PMC free article] [PubMed] [Google Scholar]
- 24.Auffray C, Fogg D, Garfa M, Elain G, Join-Lambert O, Kayal S, et al. Monitoring of blood vessels and tissues by a population of monocytes with patrolling behavior. Science. 2007;317(5838):666–670. doi: 10.1126/science.1142883. [DOI] [PubMed] [Google Scholar]
- 25.Rose S, Misharin A, Perlman H. A novel Ly6C/Ly6G-based strategy to analyze the mouse splenic myeloid compartment. Cytometry A. 2012;81(4):343–350. doi: 10.1002/cyto.a.22012. [DOI] [PMC free article] [PubMed] [Google Scholar]
- 26.Kim JM, Rasmussen JP, Rudensky AY. Regulatory T cells prevent catastrophic autoimmunity throughout the lifespan of mice. Nat Immunol. 2007;8(2):191–197. doi: 10.1038/ni1428. [DOI] [PubMed] [Google Scholar]
- 27.Pure E, Cuff CA. A crucial role for CD44 in inflammation. Trends Mol Med. 2001;7(5):213–221. doi: 10.1016/s1471-4914(01)01963-3. [DOI] [PubMed] [Google Scholar]
- 28.Seo SU, Kwon HJ, Ko HJ, Byun YH, Seong BL, Uematsu S, et al. Type I interferon signaling regulates Ly6C(hi) monocytes and neutrophils during acute viral pneumonia in mice. PLoS Pathog. 2011;7(2):e1001304. doi: 10.1371/journal.ppat.1001304. [DOI] [PMC free article] [PubMed] [Google Scholar]
- 29.Mackay LK, Braun A, Macleod BL, Collins N, Tebartz C, Bedoui S, et al. Cutting edge: CD69 interference with sphingosine-1 phosphate receptor function regulates peripheral T cell retention. J Immunol. 2015;194(5):2059–2063. doi: 10.4049/jimmunol.1402256. [DOI] [PubMed] [Google Scholar]
- 30.Vent-Schmidt J, Han JM, MacDonald KG, Levings MK. The role of FOXP3 in regulating immune responses. Int Rev Immunol. 2014;33(2):110–128. doi: 10.3109/08830185.2013.811657. [DOI] [PubMed] [Google Scholar]
- 31.Bettelli E, Carrier Y, Gao W, Korn T, Strom TB, Oukka M, et al. Reciprocal developmental pathways for the generation of pathogenic effector TH17 and regulatory T cells. Nature. 2006;441(7090):235–238. doi: 10.1038/nature04753. [DOI] [PubMed] [Google Scholar]
- 32.Abbas AK, Benoist C, Bluestone JA, Campbell DJ, Ghosh S, Hori S, et al. Regulatory T cells: recommendations to simplify the nomenclature. Nat Immunol. 2013;14(4):307–308. doi: 10.1038/ni.2554. [DOI] [PubMed] [Google Scholar]
- 33.Shevach EM, Thornton AM. tTregs, pTregs, and iTregs: similarities and differences. Immunol Rev. 2014;259(1):88–102. doi: 10.1111/imr.12160. [DOI] [PMC free article] [PubMed] [Google Scholar]
- 34.Haribhai D, Lin W, Edwards B, Ziegelbauer J, Salzman NH, Carlson MR, et al. A central role for induced regulatory T cells in tolerance induction in experimental colitis. J Immunol. 2009;182(6):3461–3468. doi: 10.4049/jimmunol.0802535. [DOI] [PMC free article] [PubMed] [Google Scholar]
- 35.Schmitt EG, Williams CB. Generation and function of induced regulatory T cells. Front Immunol. 2013;4:152. doi: 10.3389/fimmu.2013.00152. [DOI] [PMC free article] [PubMed] [Google Scholar]
- 36.Yadav M, Stephan S, Bluestone JA. Peripherally induced tregs-role in immune homeostasis and autoimmunity. Front Immunol. 2013;4:232. doi: 10.3389/fimmu.2013.00232. [DOI] [PMC free article] [PubMed] [Google Scholar]
- 37.Thornton AM, Korty PE, Tran DQ, Wohlfert EA, Murray PE, Belkaid Y, et al. Expression of Helios, an Ikaros transcription factor family member, differentiates thymic-derived from peripherally induced Foxp3+ T regulatory cells. J Immunol. 2010;184(7):3433–3441. doi: 10.4049/jimmunol.0904028. [DOI] [PMC free article] [PubMed] [Google Scholar]
- 38.Gebhardt T, Mackay LK. Local immunity by tissue-resident CD8(+) memory T cells. Front Immunol. 2012;3:340. doi: 10.3389/fimmu.2012.00340. [DOI] [PMC free article] [PubMed] [Google Scholar]
- 39.Grueter B, Petter M, Egawa T, Laule-Kilian K, Aldrian CJ, Wuerch A, et al. Runx3 regulates integrin alpha E/CD103 and CD4 expression during development of CD4−/CD8+ T cells. J Immunol. 2005;175(3):1694–1705. doi: 10.4049/jimmunol.175.3.1694. [DOI] [PubMed] [Google Scholar]
- 40.Lehmann J, Huehn J, de la Rosa M, Maszyna F, Kretschmer U, Krenn V, et al. Expression of the integrin alpha Ebeta 7 identifies unique subsets of CD25+ as well as CD25− regulatory T cells. Proc Natl Acad Sci U S A. 2002;99(20):13031–13036. doi: 10.1073/pnas.192162899. [DOI] [PMC free article] [PubMed] [Google Scholar]
- 41.Banz A, Peixoto A, Pontoux C, Cordier C, Rocha B, Papiernik M. A unique subpopulation of CD4+ regulatory T cells controls wasting disease, IL-10 secretion and T cell homeostasis. Eur J Immunol. 2003;33(9):2419–2428. doi: 10.1002/eji.200324205. [DOI] [PubMed] [Google Scholar]
- 42.Siegmund K, Feuerer M, Siewert C, Ghani S, Haubold U, Dankof A, et al. Migration matters: regulatory T-cell compartmentalization determines suppressive activity in vivo. Blood. 2005;106(9):3097–3104. doi: 10.1182/blood-2005-05-1864. [DOI] [PMC free article] [PubMed] [Google Scholar]
- 43.Suffia I, Reckling SK, Salay G, Belkaid Y. A role for CD103 in the retention of CD4+CD25+ Treg and control of Leishmania major infection. J Immunol. 2005;174(9):5444–5455. doi: 10.4049/jimmunol.174.9.5444. [DOI] [PubMed] [Google Scholar]
- 44.Zhao D, Zhang C, Yi T, Lin CL, Todorov I, Kandeel F, et al. In vivo-activated CD103+CD4+ regulatory T cells ameliorate ongoing chronic graft-versus-host disease. Blood. 2008;112(5):2129–2138. doi: 10.1182/blood-2008-02-140277. [DOI] [PMC free article] [PubMed] [Google Scholar]
- 45.Annacker O, Coombes JL, Malmstrom V, Uhlig HH, Bourne T, Johansson-Lindbom B, et al. Essential role for CD103 in the T cell-mediated regulation of experimental colitis. J Exp Med. 2005;202(8):1051–1061. doi: 10.1084/jem.20040662. [DOI] [PMC free article] [PubMed] [Google Scholar]
- 46.Allam JP, Stojanovski G, Friedrichs N, Peng W, Bieber T, Wenzel J, et al. Distribution of Langerhans cells and mast cells within the human oral mucosa: new application sites of allergens in sublingual immunotherapy? Allergy. 2008;63(6):720–727. doi: 10.1111/j.1398-9995.2007.01611.x. [DOI] [PubMed] [Google Scholar]
- 47.Novak N, Haberstok J, Bieber T, Allam JP. The immune privilege of the oral mucosa. Trends Mol Med. 2008;14(5):191–198. doi: 10.1016/j.molmed.2008.03.001. [DOI] [PubMed] [Google Scholar]
- 48.Yang J, Zhang L, Yu C, Yang XF, Wang H. Monocyte and macrophage differentiation: circulation inflammatory monocyte as biomarker for inflammatory diseases. Biomark Res. 2014;2(1):1. doi: 10.1186/2050-7771-2-1. [DOI] [PMC free article] [PubMed] [Google Scholar]
- 49.Cassone A, Cauda R. Candida and candidiasis in HIV-infected patients: where commensalism, opportunistic behavior and frank pathogenicity lose their borders. AIDS. 2012;26(12):1457–1472. doi: 10.1097/QAD.0b013e3283536ba8. [DOI] [PubMed] [Google Scholar]
- 50.Conti HR, Shen F, Nayyar N, Stocum E, Sun JN, Lindemann MJ, et al. Th17 cells and IL-17 receptor signaling are essential for mucosal host defense against oral candidiasis. J Exp Med. 2009;206(2):299–311. doi: 10.1084/jem.20081463. [DOI] [PMC free article] [PubMed] [Google Scholar]
- 51.Chen Y, Haines CJ, Gutcher I, Hochweller K, Blumenschein WM, McClanahan T, et al. Foxp3(+) regulatory T cells promote T helper 17 cell development in vivo through regulation of interleukin-2. Immunity. 2011;34(3):409–421. doi: 10.1016/j.immuni.2011.02.011. [DOI] [PubMed] [Google Scholar]
- 52.Pandiyan P, Conti HR, Zheng L, Peterson AC, Mathern DR, Hernandez-Santos N, et al. CD4(+)CD25(+)Foxp3(+) regulatory T cells promote Th17 cells in vitro and enhance host resistance in mouse Candida albicans Th17 cell infection model. Immunity. 2011;34(3):422–434. doi: 10.1016/j.immuni.2011.03.002. [DOI] [PMC free article] [PubMed] [Google Scholar]
- 53.Hong C, Luckey MA, Ligons DL, Waickman AT, Park JY, Kim GY, et al. Activated T cells secrete an alternatively spliced form of common gamma-chain that inhibits cytokine signaling and exacerbates inflammation. Immunity. 2014;40(6):910–923. doi: 10.1016/j.immuni.2014.04.020. [DOI] [PMC free article] [PubMed] [Google Scholar]
- 54.Kim GY, Ligons DL, Hong C, Luckey MA, Keller HR, Tai X, et al. An in vivo IL-7 requirement for peripheral Foxp3+ regulatory T cell homeostasis. J Immunol. 2012;188(12):5859–5866. doi: 10.4049/jimmunol.1102328. [DOI] [PMC free article] [PubMed] [Google Scholar]
- 55.Laurence A, Tato CM, Davidson TS, Kanno Y, Chen Z, Yao Z, et al. Interleukin-2 signaling via STAT5 constrains T helper 17 cell generation. Immunity. 2007;26(3):371–381. doi: 10.1016/j.immuni.2007.02.009. [DOI] [PubMed] [Google Scholar]
- 56.Xu L, Kitani A, Fuss I, Strober W. Cutting edge: regulatory T cells induce CD4+CD25-Foxp3-T cells or are self-induced to become Th17 cells in the absence of exogenous TGF-beta. J Immunol. 2007;178(11):6725–6729. doi: 10.4049/jimmunol.178.11.6725. [DOI] [PubMed] [Google Scholar]
- 57.Goodyear AW, Kumar A, Dow S, Ryan EP. Optimization of murine small intestine leukocyte isolation for global immune phenotype analysis. J Immunol Methods. 2014;405:97–108. doi: 10.1016/j.jim.2014.01.014. [DOI] [PubMed] [Google Scholar]
Associated Data
This section collects any data citations, data availability statements, or supplementary materials included in this article.