Abstract
Homocysteine (Hcy) causes endothelial dysfunction by inducing oxidative stress in most neurodegenerative disorders. This dysfunction is highly correlated with mitochondrial dynamics such as fusion and fission. However, there are no strategies to prevent Hcy induced mitochondrial remodeling. Tetrahydrocurcumin (THC) is an anti-inflammatory and anti-oxidant compound. We hypothesized that THC may ameliorates Hcy induced mitochondria remodeling in mouse brain endothelial cells (bEnd3) cells. bEnd3 cells were exposed to Hcy treatment in the presence or absence of THC. Cell viability and autophagic cell death were measured with MTT and MDC staining assay. Reactive oxygen species (ROS) production was determined using DCFH-DA staining by confocal microscopy. Autophagy flux was assessed using a conventional GFP-microtubule-associated protein 1 light chain 3 (LC3) dot assay. Interaction of phagophore marker LC-3 with mitochondrial receptor NIX was observed by confocal imaging. Mitochondrial fusion and fission were evaluated by western blot and RT-PCR. Our results demonstrated that Hcy resulted in cell toxicity in a dose-dependent manner and supplementation of THC prevented the detrimental effects of Hcy on cell survival. Furthermore, Hcy also upregulated of fission marker (DRP-1), fusion markers (Mfn2) and autophagy marker (LC-3). Finally, we observed that Hcy activated mitochondrial specific phagophore marker (LC-3) was co-localized with the mitochondrial receptor NIX, as viewed by confocal microscopy. Pretreatment of bEnd3 with THC (15μM) ameliorated Hcy induced oxidative damage, mitochondrial fission/fusion, and mitophagy. Our studies strongly suggest that THC has beneficial effects on mitochondrial remodeling and could be developed as a potential therapeutic agent against hyperhomocysteinemia (HHcy) induced mitochondrial dysfunction.
Keywords: Curcumin, Apoptosis, Autophagy, Reactive oxygen species, Mitochondria biogenesis
Introduction
One of the major contributing risk factors for most of the neurological disorders is an elevated level of homocysteine (Hcy) also known as hyperhomocysteinemia (HHcy). HHcy receives its reputation as a risk factor for neurodegenerative disorder because as thiol (–SH) group of Hcy is readily oxidized and generated reactive oxygen species (ROS) that further leads to oxidative stress (Ansari et al., 2014, Kamat et al., 2015). These neurodegenerative diseases are featured by mitochondrial dysfunction and cell death in selected areas in the nervous system (Veeranki et al., 2013, Moustafa et al., 2014). Mitochondria are essential for neuronal survival and function, their dysfunction is key factor in several neurological diseases. Mitochondria are morphologically dynamic organelles and play various roles such as metabolite synthesis, apoptosis, as well as energy generation in cell survival and death (Osellame et al., 2012). Mitochondrial dynamics are maintained by two opposing processes: fission and fusion (Benard et al., 2009, Givvimani et al., 2012, Marin-Garcia et al., 2013), which regulate their structure and function. In mammalian cells, mitochondrial fission is mediated by large GTPase dynamin-related protein (DRP1) acting in concert with outer mitochondrial membrane (OMM) proteins such as mitochondrial fission 1 protein (FIS1), mitochondrial fission factor (MFF) and mitochondrial elongation factor 1 (MIEF1). Mitochondrial fusion depends on the action of three large GTPase: mitofusins 1, 2 (MFN1, MFN2), mediate membrane fusion on the OMM level, and optic atrophy protein 1 (OPA1), important for inner mitochondrial membrane fusion (Frank et al., 2012, Ranieri et al., 2013). Mutation in Drp1, Mfn2 and Opa1 has been linked to neurodegenerative conditions (Frank et al., 2012). On the other hand, fission markers include DRP1 and the mitochondrial receptor NIX (Ding et al., 2012). Therefore, NIX serves as the marker for differential phagocytosis of mitochondria. It could also be asserted as a marker for mitochondrial fission. Mitochondrial dynamics is strictly controlled by the cell because of its vital role in maintaining mitochondrial functions (Suen et al., 2008, Westermann et al., 2010, Westermann et al., 2010, Galluzzi et al., 2012, Zhao et al., 2013,). In endothelial cells, several intracellular and extracellular signals such as oxidative stress, mitochondrial membrane potential, mitochondrial DNA damage, and cell death modulate the mitochondrial fission and fusion events (Davidson et al., 2007, Dranka et al., 2010, Kluge et al., 2013). Furthermore, the disruption of the dynamic balance is associated with neurological disorder, diabetes, aging, and cancer (Sato et al., 2006, Grandemange et al., 2009, Shenouda et al., 2011).
Mitochondrial dynamics not only impacts intrinsic apoptosis but also redirect autophagic degradation. Autophagy is responsible for the degradation of long-lived proteins, protein aggregates, and cytoplasmic organelles through the lysosomal-dependent processes (Eskelinen et al., 2009) while mitophagy is a selective degradation of mitochondria through autophagy (kubli et al., 2012, Zhang et al., 2013). Mitophagy controls mitochondria quality by removing unhealthy or damaged mitochondria. Recent evidence indicated that mitophagy depends on mitochondrial dynamics (Twig et al., 2011). The depolarized mitochondria, which produced by fission process, are easily targeted to mitophagy (Park et al., 2012). Thus, mitochondrial dynamics and mitophagy are thought to be important systems for the quality control of mitochondria and mitochondria-associated diseases and it is important to review mitochondrial remodeling. However, the precise working mechanisms are largely unknown.
Proper degradation of aged and damaged mitochondria through mitophagy is a key cellular pathway for mitochondrial quality control (Cui et al., 2012). These proteins play a crucial role in mediating mitophagy, primarily in their role in maintaining healthy mitochondria (Kubli et al., 2012). To better understand the correlation of fission events with mitophagy, it is helpful to look at the very common autophagic marker microtubule associated protein light chain 3 (LC3) (Nishida et al., 2008). LC3 is expressed at a basal level, however, when autophagy is induced, LC3 is proteolytically cleaved to LC3II (Barth et al., 2010). LC3II then localizes with the de novo formation of the phagophore to stabilize its synthesis (Fujita et al., 2008). Further LC3II binds with NIX and the mitochondria containing the receptor are targeted for sequestration. It is important to mention that the enzyme that cleaves LC3I is activated by intracellular ROS (Scherz-Shouval et al., 2007), thereby relating ROS to mitochondrial fission, and thus mitophagy.
Natural antioxidants as potential nutraceuticals antioxidant have been studied to reduce severe side effects as well as enhance anticancer activities of antitumor drugs. Curcumin (diferuloylmethane) has been identified as the major pigment in turmeric, which is commonly used as a spice, additive, and food colorant (Gonzalez-Reyes et al., 2013). Curcumin/Tetrahydrocurcumin (THC) exhibits a wide range of pharmacological activities, including anti-oxidant, anti-toxic, anti-inflammatory and having potentially chemotherapeutic properties (Anand et al., 2008, Tyagi et al., 2012). The use of THC has been reported as a therapeutic agent to mitigate various kinds of toxicity including cardiotoxicity (Swamy et al., 2012), nephrotoxicity (Ueki et al., 2013), hepatotoxicity (Dattani et al., 2010) and neurotoxicity (Sharma et al., 2014). Treatment with THC was found to modulate mitochondrial dysfunction and its property as an antioxidant is widely thought to be responsible for its protective effects in mitochondria (Zhu et al., 2004). However, the effect of THC on various aspects of HHcy related to mitochondria dysfunction has not been investigated. Therefore, in the present study, we tested the hypothesis that increased level of homocysteine impairs the balance of mitochondrial fission and fusion in mouse brain endothelial cells that resulted in mitochondria remodeling. Alongside, the protective effect of THC was explored on Hcy-mediated modulation of mitochondria dynamics.
Material and methods
Materials
DL-Homocysteine (Hcy), Tetrahydrocurcumin (THC), 3-[4,5-dimethylthiazol-2-yl]-2,5-diphenyltetrazolium bromide (MTT) and monodansylcadaverine (MDC), bafilomycin A1, uric acid were purchased from Sigma Aldrich (St. Louis, MO). Hydrogen peroxide (H2O2), dimethyl sulfoxide (DMSO), and Tween-20 were obtained from Fischer Scientific (Fair Lawn, New Jersey). Dulbecco’s modified Eagle’s medium (DMEM), fetal bovine serum (FBS), penicillin, and streptomycin were purchased from American Type Culture Collection, Manassas, VA. Antibodies against LC-3, MFN2, DRP-1 were purchased from Abcam (Cambridge, MA, USA). Polyclonal antibody to NIX and Horseradish peroxidase (HRP)-conjugated antibody was purchased from Santa Cruz Biotechnology (Santa Cruz, CA). 4’, 6-diamidino-2-phenylindole (DAPI) and 2’, 7’-dichlorodihydrofluoresceindiacetate (H2DCF-DA) were obtained from Invitrogen (Carlsbad, CA). Caspase-Glo® 3/7 Assay, Mitochondrial ToxGlo™ assay, ROS-Glo™ H2O2 Assay, The DeadEnd™ Fluorometric TUNEL System (Promega, Madison, WI, USA).
Methods
Cell Culture
Mouse brain endothelial cells (bEND3; American Type Culture Collection, Manassas, VA) were grown in 75-cm2 flasks in DMEM enhanced with 0.45% glucose, 0.37% NaHCO3, 4mM glutamine, 10% FBS, 100 μg/ml penicillin, and 100 μg/ml streptomycin. This complete media had pH 7.4. The cells were grown in a humidified incubator maintained at 37°C with 5% CO2. Cells between 6 to 7th passages were used in the whole study. bEnd3 cells were grown to confluence, trypsinized and suspended in complete media. The cells were then pelleted at 500 x g for 5 min. Once the pellet was formed, the bEnd3 were re-suspended in complete media and seeded into chambered plates for experimentation.
Treatment Model
The experimental groups were as following: Control (CT), Hcy (500 μM), THC (15 μM), Hcy (500 μM) + THC (15 μM), H2O2 (100 μM), uric acid (50 μM), 3-MA (5 mM), Bafilomycin A1 (20 nM). The H2O2 served as a positive control group for the study. THC is a nonpolar molecule that had to be dissolved in the solvent DMSO. However, DMSO is toxic to cells. So in order to nullify its effect on the treatment group, an equal volume was supplied to both control groups, as well as the Hcy group. To reach the proper concentrations, stock solutions of the following were utilized: 10mM Hcy, 100mM THC, 100mM DMSO, 10mM H2O2 and then serial diluted to the desired amount. bEnd3 cells were grown to 80% confluence and then treatment was given. Treatments were given in DMEM/F12 (serum free media with F12 nutrient mixture) and cells were kept for 24 hrs in the same atmosphere as they were raised.
Cell Viability Assay
Cell viability was determined by MTT assay as originally described by (Mosmann et al., 1983). In brief, bEnd3 cells were plated on a 96 well plate at a density of 105 cells/well and incubated with different concentration of Cu (0–100μM) and Cu (15μm)+ different concentration of Hcy (0–500μM) in serum-free DMEM/F12 at 37 °C for 24 hrs. Then the media was aspirated and MTT treatment was given by diluting 1.1 ml of MTT reagent (5mg/ml) in 9.9 ml of DMEM/F12 and distributing 100 μl to each well. The cells were then incubated for 4 hrs at 37°C. The medium was removed and wells were rinsed twice with PBS. After that, 100 μl of DMSO was added to each well to dissolve the cell membrane and bring formazan into the solution. The amount of formazan was then measured by collecting absorbance values at 570 nm by spectramax3000 spectrophotometer (Molecular Devices, Sunnyvale, CA).
Measurement of Mitochondrial ATP Level
Mitochondrial ToxGlo™ assay was performed to estimate Mitochondrial ATP level as per the manufacture’s protocol and previous literature (Jeong et al., 2014). Briefly, bEnd3 cells were plated 2 × 10⁶ cells in 12-well culture plate. After 24 hrs of given treatment, cells were harvested and resuspended by pipetting until the cells were evenly dispersed. Re-suspended bEND3 cells were plated 2 × 10⁴ cells/well in 96-well culture plate. Plates were centrifuged at 200× g for 7 min to remove medium and after it 100 μL of fresh medium lacking glucose and supplemented with 10 mM galactose. The plate incubated at 37 °C in a humidified and CO2-supplemented incubator for 90 min. Assay solution (100 μL) was added to the plate, and then the plate was incubated at 37°C for 30 min. Luminescence was measured using a luminometer (Molecular Device, Sunnyvale, CA, USA).
Flow Cytometry with MitoSOX
To determine the intracellular production of ROS in each treatment group, bEnd3 cells were seeded in a 6-well plate, grown to the appropriate confluence, and given treatment for 24 hrs. Thereafter, the cells were washed with PBS and loaded with the H2DCF-DA probe at a concentration of 20 μM, diluted in PBS. The cells were then incubated for 2 hrs at 37°C. After the incubation period was concluded, the cells were washed thrice with PBS, trypsinized and pelleted at 500 x g for 5 min. The cells were re-suspended in 1 ml of PBS and fluorescent intensity was detected in 1×10⁴ cells at 488 nm using an Accuri Flow Cytometer (Accuri Flow Cytometers, Michigan, Ann Arbor). Analysis of the data was determined through the software provided by the manufacturer. This membrane permeable probe enters the cell and is acted by esterase, which hydrolyze the acetate groups off and allow the molecule to bind to ROS and fluoresce green.
Similarly, for the determination of mitochondrial superoxide by flow cytometry (Mukhopadhyay et al., 2007), the measurements were carried out using an Accuri Flow Cytometer. The data presented by histogram of mean intensity of MitoSOX fluorescence or fold change when compared with control with MitoSOX present and treatment group.
ROS Measurement from bEND3 cells by Luminescence
For ROS measurement the bEnd3 cells were treated with THC or Hcy for 24 hrs. ROS were detected using non-lytic ROS-Glo™ H2O2 Assay (Promega, Madison, WI, USA) according to the manufacturer’s instructions.
Detection of apoptosis by TUNEL assay
The TUNEL assay was performed according to the manufacturer’s protocol (Promega, Madison, WI, USA) and previous literature (Sipkens et al., 2013). Briefly, bEnd3 cells were permeabilized with 0.25% Triton X-100 in 1x PBS for 10 min on at 4 °C, then washed twice with 1x PBS, and incubated with the TUNEL incubation buffer for 60 min at 37°C in a humid chamber in the dark. To terminate the reactions, the cells were then treated with 2X SSC buffer and washed twice with PBS for 5 min. Then samples were analyzed by confocal microscopy.
MDC staining
To analyze the level of autophagy occurring in the test groups, bEnd3 cells were seeded in an 8-well chamber and given treatment according to our model. After 24 hrs of treatment, the media was aspirated and cells were stained with MDC at a concentration of 50 μM in PBS for 30 min. Afterwards, the cells were washed with PBS and examined using a confocal microscope (Olympus FV1000) at 525 nm wavelength emission. Using Fluoview software provided by the manufacturer, we gave virtual color to the images to view the autophagic vacuoles as blue. The number of vacuoles formed was analyzed by Image Pro Plus software (Media Cybernetics, Bethesda, MD) by measuring the fluorescent intensity/density. These vacuoles could be labeled with MDC as it is a basic molecule with lipid affinity and localize towards acidic auto lysosomes by ion-trapping mechanism.
Assessment of autophagic cell death
LC3 cDNA was a kind gift from Dr. Tamotsu Yoshimori (Osaka University) and Dr. Noboru Mizushima (Tokyo Medical and Dental University) (Fujita et al., 2008, Kabeya et al., 2000). GFP-LC3 fusion protein was used to visualize the autophagosomes in the cells. The cells were seeded in 6-cm2 dishes. After overnight culture, cells were transfected with 5 μg GFP-LC3 expressing plasmid using jet PEI (Poly plus transfection, 101–10) and incubated for 24 hrs. The medium was removed and fresh medium containing various concentrations of NVP-BEZ235 was added to the dishes. The cells were treated continuously with NVP-BEZ235 for 48 hrs. At the end of the treatment period, GFP-LC3 dots in the cells were investigated under confocal microscope.
Immunofluorescent staining
Mitophagy was analyzed by seeding cells in an 8-well chamber and giving treatment according to the model. After 24 hrs the cells were washed 2x with PBS and fixed with 3.7% paraformaldehyde (diluted in PBS) at 4°C for 15 min to preserve intracellular components. The cells were then washed with PBS before being permeabilized with 0.02% Tween-20 (prepared in PBS) for 10 min at room temperature. The cells were incubated in a blocking solution (1% FBS and 0.1% Tween-20 diluted in PBS) for 30 min in the humidified incubator at 37°C. The samples were then incubated with the primary antibodies NIX and LC3 (1:200) diluted in blocking solution, as well as DAPI, each for 1 hrs at room temperature. The cells were washed thrice with PBS and then incubated with anti-mouse FITC-conjugated, or anti-rabbit IgG (Texas Red ®) secondary antibodies (Invitrogen) diluted (1:500) in blocking solution. The cells were finally washed thrice with PBS and viewed under confocal microscope (Olympus FV1000) at 488 nm excitation, 516 nm emission for FITC-conjugated secondary antibody and 594 nm excitation, 625 nm emission for Texas Red. The two images were merged and the co-localization of the two probes produced a yellow colored overlap. The fluorescent intensity/density values of the yellow color were measured with Image Pro Plus software (Media Cybernetics, Bethesda, MD).
Reverse Transcription-Polymerase Chain Reaction
Mitochondrial dynamic events were measured by mRNA expression for the fusion and fission events. bEnd3 cells were seeded in two 6-well plates and treatment was given in duplicates. After 24 hrs, RNA was harvested using Trizol Reagent (Gibco BRL) according to the manufacturer’s instructions. The quality of RNA was measured by using the NanoDrop 1000 spectrophotometer and only high quality RNA was used (260/280 >2, 260/230>2) for experiments. RT-PCR was performed by using ImProm-II™ Reverse Transcription kit (Promega Corporation, Madison, WI). Complimentary DNA (cDNA) was prepared using 2 μg of the RNA. A reverse transcription program on the DNA Engine Peltier Thermal Cycler (Bio-Rad Laboratories, Hercules, CA) was used to make the cDNA. The program consisted of a denaturing cycle at 70°C for 6 min and then a reverse transcription cycle at 25°C for 2 min, 42°C for 50 min, 75°C for 5 min. Then 2 μl of cDNA (incubated with gene primers and nuclease-free water for a final volume of 20 μl) from each sample was used for a gene amplification cycle at 95°C for 7 min [95°C for 50 seconds, 55°C for 1 min, 72°C for 1 min] (x34), 72°C for 5 min. The primers used from Invitrogen (Carlsbad, CA) are listed in Table 1. The amplified products were run on 0.8% agarose gel (prepared in TAE buffer) and quantification was done using Image Lab software (Bio-Rad Laboratories, Hercules, CA). The amplified products of the tested genes were normalized with respective GAPDH.
Table 1.
Primers used for RT-PCR analysis.
| Gene | Primer Sequence |
|---|---|
| Mouse LC3 | 5′-TTGACTCAGAAGCCGAAGGT-3′ 5′-CATGAGCGAGTTGGTCAAGA-3′ |
| Mouse Mfn2 | 5′-GCAGAACTTTGTCCCAGAGC-3′ 5′-GCCAGCTTCCTTGAAGACAC-3′ |
| Mouse Drp1 | 5′-GCAGAACTTTGTCCCAGAGC-3′ 5′-ACCCGGAGACCTCTCATTCT-3′ |
| Mouse GAPDH | 5′-TGGCAAAGTGGAGATTGTTGCC-3′ 5′-AAGATGGTGATGGGCTTCCCG-3′ |
Western blotting
Variations in the protein content of Mfn-2, DRP-1, and LC3 were assessed by western blotting analyses according to the method described earlier (Zhao et al., 2013). Briefly, cells were washed twice with ice-cold PBS and lysed with ice-cold RIPA buffer [containing 5 mM of ethylenediamine-tetraacetic acid, phenylmethylsulfonyl fluoride (1 mM) and protease inhibitor cocktail (1 μl/ml of lysis buffer)]. Protein content of the lysate was determined using the Bicinchronic Acid protein assay kit (Pierce, Rockford, IL). Equal amounts of protein (50 μg) were resolved on SDS-PAGE and transferred onto a polyvinylidene difluoride membrane as described (Kalani et al., 2014). The blots were analyzed with Gel-Pro Analyzer software (Media Cybernetics, Silver Spring, MD) according to manufacturer instructions. The protein expression intensity was assessed by the integrated optical density (IOD) of the area of the band in the lane profile. To account for possible differences in the protein load, the measurements presented are the IOD of each band under study (protein of interest) divided by the IOD of the respective of GAPDH band.
Statistical analysis
Results were expressed as means ± SEM from at least 4 independent experiments. Both paired and unpaired Student’s t tests were used, where appropriate, for comparing the mean values between control and tested groups. Statistical significance was considered at P < 0.05. The arbitrary densitometry units (AU) were represented as percentage relative to control.
Results
THC Attenuated Hcy-Induced Cell Death in bEND3 Cells
To determine the protected role of TC on Hcy induced cytotoxicity, bEnd3 cell were cultured with or without Hcy and THC at different concentrations for 24hrs. Hcy-induced cytotoxicity was measured by determining the percentage of MTT. Cell death was significantly increased in THC (20–100μM) and Hcy (100–500μM)-treated cells after 24 hrs compared to untreated cells (Fig 1A, B). However, when adding low concentration of THC (15μM) to cells subsequent to Hcy (500uM) treatment, THC showed a neuroprotective effect against Hcy-induced toxicity (Fig. 1B). In addition, supplementation of anti-oxidant UA (50 μM) to Hcy treated culture, improved the cell viability (Fig. 1C).
Figure. 1.
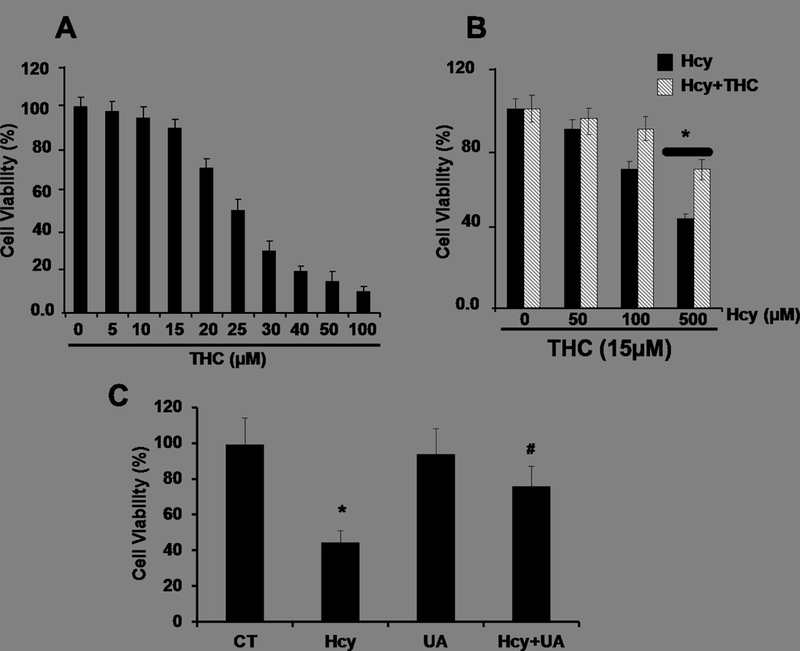
Effect of THC and Hcy on cell viability in bEnd3 cells. 1A and 1B. Cells were treated with different concentrations of THC (5–100 μM) and Hcy (50–500 μM) for 24 hrs before being subjected to MTT assay. 1B.The results suggest that THC (15 μM) showed a cytoprotective effect against Hcy-induced cell viability. 1C. Uric acid (50 μM) protects against Hcy induced bEnd3 cells viability. Data represents mean ± SEM. *P<0.05, versus control, # P<0.05, versus Hcy-treated cells; data analyzed from four independent experiments (n=4).
THC Attenuated Hcy induced intracellular ROS in bEND3 Cells
To determine whether Hcy treatment resulted in an increased in oxidative stress in bEnd3 cells leading to autophagy, the level of intracellular ROS was measured using the ROS-sensitive fluorescent probe, H2DCFH-DA, by a flow cytometry and confocal microscopy. There was a significant elevation of ROS levels in Hcy-treated cells as compared to control cells (Fig 2A, B) as determined by confocal microscopy. This increase of ROS levels was significantly reversed by subsequently incubation with antioxidant THC for 24 hrs. Furthermore, H2O2 treatment to bEND3 cells caused a robust increased in ROS production (Fig 2A, B). Similarly, in-situ labeling of MitoSOX™ Red reagent showed that the levels of mitochondrial ROS were increased in cells treated with high Hcy (500 μM) as indicated by flow cytometry (Fig 2C, D). Histograms of flow cytometry analysis showed marked decrease of mean intensity when cells were treated with combination of both THC (15μM) and High Hcy (500μm) (Fig 2D). These results suggest that Hcy-induced ROS generation in bEnd3 cells was attenuated by THC. Further to study the ROS production upon autophagy inhibitor 3-MA and Bafilomycin A1, we tested the level of mitochondrial derived ROS by ROS-Glo™ H2O2 assay. The result showed marked increase in ROS production under both the autophagy inhibitor 3-MA and Bafilomycin A1 (Fig 2E). In addition to THC, administration of ROS scavenger UA (50 μM) to Hcy treated cells was able to quench the cellular ROS (Fig 2E).
Figure. 2.
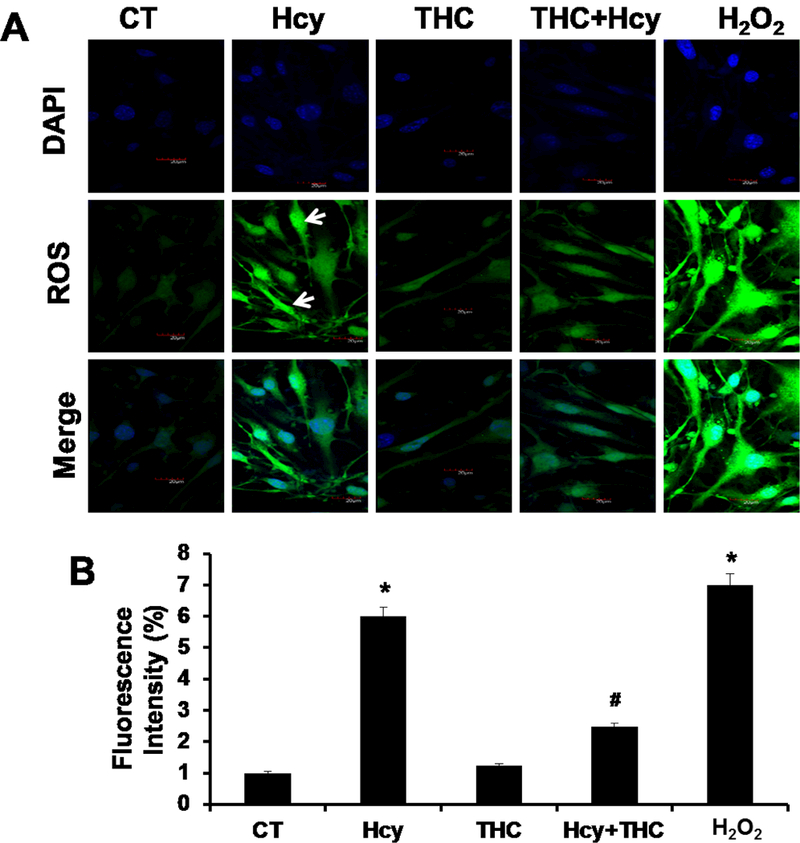
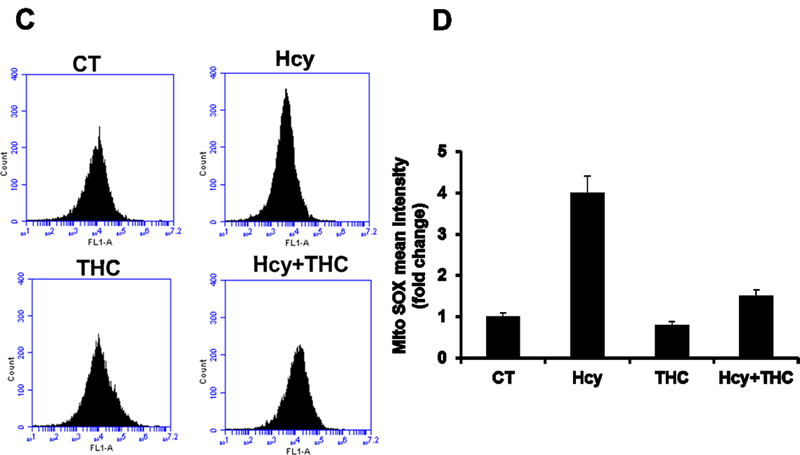
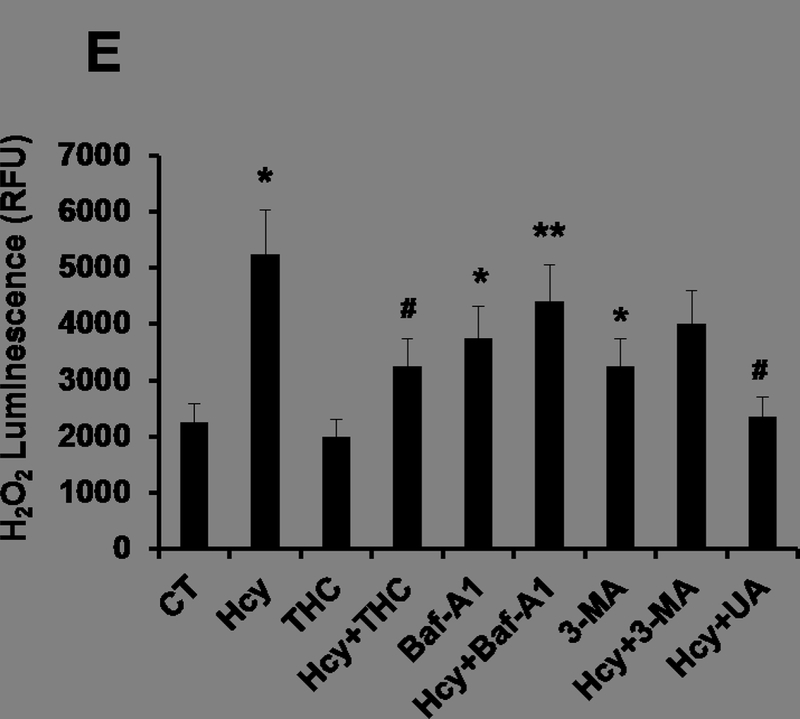
Effects of THC on Hcy induced intracellular ROS generation in bEnd3 cells. 2A and 2B. Confocal analysis showing oxidative stress in bEnd3 cells using H2DCF-DA fluorescent dye. Green color intensity is the representation of oxidative stress as indicated by white arrows. Blue color (left most images) represents cell nuclei stained with DAPI. 2C and 2D. Flow cytometry data showing the level of mitochondrial ROS generation in Hcy and THC treated bEnd3 cells using MitoSOX™ Red reagent. 2E. Treatment with Hcy resulted in increased H2O2 production, which reached statistical significance at 500 μM Hcy and was completely abolished by coincubation with both THC (15 μM) and antioxidant uric acid (50 μM). All images were taken at 60X magnification. Data represents mean ± SEM. *P<0.05, versus control, # P<0.05, versus Hcy-treated cells; data analyzed from four independent experiments (n=4).
THC Attenuated Hcy induced Autophagy in bEND3 Cells
To evaluate whether the cell death caused by Hcy treatment was mediated by autophagy, we monitored autophagy by two parameters: monodansylcadaverine (MDC) staining and GFP-LC3 distribution. Confocal fluorescence microscopy showed extensive punctate MDC staining (Fig 3) and GFP-LC3 localization (Fig 4) in bEnd3 cells. bEnd3 cells were treated with Hcy (500μM) for 24 hrs and the formation of autophagic vacuoles was examined under a phase contrast microscope. As shown in Fig 3, 500μM Hcy treatment induced the formation of autophagic vacuoles, while THC (15μM) treatment markedly decreased in autophagic vacuoles production induced by the Hcy treatment, however, in the treatment group of THC (15μM) and 3-MA (autophagy inhibitors), markedly decreased in any formation of autophagic vacuoles. In addition, the amount of autophagic vacuole formation was significantly elevated in H2O2 (positive control, oxidant) treatment as compared to the control (Fig 3). Next, the cellular localization of GFP-LC3 protein was assessed by confocal microscopy. The negative control group showed an almost undetectable level of mitophagy, while the H2O2 treatment produced a strong signal for mitophagy. Also, the level of mitophagy increased (P<0.05) in Hcy treated cells as compared to the control group. Though the level of co-localization increased (P<0.05) in THC treated cells as compared to the control, it was still drastically lower than Hcy. Furthermore, THC reduced the mitophagy levels in co-treatment with Hcy to an intensity mimicking THC alone (Fig 4).
Figure. 3.
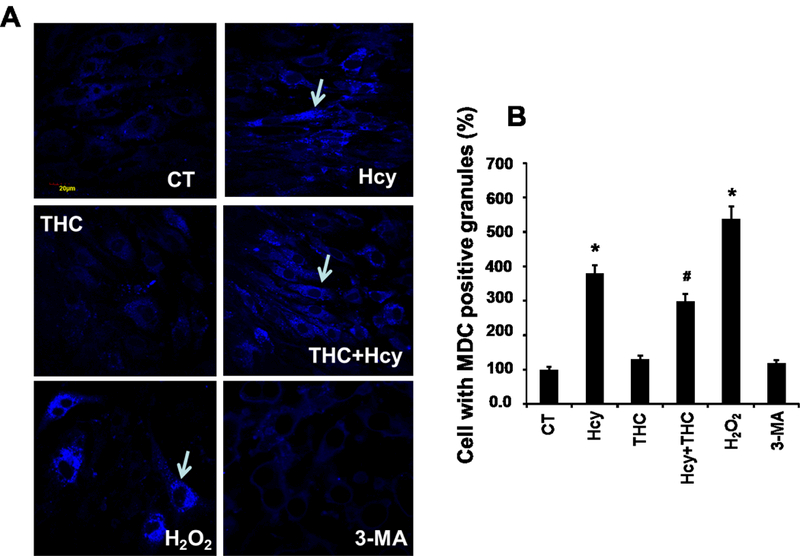
Effect of THC on Hcy mediated autophagy in bEnd3 cells. 3A. Confocal images of MDC positive granules in bEnd3 cells as indicated with white arrows. All images were taken at 60X magnification. 3B: Bar diagram representing intensity of MDC stained granules in different bEnd3 cells treatment groups. Data represents mean ± SEM. *P<0.05, versus control, # P<0.05, versus Hcy-treated cells; data analyzed from four independent experiments (n=4).
Figure. 4.
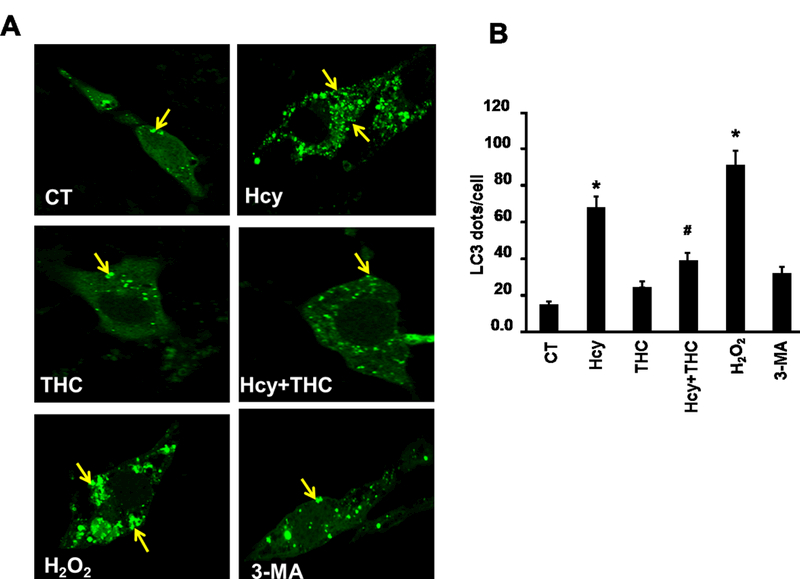
THC inhibits Hcy mediated autophagy in bEnd3 cells. 4A. Confocal images representing LC3 positive granules, an autophagy marker, in different cell treatment groups. The granules (green dots) are represented with yellow arrows. All images were taken at 60X magnification. 4B. Bar diagram quantitating LC3 dots per cells. The bar is the representation of 20 LC3 dot positive cells analyzed. Data represents mean ± SEM. *P<0.05, versus control, # P<0.05, versus Hcy-treated cells; data analyzed from four independent experiments (n=4).
Mitochondrial Dynamics
Earlier studies showed that NIX localizes to the outer mitochondrial membrane where it affects mitochondrial integrity (Zhang et al., 2009). To investigate if NIX recruits LC3 to stressed mitochondria, we performed co-localization studies. The cell images stained with NIX and LC3 were merged and observed that the two markers were co-localized with each other in Hcy treated group (P<0.05) and THC treatment decreases this co-localization (Fig 5A, B).
Figure. 5.
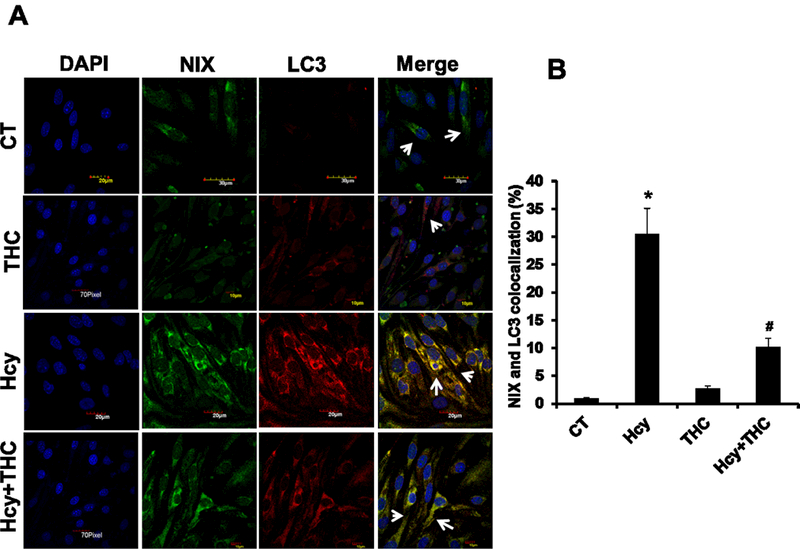
Effect of THC on Hcy induced NIX recruitment of LC3 to stressed mitochondria. 5A. Confocal images representing immune co-localization of LC3 (red color; third panel) and NIX (green color; second panel) in different bEnd3 cells treatment groups. Nuclei were stained with DAPI (left most image panels) and the merged images are illustrated at right most panel. 5B. The number of mitochondria co-localized with both mitochondria receptor NIX and autophagy marker LC3 were quantified in bEnd3 cells. All images were taken at 60X magnification. Data represents mean ± SEM. *P<0.05, versus control, # P<0.05, versus Hcy-treated cells; data analyzed from four independent experiments (n=4).
Hcy induced LC3, MFN-2 and DRP-1 protein expression
The protein levels of LC3 (autophagy), MFN-2 (mitochondria fusion) and DRP-1 (mitochondria fission) were increased in Hcy treated cells as compared to the untreated cells. The levels of the above proteins in Hcy treated cells significantly decreased by treatment with THC (Fig 6A, B, C and D). Similarly, the mRNA expressions for the three genes (LC3, MFN-2, DRP-1) were found to be substantially high in Hcy treated cells as determined by semi-quantitative PCR (Fig 7A, B, C and D), and were normalized with THC treatment.
Figure. 6.
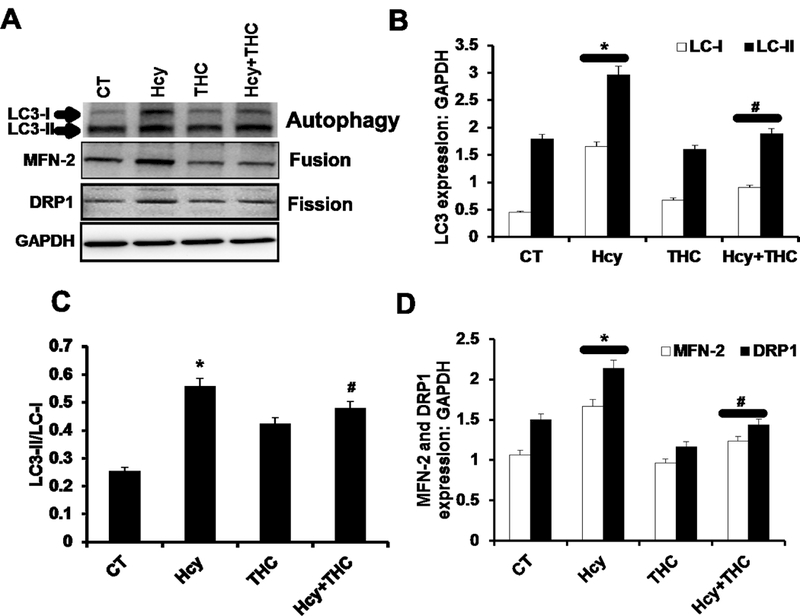
Effect of THC on Hcy induced mitochondrial dynamics and autophagy. 6A: Western blot images showing the protein expression of LC3, MFN2, and DRP-1 in different bEnd3 treated cells. 6B, 6C and 6D: Bar graphs representing the protein intensity of LC3 (6B), Mfn-2 (6C) and DRP-1 (6D) in different bEnd3 cells treated groups. Data represents mean ± SEM. *p<0.05, versus control, #p <0.005 Hcy-treated cells; data analyzed from four independent experiments (n=4).
Figure. 7.
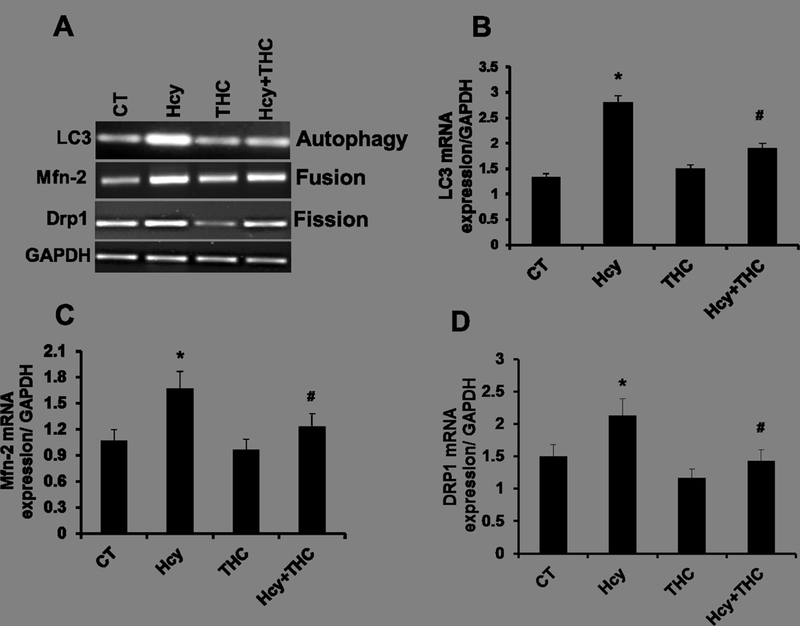
Gene expression study of Hcy induced mitochondrial dynamics and autophagy. 7A: RT-PCR images showing the transcript levels of LC3, MFN2, and DRP-1. 7B, 7C and 7D. Representative bar graphs showing transcript level of Lc3, Drp-1 and Mfn-2. Data represents mean ± SEM. *P<0.05, versus control, #p<0.005 Hcy-treated cells; data analyzed from four independent experiments (n=4).
THC protects bEND3 cells against Hcy induced apoptosis
In this study, we confirmed that Hcy treatment under these conditions led to a significant induction of apoptosis in bEnd3 cells (Fig 8A, B). Next, we sought to determine whether THC has been shown to block apoptosis of bEnd3 cells, could also modulate Hcy induced apoptosis. To further confirm the apoptotic inhibitory effect of THC observed using the TUNEL method, we used the Caspase-Glo® 3/7 Assay. As shown in Fig. 8C, in the presence of Hcy at 24 hrs, the caspase3/7 activity is increased. However, addition of THC to cells subsequent to Hcy treatment, THC showed a protective effect against Hcy-induced increased caspase 3/7 activity. To examine whether bafilomycin A1 and 3-MA induced apoptosis of Hcy is truly associated with activation of apoptosis in bEnd3 cells, we treated bEnd3 cells for 24 hrs with bafilomycin A1 (20 nM) and 3-MA (5 mM) and then Caspase-Glo® 3/7 Assay activity is determined. The results of the Caspase-Glo® 3/7 Assay showed that bafilomycin A1 decreased apoptosis in the bEnd3 cells in Hcy treated culture (Figure 8C). In addition to THC, administration of anti-oxidant UA (50 μM) to Hcy treated cells was able to protect from Hcy mediated procaspase-3 /7 activation (Fig 8C).
Figure. 8.
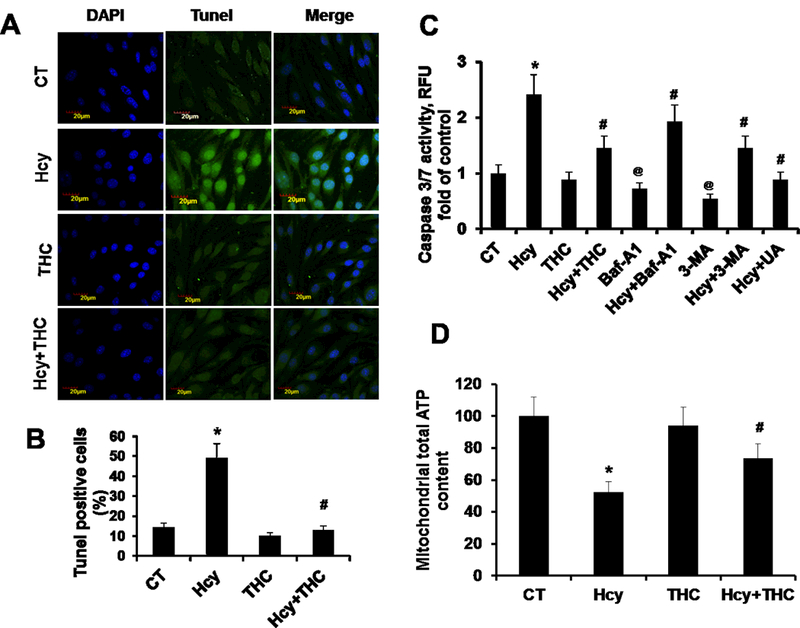
THC inhibits Hcy-induced apoptosis and mitochondrial dysfunction. 8A. For the TUNEL method, bEnd3 cells were grown in a 8-well assay plate. The cells were treated with or without THC in presence of Hcy stimulation for 24 hrs. The cells with green fluorescence represent apoptotic cells. 8B. Graph represents TUNEL assay results obtained from three independent experiments. 8C. Caspase-Glo® 3/7 Assay activity, bEnd3 cells were grown in a 96-well assay plate. The cells were analyzed for Caspase 3/7 Assay activity as described in Materials and Methods. 8C. Mitochondrial dysfunction by measurement of ATP generated following different groups of treatment. Data represents mean ± SEM. *P<0.05, versus control, #P<0.05, versus Hcy-treated cells, @P<0.05, versus control; data analyzed from four independent experiments (n=3).
Discussion
Mitochondria are the primary energy-producing organelles in the brain (Perier et al., 2012). Dysfunction of mitochondria leads to mitophagy through some mechanisms such as ROS generation and induction of the intrinsic apoptotic pathway (Perier et al., 2012). Interestingly, mitochondrial dysfunction is associated with the pathogenesis of many neurodegenerative disorders, including ischemia stroke and Alzheimer’s disease (Reddy et al., 2009, Perier et al., 2012, Marchi et al., 2012). Notable, these diseases have been also associated with HHcy (Kamat et al., 2013, Kalani et al., 2014). Thus, we explore in the present study the effect of THC on Hcy mediated modulation of mitochondria dynamics in brain endothelial cells. In the present study, we tested the hypothesis that whether or not increased level of Hcy impairs the balance of mitochondrial fission and fusion in mouse brain endothelial cells, resulting in mitochondria remodeling.
The endothelium controls nutrient transport, smooth muscle cell proliferation, movement of macrophages and leukocytes, and secretion of anticoagulant factors (Cines et al., 1998). Therefore, it can be expected that a compromised endothelium in the brain would be a major contributing factor to the pathology of conditions in neurodegenerative disorders. Previous studies have shown that a detrimental stressor to these cells is commonly observed with an increased production of mitochondrial ROS (Marchi et al., 2012). Moreover, supplementation with antioxidant ROS scavengers can decrease oxidative stress while simultaneously increasing the bioavailability of NO to give an improved endothelium (Lobo et al., 2010). In the present study, the dose of Hcy was decided on the basis of cell viability assay by MTT test (Fig 1). Further, we checked the effect of toxic dose of Hcy on free radical generation like ROS. There was a significant increase in the ROS generation in Hcy-treated brain endothelial cell (Fig 2). Later, treatment with THC showed a protective effect in Hcy-treated brain endothelial cells showed the potential of free radical scavenging activity of THC. Autophagy is a non-apoptotic form of programmed cell death. Most evidences indicate that at least in cells with intact apoptotic machinery, autophagy is primarily a pro-survival rather than a pro-death mechanism. This study summarizes the evidence linking autophagy to cell survival and cell death, the complex interplay between autophagy and apoptosis pathways, and the role of autophagy-dependent survival and death pathways in clinical diseases (Levine et al., 2005). Selective autophagy of mitochondria, known as mitophagy, is an important mitochondrial quality control mechanism that eliminates damaged mitochondria. Recent studies have identified specific regulators of mitophagy that ensure selective sequestration of mitochondria as cargo (Ashrafi et al., 2013). When overlaying these results with the autophagy and mitophagy expression, we found significant increase in Hcy treated cell which was normalized by THC treatment (Fig.3). One can conclude that it was in fact increased levels of ROS that leads to the observed degree of autophagy and mitophagy (Fig.4). Further in immunolabeling study, we observed that there was significant increase in autophagy marker (LC3), and their receptor was also increased. In co-labeling study, autophagy marker LC3 was localized on their receptor (Fig. 5). Additionally, it is important to explain the minimal increase of LC3 expression in the Hcy and positive control groups. Since autophagy increased in theses ROS inducing groups well beyond the other treatment groups, one would expect the marker for the event to increase. However, the awareness that the cleaved version of LC3 is the active component sheds light on the seemingly contradictory results. If the induction of autophagy depended upon the expression of the modified protein, one could reason that though no observable increase to the precursor’s expression was noticed, there must have been an increased level of activation of the precursor LC3-I to LC3-II. This can be tested by immunoblotting for the LC3 marker and taking a ratio (LC3-II/LC3-I) of the detected bands (Fig.6). Their molecular weights differ, so they can be resolved on a blotting membrane and visualized as two distinct bands. The intensity of their signal can be substituted into the ratio formula and if the ratio is high, then there should be an observed increase in autophagy for that particular group. This could explain the only slight increase in the Hcy group (Fig.6).
Maintenance of functional mitochondria requires fusion and fission of these dynamic organelles. The proteins that regulate mitochondrial dynamics are now associated with a broad range of cellular functions (Hollenbeck et al., 2005). Mitochondrial fission and fusion are often viewed as a finely tuned balance within cells, yet an integrated and quantitative understanding of how these processes interact with each other and with other mitochondrial and cellular processes is not well formulated. Direct visual observation of mitochondrial fission and fusion events, together with computational approaches promise to provide new insight (Westernman, 2002, Ong et al., 2010). Mitochondrial fission and fusion are known to play roles in maintaining the integrity of mitochondria, electrical and biochemical connectivity, turnover of mitochondria, and segregation and protection of mitochondrial DNA. It can also be inferred from the results that increased fission events are associated with the increased mitophagy events (Fig 6 &7). In addition, when cells were treated with THC, these observed effects decreased. Moreover, the fission and fusion machinery have been implicated in programmed cell death pathways (Okamato et al., 2005). Hcy has been shown to induce the apoptosis of endothelial cells has been reported in several studies (Tyagi et al, 2006). We also found significant increase in apoptosis in Hcy treated cell which was normalized by THC treatment (Fig.8)
This could be attributed to the decreased levels of total intracellular ROS, thereby supporting the suspicion that mitophagy is induced by oxidative stress in the cell. In the present study there was not any effect on fission and fusion markers protein. If an increase in mitochondrial fusion were observed, it would stand to reason that an activating mechanism must be utilized for the expressed proteins to produce the increased fusion events and thereby an increased expression of the fusion markers would not be necessary.
Conclusion
It is inferred from the present study that HHcy causes mitochondrial dysfunction as evident from the obtained data. One could infer that if a patient had HHcy, then an increased level of mitophagy should accompany the risk factor. Ultimately, further investigation into how Hcy causes mitophagy should be investigated to potentially uncover targets for therapy. The present study explored that observation comprehensively and has provided the evidence of altered mitochondria in the presence of high homocysteine. Together, we conclude that an excess of Hcy, increase in ROS production causing imbalance in mitochondria fission/fusion in-part autophagy to precedes apoptosis and treatment of THC restore these events (Fig.9). Our work furthers the understanding of the damaging potential of hyperhomocysteinemia to brain endothelial cells and sheds light on novel mechanisms of homocysteine toxicity to brain (Fig.9).
Figure. 9.
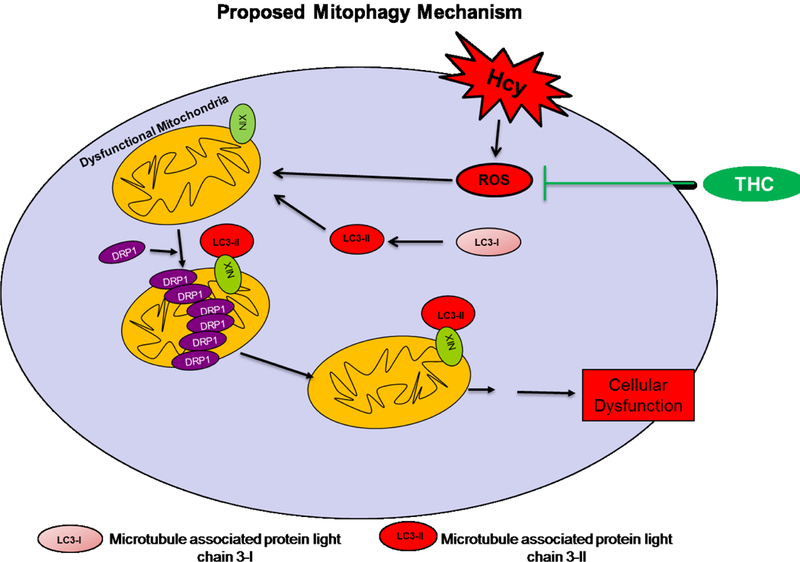
Proposed overall hypothesis. THC ameliorates Hcy induced ROS dependent oxidative damage and mitochondrial remodeling.
Acknowledgments
This work was supported by National Institutes of Health grants: HL-107640-NT. Authors are thankful to Dr.Jyoti Bala for critical editing.
Footnotes
Conflict of Interest: Authors have declared no conflict of interest.
References
- 1.Anand P, Thomas SG, Kunnumakkara AB, Sundaram C, Harikumar KB, Sung B, Tharakan ST, Misra K, Priyadarsini IK, Rajasekharan KN, Aggarwal BB. 2008. Biological activities of curcumin and its analogues (Congeners) made by man and Mother Nature. Biochemical pharmacology 76:1590–1611. [DOI] [PubMed] [Google Scholar]
- 2.Ansari R, Mahta A, Mallack E, Luo JJ. 2014. Hyperhomocysteinemia and Neurologic Disorders: a Review. J Clin Neurol 10:281–288. [DOI] [PMC free article] [PubMed] [Google Scholar]
- 3.Ashrafi G, Schwarz TL. 2013. The pathways of mitophagy for quality control and clearance of mitochondria. Cell death and differentiation 20:31–42. [DOI] [PMC free article] [PubMed] [Google Scholar]
- 4.Barth S, Glick D, Macleod KF. 2010. Autophagy: assays and artifacts. The Journal of pathology 221:117–124. [DOI] [PMC free article] [PubMed] [Google Scholar]
- 5.Benard G, Karbowski M. 2009. Mitochondrial fusion and division: Regulation and role in cell viability. Semin Cell Dev Biol 20:365–374. [DOI] [PMC free article] [PubMed] [Google Scholar]
- 6.Cines DB, Pollak ES, Buck CA, Loscalzo J, Zimmerman GA, McEver RP, Pober JS, Wick TM, Konkle BA, Schwartz BS, Barnathan ES, McCrae KR, Hug BA, Schmidt AM, Stern DM. 1998. Endothelial cells in physiology and in the pathophysiology of vascular disorders. Blood 91:3527–3561. [PubMed] [Google Scholar]
- 7.Cui J, Bai XY, Shi S, Cui S, Hong Q, Cai G, Chen X. 2012. Age-related changes in the function of autophagy in rat kidneys. Age 34:329–339. [DOI] [PMC free article] [PubMed] [Google Scholar]
- 8.Dattani JJ, Rajput DK, Moid N, Highland HN, George LB, Desai KR. 2010. Ameliorative effect of curcumin on hepatotoxicity induced by chloroquine phosphate. Environ Toxicol Pharmacol 30:103–109. [DOI] [PubMed] [Google Scholar]
- 9.Davidson SM, Duchen MR. 2007. Endothelial mitochondria: contributing to vascular function and disease. Circulation research 100:1128–1141. [DOI] [PubMed] [Google Scholar]
- 10.Ding WX, Yin XM. 2012. Mitophagy: mechanisms, pathophysiological roles, and analysis. Biological chemistry 393:547–564. [DOI] [PMC free article] [PubMed] [Google Scholar]
- 11.Dranka BP, Hill BG, Darley-Usmar VM. 2010. Mitochondrial reserve capacity in endothelial cells: The impact of nitric oxide and reactive oxygen species. Free radical biology & medicine 48:905–914. [DOI] [PMC free article] [PubMed] [Google Scholar]
- 12.Eskelinen EL, Saftig P. 2009. Autophagy: a lysosomal degradation pathway with a central role in health and disease. Biochimica et biophysica acta 1793:664–673. [DOI] [PubMed] [Google Scholar]
- 13.Frank S, Tolnay M. 2012. News from the powerhouses. Acta neuropathologica 123:155–156. [DOI] [PubMed] [Google Scholar]
- 14.Fujita N, Hayashi-Nishino M, Fukumoto H, Omori H, Yamamoto A, Noda T, Yoshimori T. 2008. An Atg4B mutant hampers the lipidation of LC3 paralogues and causes defects in autophagosome closure. Molecular biology of the cell 19:4651–4659. [DOI] [PMC free article] [PubMed] [Google Scholar]
- 15.Galluzzi L, Kepp O, Trojel-Hansen C, Kroemer G. 2012. Mitochondrial control of cellular life, stress, and death. Circulation research 111:1198–1207. [DOI] [PubMed] [Google Scholar]
- 16.Givvimani S, Munjal C, Tyagi N, Sen U, Metreveli N, Tyagi SC. 2012. Mitochondrial division/mitophagy inhibitor (Mdivi) ameliorates pressure overload induced heart failure. PloS one 7:e32388. [DOI] [PMC free article] [PubMed] [Google Scholar]
- 17.Gonzalez-Reyes S, Guzman-Beltran S, Medina-Campos ON, Pedraza-Chaverri J. 2013. Curcumin pretreatment induces Nrf2 and an antioxidant response and prevents hemin-induced toxicity in primary cultures of cerebellar granule neurons of rats. Oxidative medicine and cellular longevity 2013:801418. [DOI] [PMC free article] [PubMed] [Google Scholar]
- 18.Grandemange S, Herzig S, Martinou JC. 2009. Mitochondrial dynamics and cancer. Seminars in cancer biology 19:50–56. [DOI] [PubMed] [Google Scholar]
- 19.Hollenbeck PJ, Saxton WM. 2005. The axonal transport of mitochondria. Journal of cell science 118:5411–5419. [DOI] [PMC free article] [PubMed] [Google Scholar]
- 20.Jeong SH, Kim HK, Song IS, Noh SJ, Marquez J, Ko KS, Rhee BD, Kim N, Mishchenko NP, Fedoreyev SA, Stonik VA, Han J. 2015. Echinochrome a increases mitochondrial mass and function by modulating mitochondrial biogenesis regulatory genes. Marine Drugs 12:4602–15. [DOI] [PMC free article] [PubMed] [Google Scholar]
- 21.Kabeya Y, Mizushima N, Ueno T, Yamamoto A, Kirisako T, Noda T, Kominami E, Ohsumi Y, Yoshimori T. 2000. LC3, a mammalian homologue of yeast Apg8p, is localized in autophagosome membranes after processing. The EMBO journal 19:5720–5728. [DOI] [PMC free article] [PubMed] [Google Scholar]
- 22.Kalani A, Kamat PK, Givvimani S, Brown K, Metreveli N, Tyagi SC, Tyagi N. 2014. Nutri-epigenetics ameliorates blood-brain barrier damage and neurodegeneration in hyperhomocysteinemia: role of folic acid. J Mol Neurosci 52:202–215. [DOI] [PMC free article] [PubMed] [Google Scholar]
- 23.Kamat PK, Kalani A, Givvimani S, Sathnur PB, Tyagi SC, Tyagi N. 2013. Hydrogen sulfide attenuates neurodegeneration and neurovascular dysfunction induced by intracerebral-administered homocysteine in mice. Neuroscience 252:302–319. [DOI] [PMC free article] [PubMed] [Google Scholar]
- 24.Kamat PK, Vacek JC, Kalani A, Tyagi N. 2015. Homocysteine Induced Cerebrovascular Dysfunction: A Link to Alzheimer’s Disease Etiology. Open Neurol J 9:9–14. [DOI] [PMC free article] [PubMed] [Google Scholar]
- 25.Kluge MA, Fetterman JL, Vita JA. 2013. Mitochondria and endothelial function. Circulation research 112:1171–1188. [DOI] [PMC free article] [PubMed] [Google Scholar]
- 26.Kubli DA, Gustafsson AB. 2012. Mitochondria and mitophagy: the yin and yang of cell death control. Circulation research 111:1208–1221. [DOI] [PMC free article] [PubMed] [Google Scholar]
- 27.Levine B, Yuan J. 2005. Autophagy in cell death: an innocent convict? The Journal of clinical investigation 115:2679–2688. [DOI] [PMC free article] [PubMed] [Google Scholar]
- 28.Lobo V, Patil A, Phatak A, Chandra N. 2010. Free radicals, antioxidants and functional foods: Impact on human health. Pharmacognosy reviews 4:118–126. [DOI] [PMC free article] [PubMed] [Google Scholar]
- 29.Marchi S, Giorgi C, Suski JM, Agnoletto C, Bononi A, Bonora M, De Marchi E, Missiroli S, Patergnani S, Poletti F, Rimessi A, Duszynski J, Wieckowski MR, Pinton P. 2012. Mitochondria-ros crosstalk in the control of cell death and aging. J Signal Transduct 2012:329635. [DOI] [PMC free article] [PubMed] [Google Scholar]
- 30.Marín-García J, Akhmedov AT, Moe GW. 2013. Mitochondria in heart failure: the emerging role of mitochondrial dynamics. Heart Fail Rev 18:439–56. [DOI] [PubMed] [Google Scholar]
- 31.Mosmann T 1983. Rapid colorimetric assay for cellular growth and survival: application to proliferation and cytotoxicity assays. Journal of immunological methods 65:55–63. [DOI] [PubMed] [Google Scholar]
- 32.Moustafa AA, Hewedi DH, Eissa AM, Frydecka D, Misiak B. 2014. Homocysteine levels in schizophrenia and affective disorders-focus on cognition. Front Behav Neurosci 8:343. [DOI] [PMC free article] [PubMed] [Google Scholar]
- 33.Mukhopadhyay P, Rajesh M, Yoshihiro K, Haskó G, and Pachera P. 2007. Simple quantitative detection of mitochondrial superoxide production in live cells. Biochem Biophys Res Commun 358: 203–208. [DOI] [PMC free article] [PubMed] [Google Scholar]
- 34.Nishida K, Yamaguchi O, Otsu K. 2008. Crosstalk between autophagy and apoptosis in heart disease. Circulation research 103:343–351. [DOI] [PubMed] [Google Scholar]
- 35.Okamoto K, Shaw JM. 2005. Mitochondrial morphology and dynamics in yeast and multicellular eukaryotes. Annual review of genetics 39:503–536. [DOI] [PubMed] [Google Scholar]
- 36.Ong SB, Subrayan S, Lim SY, Yellon DM, Davidson SM, Hausenloy DJ. 2010. Inhibiting mitochondrial fission protects the heart against ischemia/reperfusion injury. Circulation 121:2012–2022. [DOI] [PubMed] [Google Scholar]
- 37.Osellame LD, Blacker TS, Duchen MR. 2012. Cellular and molecular mechanisms of mitochondrial function. Best Pract Res Clin Endocrinol Metab 26:711–723. [DOI] [PMC free article] [PubMed] [Google Scholar]
- 38.Park SJ, Shin JH, Kim ES, Jo YK, Kim JH, Hwang JJ, Kim JC, Cho DH. 2012. Mitochondrial fragmentation caused by phenanthroline promotes mitophagy. FEBS letters 586:4303–4310. [DOI] [PubMed] [Google Scholar]
- 39.Perier C, Vila M. 2012. Mitochondrial biology and Parkinson’s disease. Cold Spring Harbor perspectives in medicine 2:a009332. [DOI] [PMC free article] [PubMed] [Google Scholar]
- 40.Ranieri M, Brajkovic S, Riboldi G, Ronchi D, Rizzo F, Bresolin N, Corti S, Comi GP. 2013. Mitochondrial Fusion Proteins and Human Diseases. Neurol Res Int 2013:293893. [DOI] [PMC free article] [PubMed] [Google Scholar]
- 41.Reddy PH. 2009. Role of mitochondria in neurodegenerative diseases: mitochondria as a therapeutic target in Alzheimer’s disease. CNS spectrums 14:8–13. [DOI] [PMC free article] [PubMed] [Google Scholar]
- 42.Sato A, Nakada K, Hayashi J. 2006. Mitochondrial dynamics and aging: Mitochondrial interaction preventing individuals from expression of respiratory deficiency caused by mutant mtDNA. Biochimica et biophysica acta 1763:473–481. [DOI] [PubMed] [Google Scholar]
- 43.Scherz-Shouval R, Shvets E, Fass E, Shorer H, Gil L, Elazar Z. 2007. Reactive oxygen species are essential for autophagy and specifically regulate the activity of Atg4. The EMBO journal 26:1749–1760. [DOI] [PMC free article] [PubMed] [Google Scholar]
- 44.Sharma C, Suhalka P, Sukhwal P, Jaiswal N, Bhatnagar M. 2014. Curcumin attenuates neurotoxicity induced by fluoride: An in vivo evidence. Pharmacognosy magazine 10:61–65. [DOI] [PMC free article] [PubMed] [Google Scholar]
- 45.Shenouda SM, Widlansky ME, Chen K, Xu G, Holbrook M, Tabit CE, Hamburg NM, Frame AA, Caiano TL, Kluge MA, Duess MA, Levit A, Kim B, Hartman ML, Joseph L, Shirihai OS, Vita JA. 2011. Altered mitochondrial dynamics contributes to endothelial dysfunction in diabetes mellitus. Circulation 124:444–453. [DOI] [PMC free article] [PubMed] [Google Scholar]
- 46.Sipkens JA, Hahn N, van den Brand CS, Meischl C, Cillessen SA, Smith DE, Juffermans LJ, Musters RJ, Roos D, Jakobs C, Blom HJ, Smulders YM, Krijnen PA, Stehouwer CD, Rauwerda JA, van Hinsbergh VW, Niessen HW. 2013. Homocysteine-induced apoptosis in endothelial cells coincides with nuclear NOX2 and peri-nuclear NOX4 activity. Cell Biochem Biophys 67:341–52. [DOI] [PMC free article] [PubMed] [Google Scholar]
- 47.Suen DF, Norris KL, Youle RJ. 2008. Mitochondrial dynamics and apoptosis. Genes & development 22:1577–1590. [DOI] [PMC free article] [PubMed] [Google Scholar]
- 48.Swamy AV, Gulliaya S, Thippeswamy A, Koti BC, Manjula DV. 2012. Cardioprotective effect of curcumin against doxorubicin-induced myocardial toxicity in albino rats. Indian journal of pharmacology 44:73–77. [DOI] [PMC free article] [PubMed] [Google Scholar]
- 49.Twig G, Shirihai OS. 2011. The interplay between mitochondrial dynamics and mitophagy. Antioxidants & redox signaling 14:1939–1951. [DOI] [PMC free article] [PubMed] [Google Scholar]
- 50.Tyagi N, Qipshidze N, Munjal C, Vacek JC, Metreveli N, Givvimani S, Tyagi SC. 2012. Tetrahydrocurcumin ameliorates homocysteinylated cytochrome-c mediated autophagy in hyperhomocysteinemia mice after cerebral ischemia. J Mol Neurosci 47:128–138. [DOI] [PMC free article] [PubMed] [Google Scholar]
- 51.Ueki M, Ueno M, Morishita J, Maekawa N. 2013. Curcumin ameliorates cisplatin-induced nephrotoxicity by inhibiting renal inflammation in mice. Journal of bioscience and bioengineering 115:547–551. [DOI] [PubMed] [Google Scholar]
- 52.Veeranki S, Tyagi SC. 2013. Defective Homocysteine Metabolism: Potential Implications for Skeletal Muscle Malfunction. Int J Mol Sci 14:15074–15091. [DOI] [PMC free article] [PubMed] [Google Scholar]
- 53.Westermann B 2002. Merging mitochondria matters: cellular role and molecular machinery of mitochondrial fusion. EMBO reports 3:527–531. [DOI] [PMC free article] [PubMed] [Google Scholar]
- 54.Westermann B 2010. Mitochondrial dynamics in model organisms: what yeasts, worms and flies have taught us about fusion and fission of mitochondria. Semin Cell Dev Biol 21:542–549. [DOI] [PubMed] [Google Scholar]
- 55.Westermann B 2010. Mitochondrial fusion and fission in cell life and death. Nat Rev Mol Cell Biol 11:872–884. [DOI] [PubMed] [Google Scholar]
- 56.Zhang J, Ney PA. 2009. Role of BNIP3 and NIX in cell death, autophagy, and mitophagy. Cell Death Differ 16:939–46. [DOI] [PMC free article] [PubMed] [Google Scholar]
- 57.Zhang J 2013. Autophagy and Mitophagy in Cellular Damage Control. Redox biology 1:19–23. [DOI] [PMC free article] [PubMed] [Google Scholar]
- 58.Zhao J, Zhang J, Yu M, Xie Y, Huang Y, Wolff DW, Abel PW, Tu Y. 2013. Mitochondrial dynamics regulates migration and invasion of breast cancer cells. Oncogene 32:4814–4824. [DOI] [PMC free article] [PubMed] [Google Scholar]
- 59.Zhu YG, Chen XC, Chen ZZ, Zeng YQ, Shi GB, Su YH, Peng X. 2004. Curcumin protects mitochondria from oxidative damage and attenuates apoptosis in cortical neurons. Acta Pharmacol Sin 25:1606–1612. [PubMed] [Google Scholar]
- 60.Tyagi N, Ovechkin AV, Lominadze D, Moshal KS, Tyagi SC. Mitochondrial mechanism of microvascular endothelial cells apoptosis in hyperhomocysteinemia. J Cell Biochem.2006August 1; 98(5):1150–62. [DOI] [PMC free article] [PubMed] [Google Scholar]


