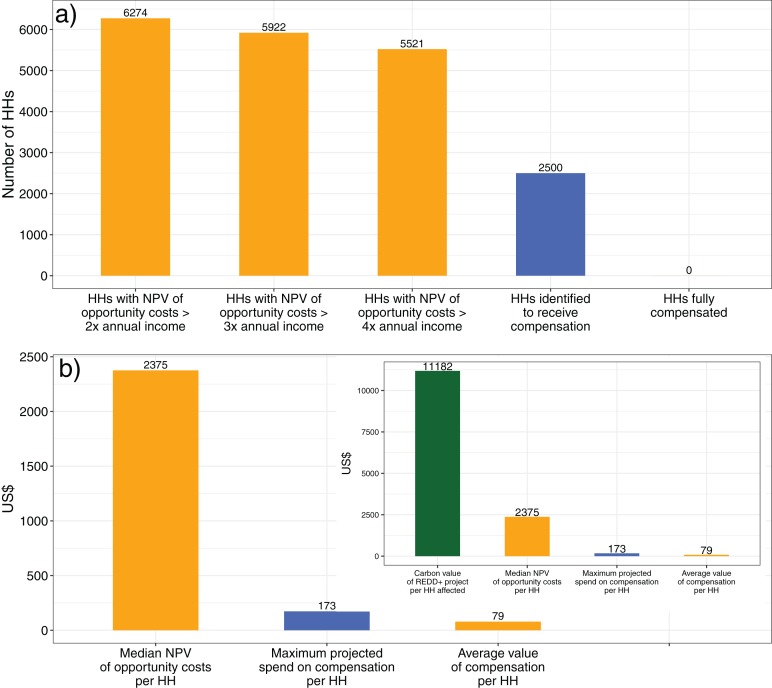
Figure 5. The underfunding of conservation compensation.
(A) A comparison between the number of households with NPV of opportunity costs greater than 2–4 times median annual household income, the number of households identified to receive compensation, and our estimate of the number fully compensated. (B) Comparison between the magnitude of the median net present value (NPV) of household opportunity cost (from our choice experiment), the maximum projected spend on compensation, and households’ ex post valuation of the compensation provided (from our contingent valuation). The inset puts these figures in the context of our estimate of the carbon value per household of the REDD+ project in CAZ. Orange bars represent results from our survey and analysis, blue bars represent data obtained from published reports about the safeguarding process.

