

Abstract
Mammalian cells integrate mitogen and stress signaling prior to the end of G1 phase to decide whether or not to enter the cell cycle1–4. Before cells can replicate their DNA in S phase, they have to activate cyclin-dependent kinases (CDKs), induce an E2F transcription program, and inactivate an E3 ubiquitin ligase, the anaphase promoting complex/cyclosome (APC/CCdh1). It was recently shown that stress can return cells to quiescence after CDK2 activation and E2F induction but cannot after inactivation of APC/CCdh1, arguing that APC/CCdh1 inactivation is the point-of-no-return for cell cycle entry3. While rapid inactivation of APC/CCdh1 requires early mitotic inhibitor 1 (Emi1)3,5, the molecular mechanism controlling this cell cycle commitment step is unknown. Here we show that cell cycle commitment is mediated by an Emi1-APC/CCdh1 dual-negative feedback switch, in which Emi1 is both a substrate and an inhibitor of APC/CCdh1. The inactivation switch triggers a transition between a state with low Emi1 levels and high APC/CCdh1 activity during G1 to a state with high Emi1 levels and low APC/CCdh1 activity during S and G2. Cell-based analysis, in vitro reconstitution, and modeling data show that the underlying dual-negative feedback is bistable and represents a robust irreversible switch. Together, our study argues that mammalian cells commit to the cell cycle by increasing CDK2 activity and Emi1 mRNA expression to trigger a one-way APC/CCdh1 inactivation switch mediated by Emi1 transitioning from a substrate to an inhibitor of APC/CCdh1.
To gain insights into the molecular control of APC/CCdh1 inactivation, we used a live-cell reporter for APC/CCdh1 activity3 and tested in non-transformed human MCF10A breast epithelial cells whether APC/CCdh1 inactivation has the hysteresis characteristic required for an irreversible cell cycle commitment decision. As outlined in Fig. 1a, bistable decisions in cell signaling require hysteresis, which means that only weak inhibition of the trigger activity should keep APC/CCdh1 “On” (solid line) while strong inhibition of the same trigger activity should keep the inactivated APC/CCdh1 switch “Off” (dashed line) (Extended Data Fig. 1a-c). When we titrated a CDK1/2 inhibitor during G1 phase when APC/CCdh1 was “On”, or during S or G2 phase when APC/CCdh1 was “Off”, we found that the EC50 to maintain APC/CCdh1 in the “On” state was 1.68 μM, while the EC50 to turn inactive APC/CCdh1 back to the “On” state was higher than 30 μM (Fig. 1b and Extended Data Fig. 1e). Thus, cells stay in their respective “On” or “Off” APC/CCdh1 state over a greater than 20-fold concentration window of the CDK1/2 inhibitor, demonstrating robust hysteresis. When we measured the fraction of cells that failed to turn APC/CCdh1 “Off” as a function of APC/CCdh1 activity at the time of the drug spike (Extended Data Fig. 1f,g), we found that ~ 70% of inactivation reflects a threshold APC/CCdh1 activity when APC/CCdh1 inactivation becomes irreversible. Together, the CDK2-regulated trigger mechanism, the marked hysteresis, and threshold argue that APC/CCdh1 inactivation is a robust bistable switch.
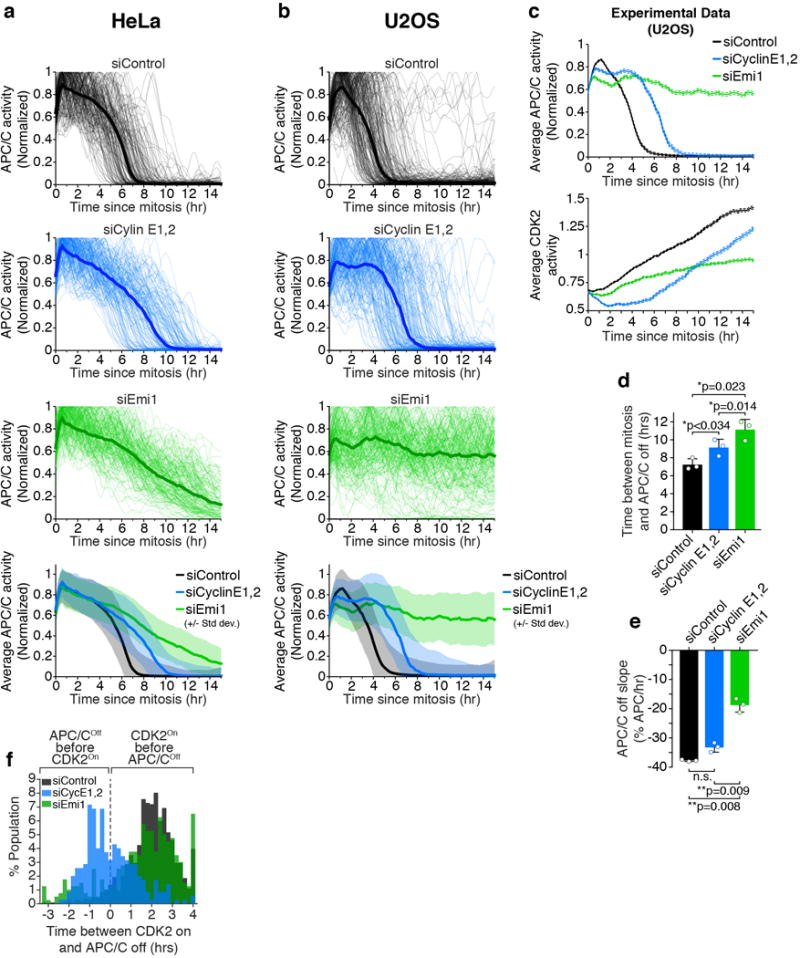
Figure 1. Emi1 conveys hysteresis to APC/CCdh1 inactivation.
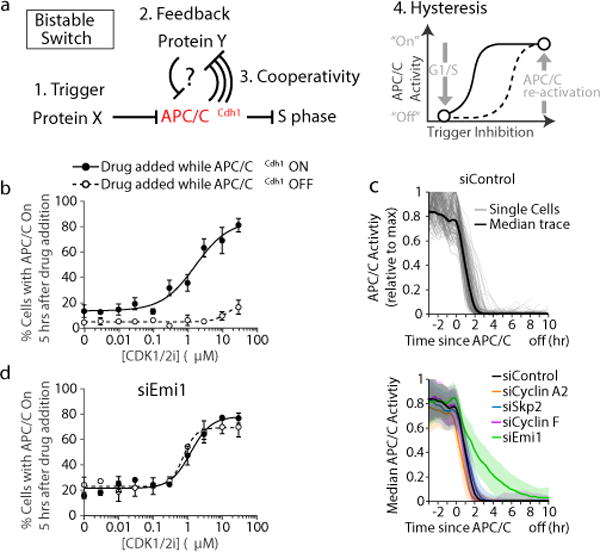
a, Requirements for a bistable switch. b, Dose response curve for the two subpopulations of cells treated with CDK1/2 inhibitor. Data were analyzed by nonlinear regression (sigmoidal dose-response, variable slope). n=3 independent experiments, errobars are S.E.M. c, APC/C activity traces aligned to when APC/CCdh1 inactivates in HeLa cells. Top: Median and single-cell traces of APC/C activity in control cells. Bottom: Median APC/C activity traces. Error bars are SD (n=602, 384, 399, 228, 400 cells respectively). d, Same experimental setup as (b) but MCF10A cells were first treated with Emi1 siRNA. Data were analyzed by nonlinear regression (sigmoidal dose-response, variable slope). n=3 independent experiments, errobars are S.E.M.
For a signaling system to generate a bistable switch, it requires in addition to hysteresis a positive or dual-negative feedback6 (Fig. 1a). We first investigated known APC/CCdh1 substrates that may also negatively regulate APC/CCdh1 to generate dual-negative feedback. The cullin E3 ligases SCFSkp2 and SCFCyclin F have both been reported to degrade APC/CCdh1 components7,8, and Cyclin A2/CDK2 can mediate APC/CCdh1 inhibition by phosphorylating Cdh19,10. Knockdown of Cyclin A2, Skp2, or Cyclin F (Extended Data Fig. 2a-c), did not affect the inactivation kinetics of APC/CCdh1 in three cell types (HeLa, MCF10A, and U2OS; Fig. 1c and Extended Data Fig. 3a-c), suggesting that these substrates may tune APC/C activity in other phases of the cell cycle but do not control the rapid APC/CCdh1 inactivation at the G1/S transition. In contrast, knockdown of the APC/CCdh1 inhibitor Emi1 (alias: Fbxo5)5,11, resulted in a significant decrease in the rate of APC/CCdh1 inactivation (Fig. 1c and Extended Data Fig. 2d and 3a-c). Strikingly, hysteresis in APC/CCdh1 inactivation was completely lost when Emi1 was knocked down (Fig. 1d and Extended Data Fig. 1e and 3d). Thus, Emi1 is responsible for the fast kinetics, bistability, as well as hysteresis observed in APC/CCdh1 inactivation.
Figure 3. APC/CCdh1 inactivation is a bistable switch driven by dual-negative feedback.
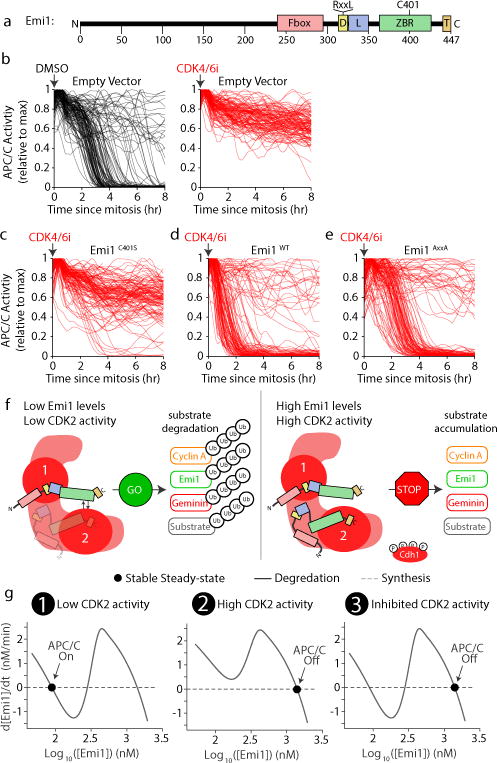
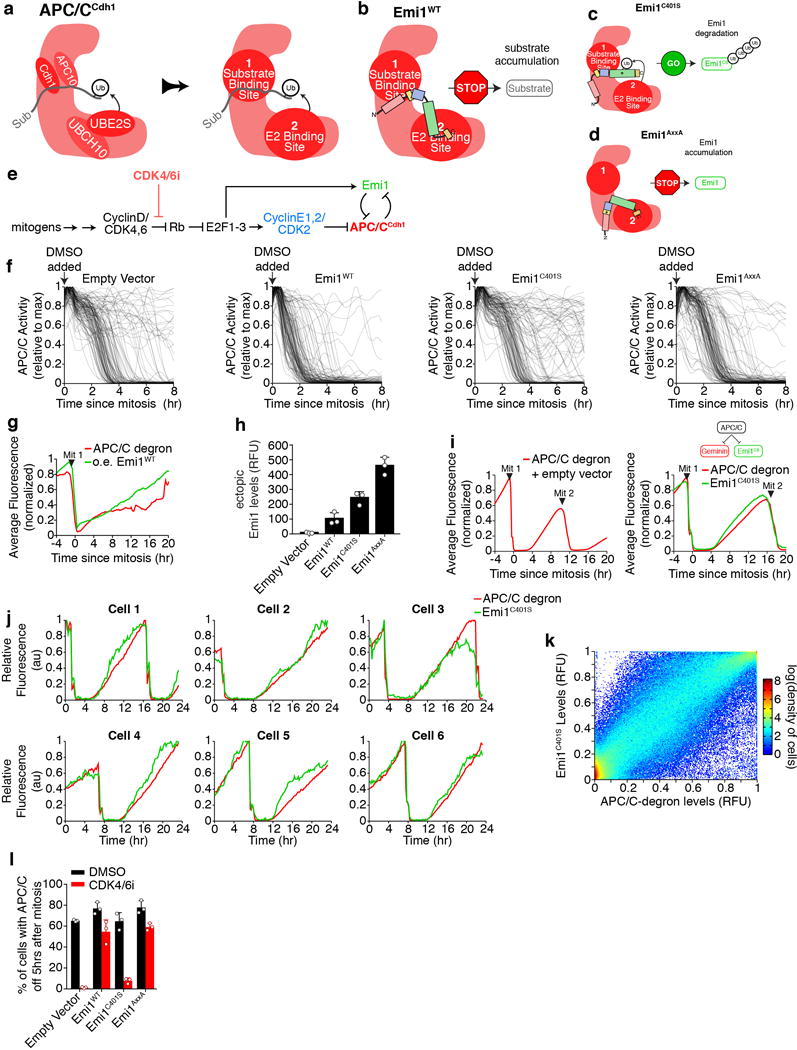
a, Emi1 structural elements. D-Box, APC/C degron sequence (RxxL); L, linker; ZBR, zinc-binding region; T, tail. b-e, MCF10A cells expressing either empty vector or various Emi1 mutants were treated with DMSO (black lines; b) or 1 μM CDK4/6 inhibitor (red lines; b-e). Drug treatment administered before mitosis as indicated by arrow. n=120 cells for each condition. Data representative of n=3 independent experiments. f, Two-binding site model for regulation of the APC/C by Emi1. Emi1 can bind either the substrate binding region (1) via its APC/C degron motif or the E2 binding site (2) via its ZBR and C-terminal tail. g, Three steady-state solutions for the mathematical model (see Extended Data Fig. 7a).
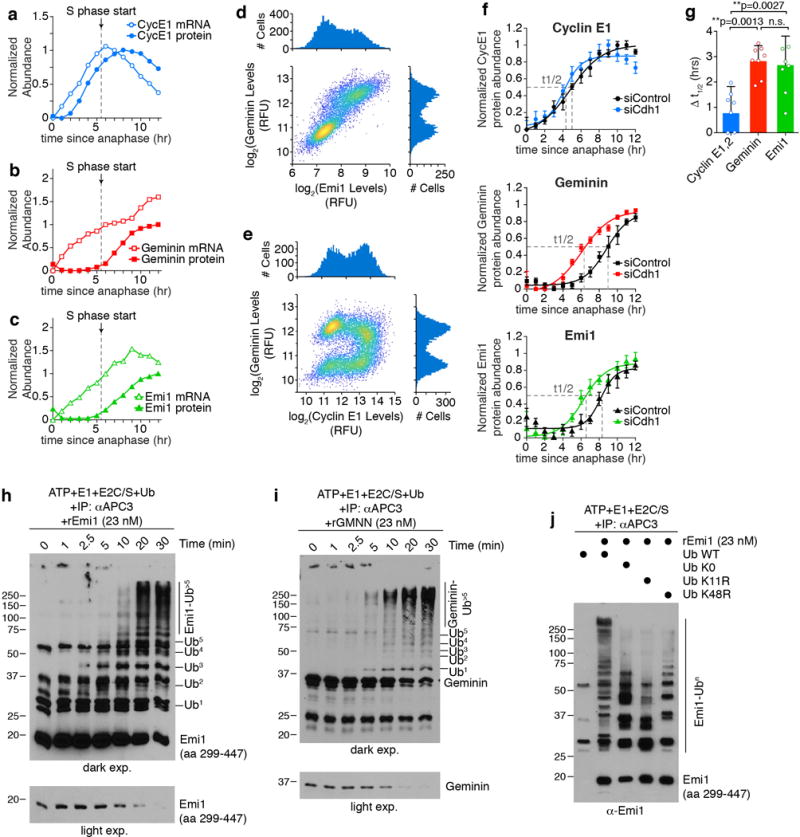
We measured Emi1 protein levels during the cell cycle to determine whether Emi1 may not only inhibit APC/CCdh1, but may also be part of a dual negative feedback by being degraded by APC/CCdh1 in G1 (Extended Data Fig. 3e). Indeed, Emi1 protein levels were low in G1 phase when APC/CCdh1 is active and first started to accumulate about 6 hours after mitosis coincident with the inactivation of APC/CCdh1 (Fig. 2a and Extended Data Fig. 4a,b). Low Emi1 protein levels in G1 phase are a consequence of Emi1 degradation during G1 as treatment with the proteasome inhibitor MG132 increased Emi1 levels (Extended Data Fig. 4c). This degradation of Emi1 is unlikely to be mediated by Polo-like kinase and SCFβ-TrCP 12 as these regulators of Emi1 degradation are active in pro-metaphase and not in G1 phase13. Inhibition with the small molecule APC/C inhibitor proTAME14 increased Emi1 levels as well as the level of the APC/C substrate Cyclin A2 (Fig. 2b), consistent with Emi1 being degraded in G1 by APC/CCdh1.
Figure 2. The APC/CCdh1 inhibitor Emi1 is also an APC/CCdh1 substrate degraded during G1 and building up at G1/S.
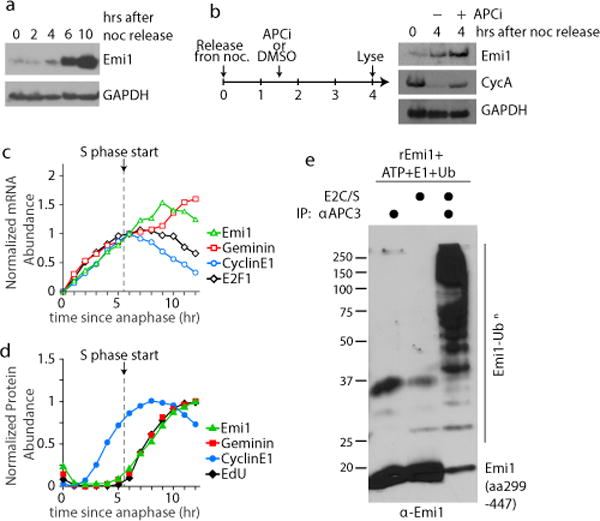
a, HeLa cells were synchronized with nocodazole and mitotic shake-off. Image is representative of 3 independent experiments. b, HeLa Cells were treated as in (a), but 1.5hrs after release, cells were treated with either DMSO or 30 μM proTAME, a small-molecule APC/C inhibitor. Lysates were collected 4 hours after release. Image is representative of 2 independent experiments. c,d, Live-cell imaging was combined with fixed cell analysis to measure mRNA (c) or protein and EdU (d) levels over time since mitosis. Median levels from 1 hour bins were plotted. n=2 independent experiments. e, in vitro ubiquitination assay using APC/C from cells in G1 phase and recombinant Emi1 (amino acids 299-447). E2C/S, E2 enzymes Ube2C and Ube2S. Image is representative of 2 independent experiments.
In a second strategy to test whether Emi1 is a substrate of APC/CCdh1 in G1, we used single-cell analysis of both Emi1 mRNA copy number and protein levels during G1 (Extended Data Fig. 4d). We confirmed that the mRNAs of the known E2F targets Emi1, Geminin, E2F1, and Cyclin E1 all immediately start to increase after anaphase (Fig. 2c and Extended Data Fig. 4e,f), and that Cyclin E1 protein levels closely follow Cyclin E1 mRNA levels (Fig. 2d and Extended Data Fig. 5a). In contrast, the increase of both Geminin and Emi1 protein levels were significantly delayed compared to their respective mRNAs (Fig. 2c,d and Extended Data Fig. 5b,c). Both Geminin, a well-characterized APC/CCdh1 substrate, and Emi1 proteins levels started accumulating about 5-6 hours after anaphase, precisely when APC/CCdh1 is inactivated and EdU starts to be incorporated at the start of S phase (single cell analysis in Extended Data Fig. 5d,e). We also tested for a role of APC/CCdh1 in degrading Emi1 by knocking down the APC/C co-activator Cdh1 with siRNA, and found that both Geminin and Emi1 protein levels accumulated much earlier compared to control (Extended Data Fig. 5f,g), further confirming that APC/CCdh1 is required for Emi1 degradation in G1.
To determine whether Emi1 is a direct substrate of APC/CCdh1, we used recombinant Emi1 and immuno-purified APC/CCdh1 along with ubiquitin, E1, E2s (Ube2c and Ube2s), and ATP to test for Emi1 ubiquitination in vitro. Markedly, for relatively low concentrations of Emi1 in this assay (23 nM), APC/CCdh1 efficiently ubiquitinated recombinant Emi1, providing evidence that Emi1 is a direct substrate for APC/CCdh1 (Fig. 2e). A kinetic analysis of Emi1 ubiquitination revealed that Emi1 is a distributive substrate15, meaning that Emi1 poly-ubiquitination requires multiple successive encounters of Emi1 with APC/CCdh1 (Extended Data Fig. 5h,i). Using mutant ubiquitins that lack one or all lysines, we also found that Emi1 is primarily poly-ubiquitinated via K11 and K48 ubiquitin linkages, similar to other APC/CCdh1 substrates16 (Extended Data Fig. 5j).
Having established that Emi1 is an APC/CCdh1 substrate that can be degraded by APC/CCdh1 in G1 phase, the question arises if and how Emi1 can also be an inhibitor of APC/CCdh1 in S/G2 phase. While it is conceivable that this transition is regulated by post-transcriptional modifications on Emi117, previous structural data identified binding interactions between two domains of Emi1 and two different regions of APC/CCdh1 18,19 (Fig. 3a and Extended Data Fig. 6a,b), which suggested that Emi1 may switch from being a substrate to an inhibitor by using two separate binding sites on APC/CCdh1. First, Emi1 binds to the substrate adapter proteins Cdh1 and APC10 through an RxxL D-Box motif, similar to typical APC/CCdh1 substrates. Second, Emi1 binds to APC1, APC2, and APC11 through its Zinc Binding Region and to APC2 via its C-terminal LRRL sequence, blocking the binding of the E2 ubiquitin conjugating enzymes. We tested mutants of Emi1 deficient in each of the two binding interactions and used MCF10A cells where addition of a CDK4/6 inhibitor can block APC/CCdh1 inactivation that normally occurs in most cells within 5 hours from mitosis (Fig. 3b and Extended Data Fig. 6c-e). We first confirmed that over-expression of Emi1WT potently inhibited APC/CCdh1 immediately after mitosis in the presence of the CDK4/6 inhibitor, showing that Emi1 can turn APC/CCdh1 “Off” on its own (Fig 3c and Extended Data Fig. 6f,g). We made a point mutation (Emi1C401S; Extended Data Fig. 6d) that was previously shown to disrupt the ZBR domain of Emi1 and thereby prevent Emi1C401S from inhibiting the binding of E2 enzymes to APC/CCdh1 11. Markedly, expressed Emi1C401S failed to inactivate APC/CCdh1 in this system (Fig. 3d and Extended Data Fig. 6f,h) and was instead degraded in the absence of CDK4/6 inhibitor in parallel with other APC/CCdh1 substrates (Extended Data Fig. 6j-k), arguing that an interaction of Emi1 with the substrate region alone can lead to Emi1 ubiquitination and degradation without inhibiting APC/CCdh1.
To determine whether interaction of Emi1 with only the region where the E2 enzymes bind is sufficient to inhibit APC/CCdh1, we mutated the APC/C degron motif in Emi1 to prevent its interaction with this substrate docking site (Emi1AxxA; Extended Data Fig. 6d). Expression of the Emi1AxxA mutant rescued the effects of CDK4/6 inhibition to control levels and almost as well as overexpressing Emi1WT (Fig. 3b,c,e and Extended Data Fig. 6l), arguing that Emi1 binding to the E2 enzyme interaction region can be sufficient to inhibit APC/CCdh1 without requiring the interaction with the substrate region. Independent interactions of Emi1 with the substrate and inhibitory regions of APC/CCdh1 are further supported by the previous finding that Emi1 and the APC/CCdh1 substrate Geminin can both bind to APC/CCdh1 at the same time as part of a ternary complex20. Together with the previous structural and biochemical results18–20, our data suggests that Emi1 is functioning independently as a substrate of APC/CCdh1 by binding to the substrate region but is also an inhibitor of APC/CCdh1 by binding to the E2 enzyme interaction region or at the same time to both regions (Fig. 3f).
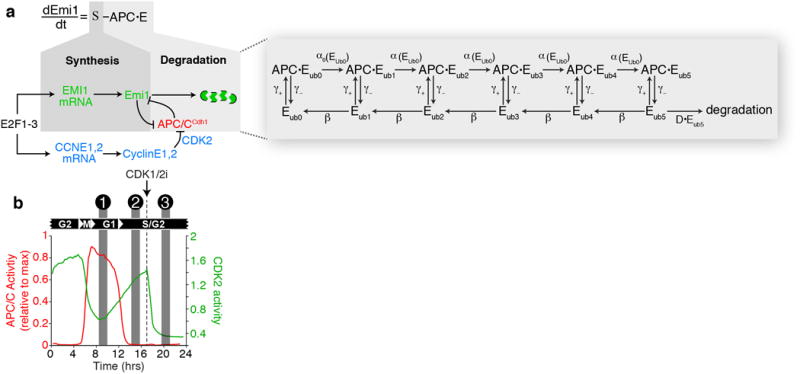
We developed a computational model to determine how an inhibitor of an E3-ligase that is also a substrate may generate a robust bistable switch (Extended Data Fig. 7a). In the model, Emi1 reversibly binds to a low affinity substrate binding site of APC/CCdh1 where it can be mono- and poly-ubiquitinated, in a non-processive manner. Emi1 also reversibly binds with higher affinity to the inhibitory site(s) to suppress poly-ubiquitination and subsequent degradation of substrates by inhibiting E2 enzyme binding and ubiquitin chain elongation20 (Fig. 3f). At low Emi1 concentrations, Emi1 and other substrates can be degraded as Emi1 levels are initially lower than APC/CCdh1 levels and the fraction of inhibited APC/CCdh1 is therefore insufficient to block overall APC/CCdh1 activity. As Emi1 levels increase, the increasing occupancy of the inhibitory site of APC/CCdh1 suppresses poly-ubiquitination of unbound Emi1 and other substrates. This system has the cooperativity required for a robust switch mechanism (Fig. 1a and Extended Data Fig. 3e) since multiple ubiquitins have to be added to enable substrate degradation21,22. The model includes a term for E2F-regulated synthesis of Emi1 mRNA after mitosis and also for a slow increase in CDK2 activity that partially inhibits APC/CCdh1 to initiate the switch mechanism which cells trigger at a threshold of ~70% APC/CCdh1 inhibition (Extended Data Fig. 1f,g).
A steady-state analysis of the model at constant Emi1 mRNA levels and CDK2 activity (Fig. 3g) shows the relationship between Emi1 levels and synthesis rate represents a bistable system with an APC/CCdh1 “On”, low Emi1 state (Fig. 3g, left panel), and an APC/CCdh1 “Off”, high Emi1 state (Fig. 3g, middle panel). Once the system reaches the “Off” state, APC/CCdh1 activity becomes independent of CDK2 activity (Fig. 3g, right panel), a prediction that closely matches the hysteresis characteristic we observed experimentally (Fig. 1b and Extended Data Fig. 7b).
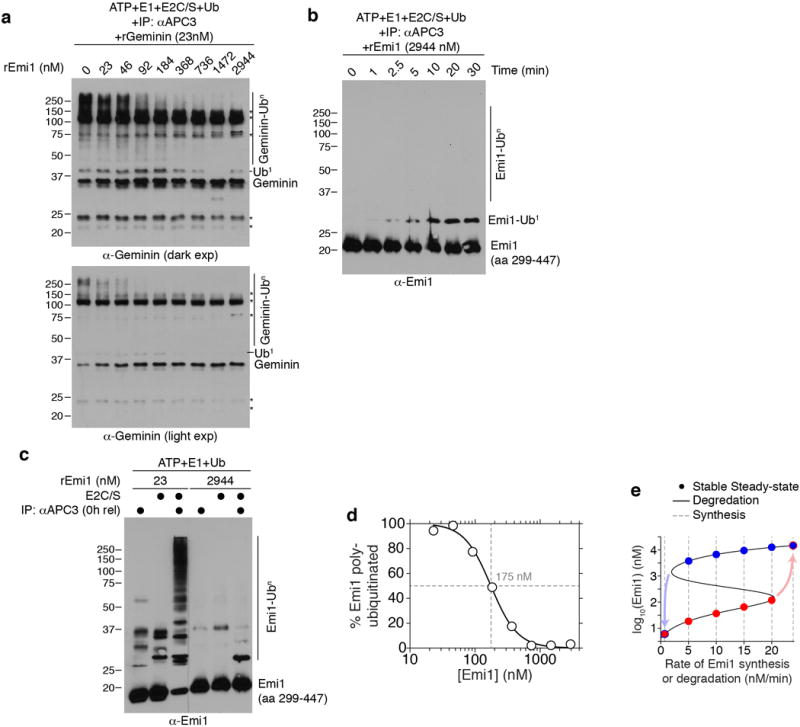
A second key prediction of the model is that at concentrations of Emi1 below APC/CCdh1, Emi1 should be efficiently ubiquitinated by APC/CCdh1, but at concentrations higher than APC/CCdh1, Emi1 should be poorly ubiquitinated. To test this prediction, we conducted in vitro ubiquitination assays with both low and high concentrations of Emi1. Emi1 was again efficiently poly-ubiquitinated when we added 23 nM of recombinant Emi1 to an in vitro ubiquitination assay, but poly-ubiquitination of Emi1 was completely inhibited at 2.9 μM Emi1, consistent with robust APC/CCdh1 inhibition (Fig. 4a). This is also true for other substrates as Geminin was poly-ubiquitinated by APC/CCdh1 in the presence of 23 nM Emi1 but Geminin poly-ubiquitination by APC/CCdh1 was completely inhibited when we added 2.9 μM Emi1 (Extended Data Fig. 8a). Emi1 added at the higher concentration could still be mono-ubiquitinated by APC/CCdh1 as was Geminin (Fig. 4b and Extended Data Fig. 8b), consistent with a previous observation that Emi1 may primarily inhibit ubiquitin chain elongation by interfering with Ube2S binding18,20. We also observed the same concentration-dependent ubiquitination of Emi1 when we used APC/CCdc20 in the in vitro ubiquitination assays, indicating that Emi1 is also a substrate of APC/CCdc20 (Extended Data Fig. 8c). Using densitometry of the ubiquitinated bands, we observed a nonlinear transition between being a substrate with 5 or more ubiquitins attached and an inhibitor (Extended Data Fig. 8d). Taken together, our data supports a model that Emi1 is a substrate of APC/CCdh1 when present at low concentrations and an inhibitor of APC/CCdh1 when it exceeds the concentration of APC/CCdh1 (Fig. 4c).
Figure 4. Cyclin E/CDK2 activity and Emi1 mRNA synthesis synergistically trigger the Emi1-APC/CCdh1 inactivation switch and cell cycle commitment.
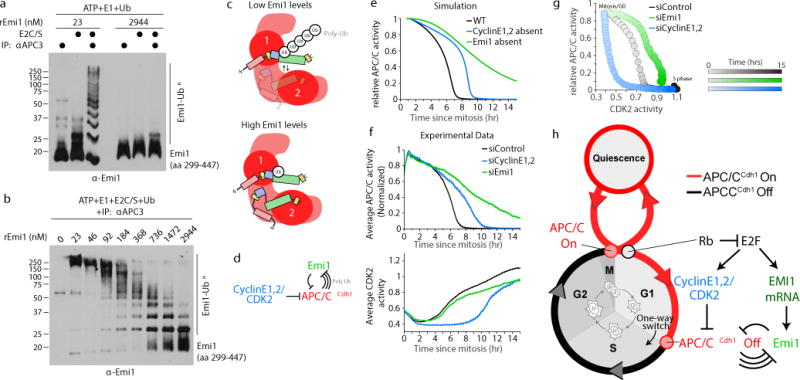
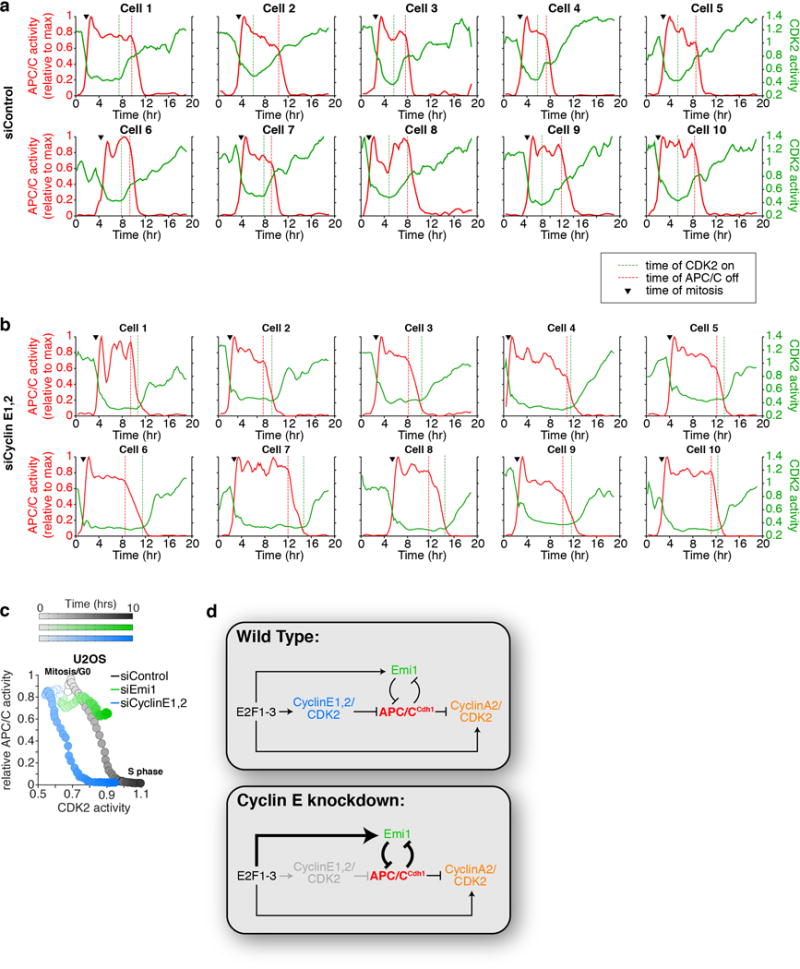
a, in vitro ubiquitination assay using immuno-purified APC/CCdh1 and recombinant Emi1. After the in vitro reaction, equal amounts of Emi1 were loaded onto the gel for western blotting. Image representative of n=2 independent experiments. b, same as (a) but using a range of concentrations of recombinant Emi1. Image representative of n=2 independent experiments. c, Schematic showing at low Emi1 concentrations, Emi1 can be poly-ubiquitinated but at high Emi1 concentrations, Emi1 inhibits E2 activity and chain elongation. d, Schematic diagram of a bistable switch involving Cyclin E1,2/CDK2 and a dual-negative feedback loop between APC/CCdh1 and Emi1. e, Simulated changes in APC/CCdh1 activity in G1 and S phase. f, HeLa cells treated with the indicated siRNA. APC/C and CDK2 activity were measured in the same cells, and traces were aligned to mitosis. Data is median activity trace +/− SEM. g, Phase-plane diagram of median CDK2 and APC/C activity measured simultaneously in the same HeLa cells. n=270 cells per condition. h, APC/CCdh1 inactivation at the G1/S transition is a one way-switch, triggered by CDK2 activity and made irreversible by a dual-negative feedback mechanism with Emi1.
Our model also predicted that cells should trigger bistable APC/CCdh1 inactivation even when Emi1 mRNA increases alone without an increase in CDK2 activity (Fig. 4d-e and Extended Data Fig. 8e). Indeed, we found that HeLa and U2OS cells treated with siRNA against both Cyclin E1 and E2 (see Extended Data Fig. 2e) both rapidly inactivate APC/CCdh1 after a delay, indicating that APC/CCdh1 can indeed be inactivated independently of CDK223 activity if Emi1 synthesis is constitutively active and Emi1 mRNA can reach high enough levels (Fig. 4f and Extended Data Fig. 9a-f). Thus, cells can bypass the requirement for G1 Cyclin E/CDK2 activity by upregulating Emi1 mRNA levels to inactivate APC/CCdh1, providing a redundant mechanism to start the cell cycle (Fig. 4g and Extended Data Fig. 10a-d). This alternative path to S phase is likely important in cancer cells that often have mis-regulated E2F, Rb, or upstream regulators that constitutively activate E2F24 (Extended Data Fig. 10d). Notably, we observed that knockdown of Emi1 in U2OS cells completely prevented APC/CCdh1 inactivation (Extended Data Fig. 3c and 10c), suggesting that Cyclin E/CDK2 activity alone does not reach sufficiently high levels in U2OS cells to inactivate APC/CCdh1 independent of Emi1. While CDK2 activity alone is capable of inactivating APC/CCdh1 in some but not all cell lines, the dual-negative feedback loop between Emi1 and APC/CCdh1 is required for rapid and irreversible APC/CCdh1 in every cell line tested, indicating it is likely a general feature of cell cycle entry control.
Together, our results provide a mechanistic model for mammalian cell cycle commitment. We previously demonstrated that the activation of Rb-E2F and Cyclin E/CDK2, which is thought to underlie the mammalian restriction point, remains reversible when cells are exposed to stress until APC/CCdh1 is inactivated several hours later3. Thus, cells pass through two sequential steps in cell cycle entry: Rb inactivation followed by APC/CCdh1 inactivation. Only after this second step can cells no longer return to quiescence. We now show that Emi1 mRNA and Cyclin E/CDK2 are synergistic triggers of a bistable switch mechanism that is driven by dual-negative feedback between Emi1 and APC/CCdh1. Figure 4h positions this Emi1-APC/CCdh1 inactivation switch within the overall cell cycle, showing that cells turn APC/CCdh1 “On” when they exit mitosis, keep APC/CCdh1 “On” during quiescence and G1, before the Emi1-APC/CCdh1 inactivation switch is triggered at the G1/S transition when cells irreversibly commit to the cell cycle.
Methods
Cell Culture
MCF10A cells were obtained from ATCC (CRL-10317) and were cultured in phenol red-free DMEM/F12 (Invitrogen) supplemented with 5% horse serum, 20,000 pg/mL EGF, 10 μg/mL insulin, 0.5 μg/mL hydrocortisone, 100 ng/mL cholera toxin, 50 U/mL penicillin, and 50 μg/mL streptomycin. HeLa (ATCC, CCL-2) and U2OS cells were cultured in DMEM (Invitrogen) plus 10% fetal bovine serum (FBS) and penicillin-streptomycin-glutamine (PSG). HeLa and U2OS cells were used because they both have constitutively active E2F-mediated transcription, which is necessary to test our hypothesis that Emi1 can inactivate APC/C interpedently of CDK2 activity. Where indicated, cells were treated with the small molecule inhibitors CDK1/2i III (3 μM, EMD Biosciences #217714), CDK4/6i (1 μM, PD-0332991), MG132 (10μM), proTAME (30 μM, Boston Biochem).
Synchronization
HeLa cells were treated with 2 mM thymidine for 24 hours, washed, and allowed to grow in regular growth media for 3 hours. Cells were then treated with 100 ng/mL nocodazole for 9-12 hours. Cells synchronized in mitosis were then isolated by mitotic shake-off and re-plated after washing with regular growth media.
Constructs
CSII-pEF-H2B-mTurquoise and CSII-pEF-DHB(aa994-1087)-mVenus were described previously23. CSII-pEF-Geminin(aa1-110)-mCherry was described previously3. Emi1 fused to mCitrine was cloned into the CSII-pEF lentiviral vector. Emi1 C355S mutation was made in the CSII-pEF-Emi1-mCitrine construct using the Gibson assembly method with the mutation encoded in the primers. Coding sequences for human His-Emi1aa299-447 was cloned into pET28 for purification from E. coli. Transduced cells were sorted on a Becton Dickinson Influx to obtain pure populations expressing the desired fluorescent reporters.
Time-Lapse Microscopy and Image Analysis
Cells were plated at least 24 hr prior to imaging in full growth media in a 96-well dish (Costar #3904) such that the density would remain sub-confluent until the end of the imaging period. Time-lapse imaging was performed in 290 μL full growth media. Images were taken in CFP, YFP, and RFP channels every 12 min on an IXMicro microscope (Molecular Devices) with a 10× objective, 0.3 NA. Total light exposure time was kept under 600 msec for each time point. Cells were imaged in a humidified, 37°C chamber in 5% CO2. Image processing, cell tracking, and APC/C activity quantification was done using custom Matlab scripts described previously3.
Immunofluorescence
Cells were fixed in 4% paraformaldehyde, washed three times in PBS, permeabilized with 0.2% triton, and stained overnight at 4°C with anti-Skp2 (Cell Signaling Technology, #4358), anti-Geminin (Sigma-Aldrich, HPA049977), anti-Emi1 (Invitrogen, 37-6600), anti-Cyclin E1 (Santa Cruz Biotechnology, sc-247), or anti-Cyclin F (Santa Cruz Biotechnology, sc-952). Cells stained with anti-Cyclin E1 were treated with ice cold 100% methanol for 5 min after initially fixing with 4% paraformaldehyde. Primary antibodies were visualized using a secondary antibody conjugated to Alexa Fluor-647 and imaged with a Far Red filter. Where indicated, cells were treated with 10μM EdU for 15 min unless otherwise specified and fixed and processed according to manufacturer’s instructions (Invitrogen, #C10356).
RNA FISH
RNA in situ hybridization was carried out using the Affymetrix Quantigene ViewRNA ISH cell assay kit and mRNA quantification was carried out using custom Matlab scripts as described previously3. Probes were custom designed (Affymetrix) to target Emi1, Geminin, Cyclin E1 or E2F1. After FISH staining, cells were blocked in PBS containing 10% FBS, 1% BSA, 0.1% TX-100, and 0.01% NaN3 for 1 hour at room temperature, and then stained overnight with antibodies for immunofluorescence.
Live-cell imaging combined with fixed-cell analysis
To generate time course measurements of mRNA, protein, and EdU levels we combined live-cell imaging and fixed cell analysis. HeLa cells were used to simplify the analysis since HeLa cells do not enter quiescence after mitosis. We tracked unsynchronized cells using H2B-mTurquoise and imaged them for approximately 20 hours. At the end of the live-cell imaging, cells were grown in 10μM EdU for 15minutes. The time since the previous anaphase before fixing was recorded for each individual cell. The cells were then stained for mRNA using RNA FISH (see above), protein using immunofluorescence, and EdU and imaged on the same microscope used for the live-cell imaging. Custom MATLAB scripts were used to re-align the fixed cell image with the last frame of the time-lapse imaging and then quantify the mRNA, protein, and EdU levels for each cell. Thus for each cell the time since anaphase, mRNA, protein, and EdU levels was recorded. Cells were binned in 1 hour intervals and the median value of each bin was calculated and plotted on an axis. Lines were normalized by the mRNA values at the onset of S phase (as measured by EdU incorporation), which was 6 hours after anaphase or to the maximum protein levels.
siRNA transfection
MCF10A and HeLa cells were transfected using Dharmafect 1 (Thermo Scientific) according to the manufacturer’s instructions and U2OS cells were transfected with Lipofecatime RNAiMAX (Thermo Fisher Sceintific) according to the manufacturer’s instructions. The following siRNAs were used: control siRNA (nontargeting #2, Dharmacon), siGenome pooled set of four siRNAs for cyclin A2, siGenome pooled set of four siRNAs for Skp2, siGenome pooled set of four siRNAs for cyclin F, siGenome pooled set of four for Emi1, siGenome pooled set of four for Fzr1 (Cdh1), siGenome pooled set of eight for cyclin E1 and E2 (Dharmacon) at final concentrations of 20nM unless noted. Six hours post-transfection, cells were washed with full growth medium and then imaging was immediately started. Cells were only considered if they went through one mitosis within the imaging period. This method works efficiently since all the genes targeted in this study are known to be degraded during or prior to the onset of mitosis. Thus, the siRNA would prevent subsequent accumulation in the next cell cycle.
In vitro ubiquitination Assay
Human APC/C was purified from extracts of prometaphase or G1 HeLa cells16. For G1 extracts, prometaphase cells were washed twice in PBS and released from nocodazole-arrest for 2 hours in drug-free media. His-Emi1aa299-447 was purified as previously described16,25. We used the C-terminal domain of Emi1which contains all of the APC/C-interacting domains (amino acids 299-447) and is commonly used for in vitro ubiquitination assays involving APC/C18,20. In an 8-μl reaction volume, 0.5 μl of 10 μM E1 (625 nM final), 1 μl of 10 μM UBE2C (1.25 μM final), 1 μl of 10 μM UBE2S (1.25 μM final), 1 μl of 10 mg/ml ubiquitin (1.25 mg/ml final), 1 μl of 8× ubiquitylation assay buffer (250 mM Tris 7.5, 500 mM NaCl, and 100 mM MgCl2), 1 μl of 100 mM DTT, 1.5 μl of energy mix (150 mM creatine phosphate, 20 mM ATP, 20 mM MgCl2, 2 mM EGTA, pH to 7.5 with KOH), and 1 μl of recombinant human EMI1 or Geminin (ab86447, Abcam) was mixed with 5 μl of APC/C resin. Reactions were carried out at 30°C for 1 hour unless otherwise indicated and shaking at 1,000 RPM. Reactions were stopped by the addition of SDS sample loading buffer, resolved on a 12% SDS-acrylamide gel. For experiments comparing in vitro reactions using different concentrations of Emi1 on the same gel (Fig. 4a,b and Extended Data Fig. 8a,c), equal amounts of Emi1 were loaded onto the gel to allow for direct comparisons of band intensity using a single exposure.
Immunoblotting
Cells were plated in equal number on 6cm dishes. At the time of harvesting, cells were washed in ice cold PBS. Protein extracts were produced by lysing cells directly in boiling 1× sample buffer and resolved by 4-20% gradient SDS-PAGE. Samples were subjected to immunoblotting with Emi1 antibodies (Fig. 2a,b and Extended Data Fig. 4c: 3D2D6, Invitrogen or Fig 2e, 4a,b, Extended Data Fig. 5h,j and 8a-c: #38-5000, Zymed) at 1:1000, cyclin A2 antibodies (sc-751, Santa Cruz Biotechnology) at 1:500, Geminin antibodies (FL-209, Santa Cruz Biotechnology), and GAPDH antibodies (D16H11, Cell Signaling Technology) at 1:1000. Immunoreactive species were visualized by chemiluminescent detection of horseradish peroxidase-conjugated secondary antibodies (7074 or 7076, Cell Signaling Technology).
APC/C-Emi1 modeling
Model calculation of the dual Emi1-APC/CCdh1 substrate and inhibitor switch were performed using a MATLAB program using the ODE45 solver for ordinary differential equations. The model calculates changes of the concentrations of non-ubiquitinated Emi1 and of Emi1 species with 1 to 5 ubiquitins conjugated. The model uses the following parameters and assumptions: First, since at least 4 ubiquitins have to be conjugated to a substrate for its effective degradation22, and since substrates with 5 or more ubiquitins are more effectively degraded, we made a simplifying assumption that all Emi1 species that have more than 5 conjugated ubiquitins are degraded in cells. We did not distinguish possible rate variations if more than one mono-ubiquitins might be added or if different chains might be elongated in Emi1. Second, we made the simplifying assumption that only unbound Emi1 is ubiquitinated and that ubiquitinated Emi1 does not bind to the inhibitory site. This leads to a slower mono-ubiquitination of Emi126 since most Emi1 is bound to APC/CCdh1 in G1. Third, inhibition of APC/CCdh1 by Emi1 is modeled by using as APC/CCdh1 activity the concentration of APC/CCdh1 without bound inhibitory Emi1 (Total APC/CCdh1 concentration was assumed to be 500 nM, the affinity of the Emi1- APC/CCdh1 inhibitory binding interaction was assumed to be 5 nM and the maximal synthesis of Emi1 from Emi1 mRNA was assumed to be 10 nM/min. The latter rate increases with a time constant of 500 min from 0 nM/min). Fourth, based on our in vitro results, we included in our model that ubiquitination of Emi1 is not processive, assuming faster binding and dissociation of Emi1 substrates (γ+ and γ− terms) compared to ubiquitin chain elongation of the bound Emi1 substrate. When simulated, this model recapitulates the fast inactivation of APC/C that we observed in cells (< 1 hour) when we selected an overall rate at which the chain of ubiquitinated Emi1 is elongated as 3.7/min (binding plus elongation) and a term, β, the rate at which individual ubiquitins are removed from poly-ubiquitinated Emi1, is selected to be 2/min (most relevant for the model is the ratio of the two parameters). Finally, we modeled inhibition by CDK2 as a normalized factor, r, that is 1 at the start and inactivates APC/CCdh1 using a time constant of 600 min and cooperativity of 3. The Matlab models that run the simulations are publically available on Github (see code availability).
Code availability
The code for the image analysis pipeline is available at https://github.com/scappell/Cell_tracking. The code for the model of APC/CCdh1 inactivation is available at https://github.com/scappell/APC_model. Additional modified scripts can be accessed upon request.
Data availability
Source Data are available from the corresponding authors upon reasonable request.
Extended Data
Extended Data Figure 1. Single-cell APC/CCdh1 data used to determine hysteresis curves.
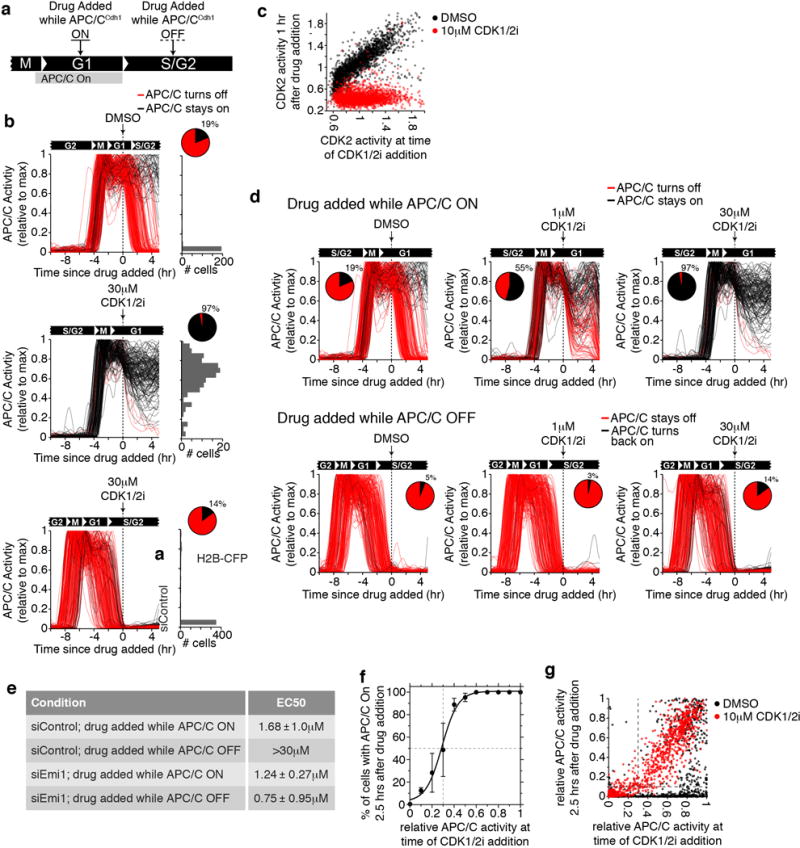
a, Experimental setup for Fig. 1b,d. and Extended Data Fig. 1b. Asynchronous MCF10A cells were tracked and imaged for approximately 18 hours and then treated with either DMSO or the indicated concentration of CDK1/2 inhibitor. Two subpopulations were analyzed: cells in G1 phase (drug added while APC/CCdh1 On) or cells in S/G2 phase (Drug added while APC/CCdh1 Off). b, Single-cell traces of APC/C activity in MCF10A cells treated with DMSO or 30 μM CDK1/2 either in G1 phase (top and middle) or S phase (bottom). Traces were colored red if APC/CCdh1 ended up inactive and traces were colored black if APC/CCdh1 ended up active 5 hours after addition of the drug. (n=200, 135, and 197 cells). Right: histogram of APC/C activity at the last frame of the movie for each cell. Inset: Pie chart of the percent of cells with APC/C still active at the end of the movie. c, Scatter plot of CDK2 activity at the time of drug spike plotted against the CDK2 activity from the same cell 1 hour later. Cells at all phases of the cell cycle were included. d, Top: representative APC/C activity traces for MCF10A cells in G1 phase at time of the indicated treatment. Bottom: representative APC/C activity traces for MCF10A cells in S/G2 phase at time of the indicated treatment. Traces were colored red if APC/CCdh1 was inactive and traces were colored black if APC/CCdh1 was still active 5 hours after addition of the drug. Pie chart shows the percent of cells with APC/CCdh1 still active, which was used to make the dose-response curve in Fig. 1b. e, Table of the EC50 for the dose response curves in Fig. 1b,d +/− SEM. n=3 independent experiments. Note: doses above 30 μM CDK1/2 inhibitor killed the cells making it impossible to calculate an EC50 above 30 μM. f, MCF10A Cells were treated with 10 μM CDK1/2 inhibitor and binned by the APC/CCdh1 activity at the time of drug addition. The percent of cells in each bin with APC/CCdh1 activity on 2.5 hours after drug addition was calculated. Data were analyzed by nonlinear regression (sigmoidal dose-response, variable slope). Error bars are standard deviation. from 2 independent experiments. g, Scatter plot of APC/C activity at the time of drug spike plotted against the APC/C activity from the same cell 2.5 hours later. Vertical dashed line represents the 70% inactive threshold. Horizontal line indicates when APC/C activity is below 0.1 and considered to be “Off”.
Extended Data Figure 2. siRNA validation experiments.
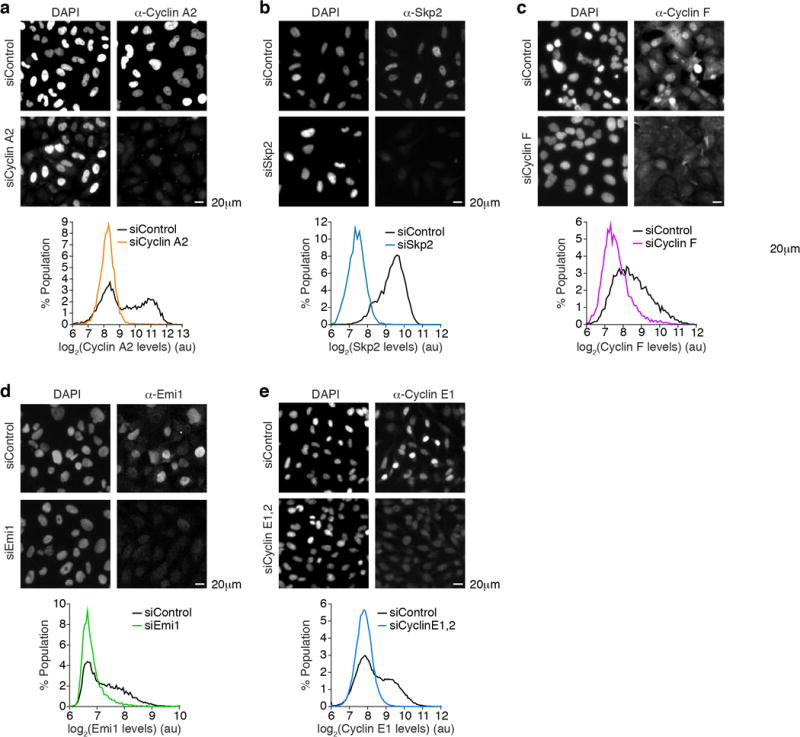
HeLa (a,b,e) or U2OS (c,d) cells were treated with the indicated siRNA for 24 hrs prior to fixation and immunostaining. Scale bar is 20 μm. Single-cell quantification of immunofluorescence data was used to generate the histograms. a, n=7,152 cells for siControl and n=4,051 cells for siCyclin A2. b, n=7,772 cells for siControl and n=3,916 cells for siSkp2. c, n=7,003 cells for siControl and n=8,589 cells for siCyclin F. d, n=9,393 cells for siControl and n=7,871 cells for siEmi1. e, n=64,574 cells for siControl and n=53,338 cells for siCyclin E1,2.
Extended Data Figure 3. Emi1 is responsible for rapid APC/CCdh1 inactivation in multiple cell lines.
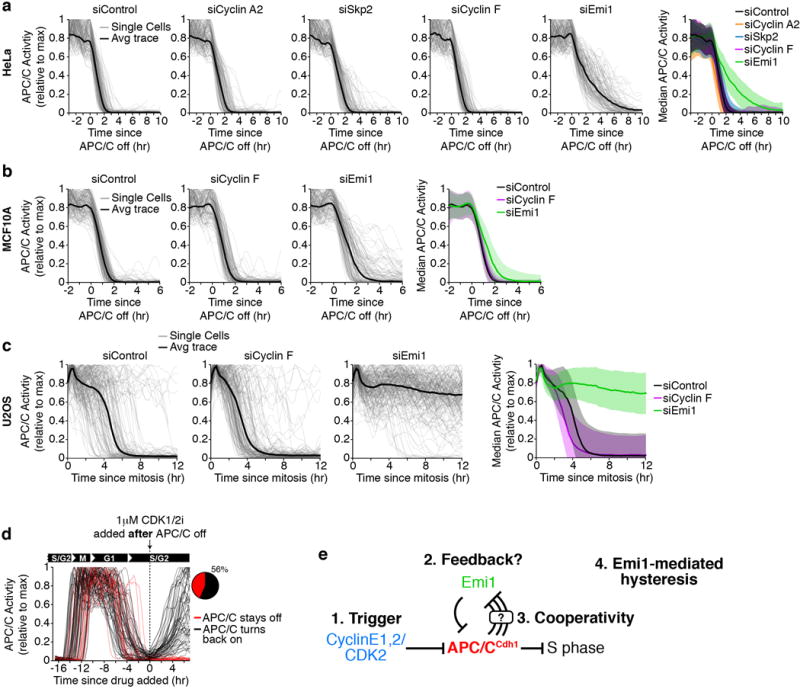
a,b, Single-cell traces of APC/C activity computationally aligned to when APC/CCdh1 first starts to inactivate in cells treated with the indicated siRNA 6 hours prior to the start of imaging. Black line is median APC/C activity trace. Right: Median APC/C activity trace ± SD. HeLa cells, n=129/602, 126/384, 124/399, 120/228, 138/400 cells per condition respectively (representative traces plotted/all traces used to calculate median) (a), MCF10A cells, n=139/400, 130/400, 134/400 cells per condition respectively (b). c, Single-cell traces of APC/C activity computationally aligned to mitosis in U2OS cells treated with the indicated siRNA 6 hours prior to the start of imaging. Black line is median APC/C activity trace. Traces in U2OS cells had to be aligned by mitosis since APC/CCdh1 did not inactivate when cells were treated with siRNA targeting Emi1. n=200 representative cells per condition out of a total of 2068, 1531, 875 cells respectively. d, Single-cell traces of APC/C activity in MCF10A cells treated Emi1 siRNA. At the indicated time in S phase, 1 μM CDK1/2 inhibitor was spiked in. Traces were colored red if APC/CCdh1 stayed inactive and traces were colored black if APC/CCdh1 turned back on 5 hours after addition of the drug. n=80. Inset: Pie chart of the percent of cells that turned APC/C back on at the end of the movie. e, Schematic diagram of a proposed bistable switch involving Cyclin E1,2/CDK2, APC/C, and Emi1.
Extended Data Figure 4. Measuring protein and mRNA dynamics from fixed cells.
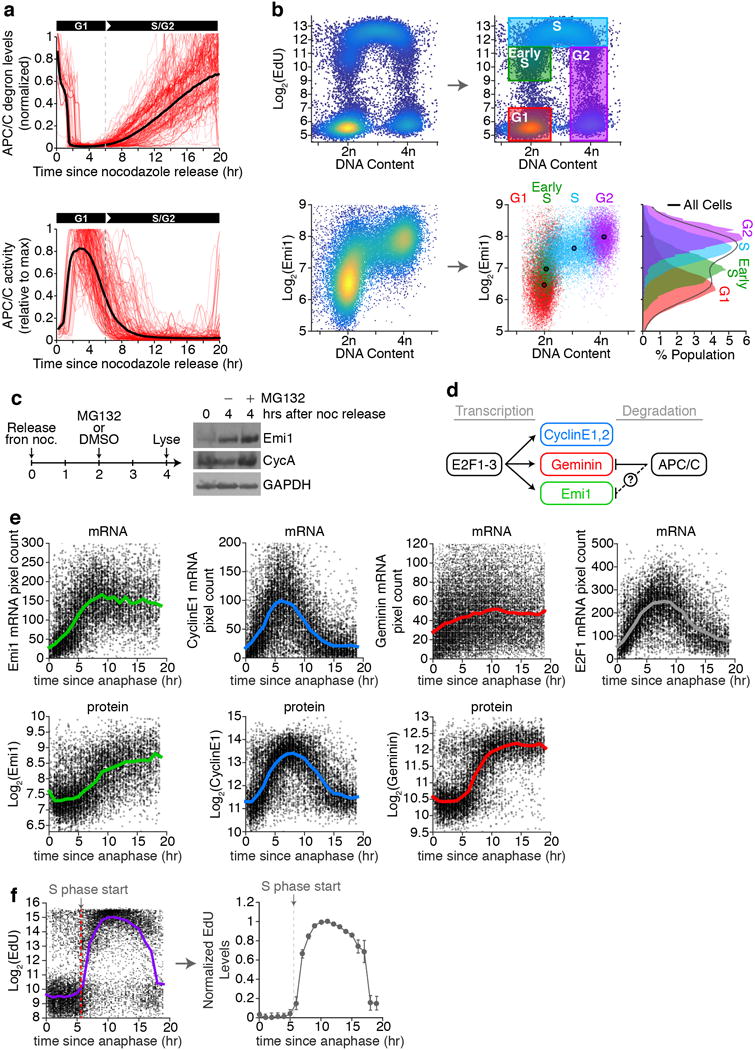
a, HeLa cells were synchronized with thymidine followed by nocodazole and mitotic shake-off (see Fig. 2a). After shake-off, cells were immediately plated in a 96-well plate for live-cell imaging. Top: single-cell traces of APC/C-degron levels. Black line is the median APC/C-degron level. Bottom: single-cell APC/C activity traces. Dashed-line indicates time when APC/CCdh1 first starts to inactivate. n=200 representative cells out of a total of 3190 cells used to calculate the median. b, Asynchronous HeLa cells were exposed to 10 μM EdU for 15 minutes, fixed, and then stained for both Emi1 and EdU incorporation. Top: density scatter plot of DNA content vs EdU levels, used to gate cells into specific cell cycle phases. (e.g. G1 cells have 2n DNA and low EdU, S phase cells have greater than 2n DNA and high EdU, etc). Cells were designated as Early S phase if they had 2n DNA and sub-maximal EdU, indicating they were in S phase for less than 15 minutes at the time of fixation. Bottom: density scatter plot of DNA content vs Emi1 levels. Since we measured EdU and Emi1 in the exact same cells, cell cycle phase gates were applied to the Emi1 scatter plot. Each cell was colored based on the cell cycle phase that cell was in. Large dot with black boarder marks the median values for each gated population. The single-component histograms for Emi1 levels in each cell cycle phase are shown on the right. c, HeLa Cells were treated as in Fig. 2a, but 2 hours after release, cells were treated with either DMSO or 10 μM MG132. Lysates were collected 2 hours later for a total of 4 hours after release. Image is representative of n=3 independent experiments. d, Schematic diagram of the regulation of 3 key G1 and S phase genes, Geminin, Emi1, and Cyclin E1 and E2, by both transcription and ubiquitination-mediated degradation. e, HeLa cells were imaged and tracked for 20 hrs, and the time each cell went through anaphase relative to the end of the movie was recorded. Cells were then fixed and stained with single molecule mRNA FISH probes for the indicated genes (top), or with antibodies against the indicated proteins (bottom). Data are a scatter plot of the single-cell mRNA or protein levels as a function as the time relative to mitosis. Solid line represents the median levels from 1 hour bins. n=2 independent experiments. f, cells treated as in (e), but prior to fixation cells were incubated with 100 μM EdU for 5 min. Dashed line indicates the first bin when EdU incorporation goes above background, indicating cells have entered S phase. Data is from one representative experiment Right: Single-cell data was binned in 1 hour intervals and the median +/− S.E.M. was plotted. n=6 replicates.
Extended Data Figure 5. Emi1 accumulates coincident with APCCdh1 inactivation.
a-c, Normalized mRNA and protein levels for the indicated genes. Data from mRNA and protein are plotted on the same x-axis to allow comparison of the kinetics. S phase start determined by EdU incorporation (see Extended Data Fig. 4e). Data is median value for each bin. n=2 independent experiments. d, Density scatter plot of Emi1 protein levels and Geminin protein levels measured in the same single cells. Single-component histograms shown as insets. e, Density scatter plot of Cyclin E1 protein levels and Geminin protein levels measured in the same single cells. Single-component histograms shown as insets. f, HeLa cells were treated with either control siRNA (black line) or Cdh1 siRNA (colored line) and then imaged and tracked for 20 hrs. The time each cell went through anaphase relative to the end of the movie was recorded. Cells were then fixed and immunofluorescence was performed with antibodies to the indicated proteins. The time to reach half-maximal is indicated with a dashed line (t1/2). Data are median values +/− S.E.M and best fit line was calculated using nonlinear regression. Data was normalized to maximum value. n=8 independent experiments. g, Bar graph of the difference in t1/2 times in cells treated with Control siRNA and Cdh1 siRNA from (j). Individual data points are shown as dots. Error bars are S.E.M. p values from one-way ANOVA with Tukey multiple comparisons test. n=8 independent experiments. h,i, in vitro ubiquitination time-course using immuno-purified APC/C and either recombinant Emi1 (h) or Geminin (i). Lower panel is a lighter exposure showing the un-modified substrate. n=1 experiment. j, in vitro ubiquitination assay using immuno-purified APC/CCdh1, recombinant Emi1, and the indicated ubiquitin mutant. E2C/S, E2 enzymes Ube2C and Ube2S. n=1 experiment.
Extended Data Figure 6. Emi1 and Geminin protein levels are tightly correlated during the cell cycle.
a, Model diagram of APC/CCdh1 architecture. For simplification, the substrate binding region comprised primarily of Cdh1 and APC10 is designated as site 1, and the E2 ubiquitin conjugating enzymes Ubch10 and Ube2s are designated as site 2. c-d, Regulation of APC/C by two Emi1 mutants. Substrates are recruited to APC/C through a substrate binding region (site 1). Ubiquitin is transferred to the substrate by UBCH10 and UBE2S (site 2). Sub, substrate; Ub, ubiquitin. e, Signaling diagram of the G1 cell-cycle program. Shows inhibiting CDK4/6 activity with a small molecule inhibitor will prevent APC/CCdh1 inactivation. f, MCF10A cells expressing either empty vector or various Emi1 variants were treated with DMSO. Single-cell APC/C activity traces were computationally aligned to the time of mitosis. DMSO treatment administered before mitosis as indicated by arrow. N=120 cells for each condition. g, Median levels of APC/C degron (red) or wild-type Emi1 (Emi1WT; green) stably expressed in the same MCF10A cells. n=330 cells. h, Median expression levels of ectopically expressed Emi1 mutants tagged with mCitrine. Measurments for each single-cell were the maximum fluorescence detected during each cell cycle. Single-cell data was then averaged for each replicate. Individual data points are shown as dots. Data are median values +/− S.D. n=3 independent experiments. i, Left: median APC/C degron levels measured over 24 hours in MCF10A cells. Arrows indicate mitosis (mit). n=88,125 cells. Right: median levels of APC/C degron (red) or Emi1C401S (green) stably expressed in the same cells. n=3,618 cells. Inset diagram shows that Emi1C401S is a substrate of APC/CCdh1 and not an inhibitor. j, Single-cell traces of APC/C degron (red) or Emi1C401S (green) levels in MCF10A cells. Six representative cells from (i) are shown. k, Density scatter plot of APC/C degron levels versus Emi1C401S levels measured in the same cells. l, Percent of cells from Fig. 3b-e that inactivated their APC/CCdh1 at least 5 hours after mitosis. n=3 biological repeats. Individual data points are shown as dots. Error bars are S.D.
Extended Data Figure 7. Mathematical model for an APC/C-Emi1 dual negative feedback loop.
a, Differential equation of the regulation of Emi1 protein concentration. Constant synthesis (S) is assumed for the steady state model. The model includes reversible low affinity binding of Emi1 to the substrate binding site (γ+/−) and inhibitory binding that blocks ubiquitin chain elongation, but not mono-ubiquitination. Emi1 ubiquitination is assumed to be distributive, requiring 5 ubiquitin elongations to become fully ubiquitinated for effective degradation. APC/CCdh1 activity is inhibited by CDK2 activity or by Emi1 binding to the inhibitory site, allowing Emi1 to be subsequently de-ubiquitinated and stabilized. b, A single-cell APC/C activity and CDK2 activity trace. Each steady-state from Fig. 3g is marked. At the indicated time 3 μM CDK1/2 inhibitor was added, but APC/C activity remains off, as predicted in Fig. 3g.
Extended Data Figure 8. Emi1 is an APC/C substrate at low concentrations but an inhibitor of ubiquitin chain elongation at high concentrations.
a, in vitro ubiquitination reaction of recombinant Geminin using immuno-purified APC/C and a range of concentrations of recombinant Emi1. Non-specific bands are marked with (*). n=1 experiment. b, in vitro ubiquitination time-course using immuno-purified APC/C and 2944 nM recombinant Emi1. Only mono-ubiquitinated Emi1 was observed after 30 minutes. n=1 experiment. c, in vitro ubiquitination assay using immuno-purified APC/CCdc20 from cells arrested in mitosis and either 23 nM or 2944 nM recombinant Emi1. After the in vitro reaction, equal amounts of Emi1 were loaded onto the gel for western blotting. n=1 experiment. d, Quantification of fully-ubiquitinated Emi1 from Fig. 4b using densitometry. Data is plotted as the percent of total Emi1. Best-fit line was determined using the Hill equation. Dashed lines indicate an EC50 of ~175 nM. e, Steady-state analysis of Emi1 levels as a function of the degradation and synthesis rate. Assuming constant Emi1 synthesis (dashed lines), there are two stable steady states (red and blue dots). The system can transition to a mono-stable state with APC/C “Off” and high Emi1 levels by increasing the Emi1 synthesis rate above a threshold level (red arrow). Conversely, the system can transition to a different mono-stable state with APC/C “On” and low Emi1 levels by decreasing the Emi1 synthesis rate (blue arrow). This system also exhibits hysteresis, since the occupied steady-state depends on the previously occupied state (red dots vs blue dots).
Extended Data Figure 9. Cyclin E is dispensable for APC/CCdh1 inactivation in cells with constitutive active E2F.
a,b, Single-cell traces of APC/C activity computationally aligned to mitosis in either HeLa (n=200 cells per condition out of a total of 1284, 434, 462 cells respectively used to calculate the median and standard deviation) (a) or U2OS (n=200 cells per condition out of a total of 551, 300, 271 cells respectively used to calculate the median and standard deviation) (b) cells treated with the indicated siRNA 6 hours prior to the start of imaging. Black line is median APC/C activity trace. Bottom: Median APC/C activity trace ± SD. c, U2OS cells were treated with either Control, Cyclin E1 and E2, or Emi1 siRNA for 4 hours prior to the start of time-lapse imaging. APC/C and CDK2 activity were measured in the same cells, and traces were aligned to mitosis. Data is median activity trace +/− SEM. n=200 cells. d, Time between anaphase and when relative APC/C activity reaches below 0.2 was calculated for each cell from Fig. 4f. Times from all cells were averaged for each replicate. Individual data points are shown as dots. Data are median times +/− S.E.M. p values from one-way ANOVA with Tukey multiple comparisons test. n=3 independent experiments. e, Single-cell APC/CCdh1 inactivation slope at the G1/S transition for each cell from Fig. 4f. Slopes from all cells were averaged for each replicate. Data are median APC/CCdh1 inactivation slopes +/− S.E.M. p values from one-way ANOVA with Tukey multiple comparisons test. Individual data points are shown as dots. n=3 independent experiments. f, Histogram of the time between CDK2 activation and APC/CCdh1 inactivation in HeLa cells treated with the indicated siRNA. Values above zero indicate CDK2 turns On before APC/CCdh1 turns Off, and values below zero indicate APC/CCdh1 turns Off before CDK2 turns On.
Extended Data Figure 10. APC/CCdh1 inactivates prior to CDK2 activation in cells with Cyclin E1,2 knocked down.
a,b, Single-cell traces of APC/C (red) and CDK2 (green) activity in HeLa cells treated with either control siRNA (a) or cyclin E1 and E2 siRNA (b). Ten representative cells are shown for each condition. Black arrow, time of mitosis; green dashed line, time CDK2 activity first starts to rise; red dashed line, time APC/C activity first starts to inactivate. c, Phase-plane diagram of median CDK2 and APC/C activity measured simultaneously in the same U2OS cells over time, starting in Mitosis or G0 phase and progressing to S phase. n=270 cells per condition. d, Scheme of the regulation of APC/CCdh1 inactivation in the presence (Wild-type) or absence of Cyclin E. Cells can bypass the requirement for Cyclin E1,2/CDK2 in G1 phase by upregulating Emi1 mRNA. HeLa and USO2 cells bypass Cyclin E1,2/CDK2 by having constitutively active E2F1-3.
Supplementary Material
Acknowledgments
We thank M. Chung, C. Liu, A. Hayer, H.W. Yang, L. Daigh, Y. Fan, A. Jaimovich, M. Köberlin, S. Spencer, S. Collins, N. Ratnayeke, J. Kamenz, and J. Ferrell for helpful discussions and the Stanford Shared FACS Facility for cell sorting. S.D.C. was supported by the Damon Runyon Cancer Research Foundation (DRG-2141) and by the Intramural Research Program of the National Institutes of Health, Center for Cancer Research, National Cancer Institute. K.G.M., D.G., and L.R.P. were supported by NIH F32 Ruth L. Kirschstein fellowships (GM120956, GM116328 and GM125246 respectively). M.R. is supported by NIGMS R01 grants (GM083064) and is an Investigator of the Howard Hughes Medical Institute. T.M. is supported by NIGMS R01 grants (GM118377 and GM063702).
Footnotes
Contributions
S.D.C designed and carried out most experiments. K.G.M performed in vitro ubiquitination assays. D.G. performed synchronization and western blot experiments. L.R.P. made lentivirus and stable cell lines. M.R. supervised the in vitro ubiquitination studies. S.D.C and T.M. conceived the project, analyzed the data, and wrote the manuscript. All authors discussed the results and the manuscript. T.M. supervised the study.
Competing financial interests
M.R. is a co-founder and consultant to Nurix, a biotech company in the ubiquitin space.
References
- 1.Arora M, Moser J, Phadke H, Basha AA, Spencer SL. Endogenous Replication Stress in Mother Cells Leads to Quiescence of Daughter Cells. Cell reports. 2017;19:1351–1364. doi: 10.1016/j.celrep.2017.04.055. [DOI] [PMC free article] [PubMed] [Google Scholar]
- 2.Barr AR, et al. DNA damage during S-phase mediates the proliferation-quiescence decision in the subsequent G1 via p21 expression. Nature communications. 2017;8:14728. doi: 10.1038/ncomms14728. [DOI] [PMC free article] [PubMed] [Google Scholar]
- 3.Cappell SD, Chung M, Jaimovich A, Spencer SL, Meyer T. Irreversible APC (Cdh1) Inactivation Underlies the Point of No Return for Cell-Cycle Entry. Cell. 2016;166:167–180. doi: 10.1016/j.cell.2016.05.077. [DOI] [PMC free article] [PubMed] [Google Scholar]
- 4.Yang HW, Chung M, Kudo T, Meyer T. Competing memories of mitogen and p53 signalling control cell-cycle entry. Nature. 2017;549:404–408. doi: 10.1038/nature23880. [DOI] [PMC free article] [PubMed] [Google Scholar]
- 5.Hsu JY, Reimann JD, Sorensen CS, Lukas J, Jackson PK. E2F-dependent accumulation of hEmi1 regulates S phase entry by inhibiting APC(Cdh1) Nat Cell Biol. 2002;4:358–366. doi: 10.1038/ncb785. [DOI] [PubMed] [Google Scholar]
- 6.Ferrell JE., Jr Bistability, bifurcations, and Waddington’s epigenetic landscape. Curr Biol. 2012;22:R458–466. doi: 10.1016/j.cub.2012.03.045. [DOI] [PMC free article] [PubMed] [Google Scholar]
- 7.Choudhury R, et al. APC/C and SCF(cyclin F) Constitute a Reciprocal Feedback Circuit Controlling S-Phase Entry. Cell reports. 2016;16:3359–3372. doi: 10.1016/j.celrep.2016.08.058. [DOI] [PMC free article] [PubMed] [Google Scholar]
- 8.Fukushima H, et al. SCF-mediated Cdh1 degradation defines a negative feedback system that coordinates cell-cycle progression. Cell reports. 2013;4:803–816. doi: 10.1016/j.celrep.2013.07.031. [DOI] [PMC free article] [PubMed] [Google Scholar]
- 9.Lukas C, et al. Accumulation of cyclin B1 requires E2F and cyclin-A-dependent rearrangement of the anaphase-promoting complex. Nature. 1999;401:815–818. doi: 10.1038/44611. [DOI] [PubMed] [Google Scholar]
- 10.Huang X, et al. Deubiquitinase USP37 is activated by CDK2 to antagonize APC(CDH1) and promote S phase entry. Mol Cell. 2011;42:511–523. doi: 10.1016/j.molcel.2011.03.027. [DOI] [PubMed] [Google Scholar]
- 11.Miller JJ, et al. Emi1 stably binds and inhibits the anaphase-promoting complex/cyclosome as a pseudosubstrate inhibitor. Genes Dev. 2006;20:2410–2420. doi: 10.1101/gad.1454006. [DOI] [PMC free article] [PubMed] [Google Scholar]
- 12.Margottin-Goguet F, et al. Prophase destruction of Emi1 by the SCF(betaTrCP/Slimb) ubiquitin ligase activates the anaphase promoting complex to allow progression beyond prometaphase. Dev Cell. 2003;4:813–826. doi: 10.1016/s1534-5807(03)00153-9. [DOI] [PubMed] [Google Scholar]
- 13.Lindon C, Pines J. Ordered proteolysis in anaphase inactivates Plk1 to contribute to proper mitotic exit in human cells. J Cell Biol. 2004;164:233–241. doi: 10.1083/jcb.200309035. [DOI] [PMC free article] [PubMed] [Google Scholar]
- 14.Zeng X, et al. Pharmacologic inhibition of the anaphase-promoting complex induces a spindle checkpoint-dependent mitotic arrest in the absence of spindle damage. Cancer Cell. 2010;18:382–395. doi: 10.1016/j.ccr.2010.08.010. [DOI] [PMC free article] [PubMed] [Google Scholar]
- 15.Rape M, Reddy SK, Kirschner MW. The processivity of multiubiquitination by the APC determines the order of substrate degradation. Cell. 2006;124:89–103. doi: 10.1016/j.cell.2005.10.032. [DOI] [PubMed] [Google Scholar]
- 16.Meyer HJ, Rape M. Enhanced protein degradation by branched ubiquitin chains. Cell. 2014;157:910–921. doi: 10.1016/j.cell.2014.03.037. [DOI] [PMC free article] [PubMed] [Google Scholar]
- 17.Moshe Y, Bar-On O, Ganoth D, Hershko A. Regulation of the action of early mitotic inhibitor 1 on the anaphase-promoting complex/cyclosome by cyclin-dependent kinases. J Biol Chem. 2011;286:16647–16657. doi: 10.1074/jbc.M111.223339. [DOI] [PMC free article] [PubMed] [Google Scholar]
- 18.Frye JJ, et al. Electron microscopy structure of human APC/C(CDH1)-EMI1 reveals multimodal mechanism of E3 ligase shutdown. Nature structural & molecular biology. 2013;20:827–835. doi: 10.1038/nsmb.2593. [DOI] [PMC free article] [PubMed] [Google Scholar]
- 19.Chang L, Zhang Z, Yang J, McLaughlin SH, Barford D. Molecular architecture and mechanism of the anaphase-promoting complex. Nature. 2014;513:388–393. doi: 10.1038/nature13543. [DOI] [PMC free article] [PubMed] [Google Scholar]
- 20.Wang W, Kirschner MW. Emi1 preferentially inhibits ubiquitin chain elongation by the anaphase-promoting complex. Nat Cell Biol. 2013;15:797–806. doi: 10.1038/ncb2755. [DOI] [PMC free article] [PubMed] [Google Scholar]
- 21.Dimova NV, et al. APC/C-mediated multiple monoubiquitylation provides an alternative degradation signal for cyclin B1. Nat Cell Biol. 2012;14:168–176. doi: 10.1038/ncb2425. [DOI] [PMC free article] [PubMed] [Google Scholar]
- 22.Thrower JS, Hoffman L, Rechsteiner M, Pickart CM. Recognition of the polyubiquitin proteolytic signal. Embo J. 2000;19:94–102. doi: 10.1093/emboj/19.1.94. [DOI] [PMC free article] [PubMed] [Google Scholar]
- 23.Spencer SL, et al. The proliferation-quiescence decision is controlled by a bifurcation in CDK2 activity at mitotic exit. Cell. 2013;155:369–383. doi: 10.1016/j.cell.2013.08.062. [DOI] [PMC free article] [PubMed] [Google Scholar]
- 24.Sherr CJ. Cancer cell cycles. Science. 1996;274:1672–1677. doi: 10.1126/science.274.5293.1672. [DOI] [PubMed] [Google Scholar]
- 25.Song L, Rape M. Regulated degradation of spindle assembly factors by the anaphase-promoting complex. Mol Cell. 2010;38:369–382. doi: 10.1016/j.molcel.2010.02.038. [DOI] [PMC free article] [PubMed] [Google Scholar]
- 26.Pierce NW, Kleiger G, Shan SO, Deshaies RJ. Detection of sequential polyubiquitylation on a millisecond timescale. Nature. 2009;462:615–619. doi: 10.1038/nature08595. [DOI] [PMC free article] [PubMed] [Google Scholar]
Associated Data
This section collects any data citations, data availability statements, or supplementary materials included in this article.
Supplementary Materials
Data Availability Statement
Source Data are available from the corresponding authors upon reasonable request.