Abstract
Alkylglycerone phosphate synthase (AGPS) is an oncogene and can be considered as an antitumor drug target. The aim of the present study was to design novel nitrogenous heterocyclic compound improving targetability by computer-aided drug design technology targeting AGPS. A total of 12 nitrogenous heterocyclic compounds were designed and predicted the absorption, distribution, metabolism and excretion parameters/toxicity. Their activity in terms of proliferation inhibition, cell cycle arrest and apoptosis induction was then measured using an MTS assay and a high-content screening system in U251 cells. The results showed that anti-glioma activity was present in compounds N4, N5, N6, N7, N8 and N12, which was in accordance with the computer prediction. Therefore, these compounds may be suitable for the development of a novel glioma therapeutic drug.
Keywords: computer-aided drug design, alkylglycerone phosphate synthase, nitrogenous heterocyclic compound
Introduction
Malignant glioma is a disease that severely impairs human health. In our previous study, alkylglycerone phosphate synthase (AGPS) was found to be an oncogene, and the hypothesis was made that AGPS may be a target of glioma inhibitors (1,2). The aim of the present study was to design nitrogenous heterocyclic compounds via computer-aided design and determine the molecular biological differences between tumor cells and normal cells, in order to improve selectivity and enhance the current research on targetability of the nitrogenous heterocyclic compounds. AGPS was selected as the target around which to structure a two-dimensional (2D) and 3D structure-activity model via computer-aided drug design (CADD) technology to make macromolecular docking. Nitrogenous heterocyclic compounds were designed and a database was established in an effort to obtain a comprehensive understanding of the structure-activity relationship among candidate compounds.
It has been found that the onset and progression course of a tumor is often accompanied with lipid metabolic confusion (3). The inactivation of key enzymes synthesized by AGPS can lower the ether ester level of tumor cells and reduce the pathogenicity of the cancer, while their overexpression can raise the ether ester level of the tumor cells and enhance cell proliferation and movement ability, thereby promoting growth and invasion of tumor (4). This indicates the potential of AGPS to become a novel target for antineoplastic agents, and its specific inhibitor will provide advantages which surpass those provided by traditional chemotherapy. Our previous study also validated the use of RNA interference technology to silence the expression of AGPS in glioma and hepatoma cells in order to inhibit their proliferation and invasion, and to improve the sensitivity of cells that are resistant to medicine (5).
Based on the aforementioned study (6), AGPS was selected as target to structure 2D and 3D structure-activity association models via CADD technology in the present study. A total of 12 nitrogenous heterocyclic compounds were designed and a database was established, in order to obtain a comprehensive understanding of the structure-activity associations among the candidate compounds and then further optimize the lead compound structure.
Materials and methods
Protein structure and the database
A 3D structure model [Protein Data Bank (PDB) ID: 2UUV] of human AGPS was downloaded from PDB (7). The amino acid residue in the crystal structure did not mutate. Crystal structure resolution was <2.6.
Ligand preparation
Ligand preparation was designed by chemical drug experience and utilized ChemBioDraw Ultra 11.0 in the ChemOffice 2010 software package (PerkinElmer, Inc., Waltham, MA, USA) to plot the micromolecule planar construction. The plotted planar construction was then imported into ChemBio3D Ultra 11.0 to generate a spatial structure, which was then saved in *.mol2 format. The file in *.mol2 format was imported into Discovery Studio 3.5 software (BIOVIA, San Diego, CA, USA) for docking and Erwin Schrodinger 2009 software (Schrodinger, LLC, Portland, OR, USA) for absorption, distribution, metabolism and excretion (ADME) analysis, and the LigPrep module was adopted to optimize the micromolecule, desalt and add an electric charge to produce ionization consistent with human body pH. The force field of the optimization molecule was OPLS_2005, which is the same as that of the optimization receptor, thereby forming a tautomeride of the molecule. The alloisomerism treatment adopted the input spatial structure to perform the chiral method of molecular docking.
Molecular docking
Molecular docking was conducted using the ‘docking’ module in the Discovery Studio 3.5 software, with ‘receptor box producing’ selected and centered on the original ligand micromolecule to automatically generate the receptor box file. Flexible docking with standard accuracy was adopted. All calculations were conducted using the Dell Precision T5500 workstation (Dell Inc., Round Rock, TX, USA) with the Red Hat Enterprise Linux 6.0 operating system (Red Hat, Raleigh, NC, USA).
The compound structure was imported into Discovery Studio 3.5, and the preparation work for the micromolecule prior to docking was completed using the prepare ligands tool module in the software package, including restoring valence, generating 3D conformation and minimizing the energy of the micromolecule. Molecular docking was performed by the CDOCKER module in Discovery Studio 3.5, with the original ligand molecule as the center and 9Å as the radius, to automatically generate docking region. The result used ‘CDOCKER ENERGY’ as the scoring index. The larger the value was, the larger the affinity of receptor docking.
ADME analysis
ADME was an important part in the medicine discovery process to select and optimize the compound. The downloaded AGPS target crystal structure (2UUV) was imported into Schrodinger 2009 for ADME analysis in order to first correct the chemical bond in the protein structure, treat the metallic ions, hydrogenate, make the amino acid residue at end N and end C neutral, reserve the original ligand and protein, and remove impurity atoms and water molecules. The OPLS_2005 position was selected to optimize the protein structure, and sample water orientations served as the parameters to optimize the hydrogen bond, with the convergence standard being RMSD0.5Å.
Toxicity analysis
Toxicity prediction was also important in the selection of a potential drug. Toxicity analysis was conducted using the ‘TOPKAT’ module in Discovery Studio 3.5 software. Toxicity parameters included rodent carcinogenicity, mutagenicity, the ames test, skin irritancy, ocular irritation, aerobic biodegradability, and whether the molecule was a non-carcinogen, non-mutagen and non-degradable.
Cell culture
AGPS was demonstrated to be overexpressed in glioma in a previous study (8), so the glioma U251 cell line was used to explored the activity of compounds at first, provided by the Type Culture Collection of the Chinese Academy of Sciences (Shanghai, China). The cells were cultured in Dulbecco's modified Eagle's medium with 10% fetal bovine serum (Gibco; Thermo Fisher Scientific, Inc., Waltham, MA, USA) in a cell incubator with 5% CO2 at 37°C.
MTS assay
A total of 5×10³ U251 cells in suspension with Dulbecco's modified Eagle's medium with 10% fetal bovine serum were added to 96-well plates at 37°C for 24 h, and N1-N12 (designed by the School of Pharmacy, Tianjin Medical University, Tianjin, China; synthesized by Werian Biotech Co., Jinan, China) at different concentrations (0, 2, 5, 10, 20, 50, 100 and 200 µM) were added at 37°C for 72 h. Then MTS (Promega Corporation, Madison, WI, USA) solvent was added and incubated at 37°C for 1 h and the OD value was measured using a Multiskan FC Microplate Reader (Thermo Fisher Scientific Inc.). The cell proliferation was then measured by MTS assay. Inhibition rate was calculated as follows: Inhibition rate (%)=(1-optical density valuetreatment group/optical density valuecontrol group) ×100. The half maximal inhibitory concentration (IC50) was calculated by Graphpad Prism 6.0 (GraphPad Software, Inc., La Jolla, CA, USA).
High-content screening (HCS) assay
The cell cycle and apoptosis were measured by HCS platform CellInsight CX5 (Thermo Fisher Scientific, Inc.) via fluorescence intensity. For the cell cycle measurement, 8×10³ U251 cells in suspension were added to 96-well plates with Premo Cdt1-red fluorescent protein and Premo geminin-green fluorescent protein (both Thermo Fisher Scientific, Inc.) at 37°C for 24 h. N1-N12 (100 µM) [with 100 µl phosphate-buffered saline (PBS) as the negative control] were added for 24 h, and then the cell cycle was measured and analyzed by HCS platform at 488 nm excitation.
For the cell apoptosis measurements, 8×10³ U251 cells in suspension were added to 96-well plates for 24 h, and 100 µM compounds (with PBS as the negative control) were added for 24 h. The cells were then incubated with Annexin V and Hoechst 33258 (Sigma-Aldrich; Merck KGaA, Darmstadt, Germany) in the dark at room temperature for 15 min, and the cell apoptosis was measured and analyzed by HCS platform at 488 nm excitation.
Statistical analysis
The experimental data were statistically analyzed with SPSS 11.0 statistical software (SPSS, Inc., Chicago, IL, USA) and are expressed as the mean ± standard deviation. The statistical analysis was performed using one-way analysis of variance with the Tukey-Kramer post hoc test. P<0.05 was considered to indicate a statistically significant difference.
Results
Analysis on affinity
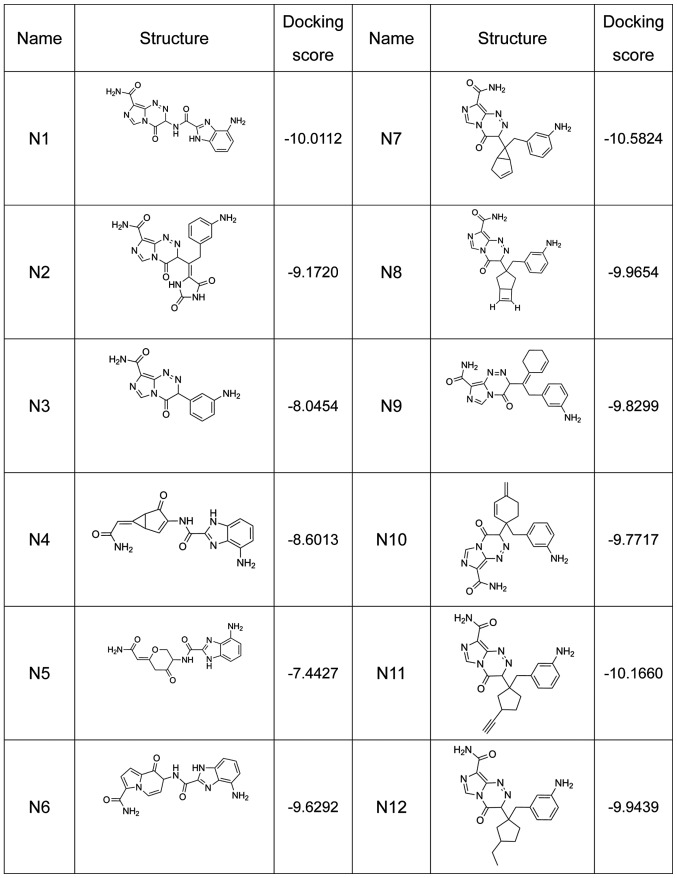
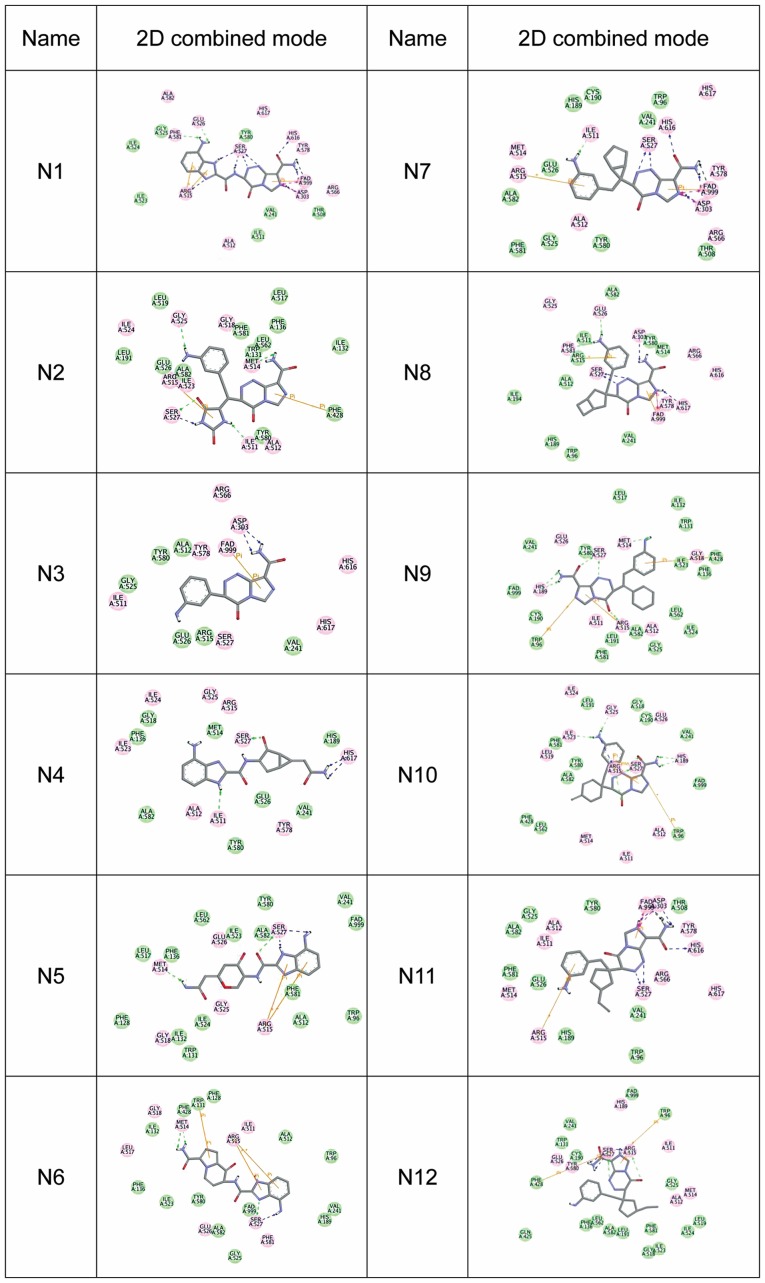
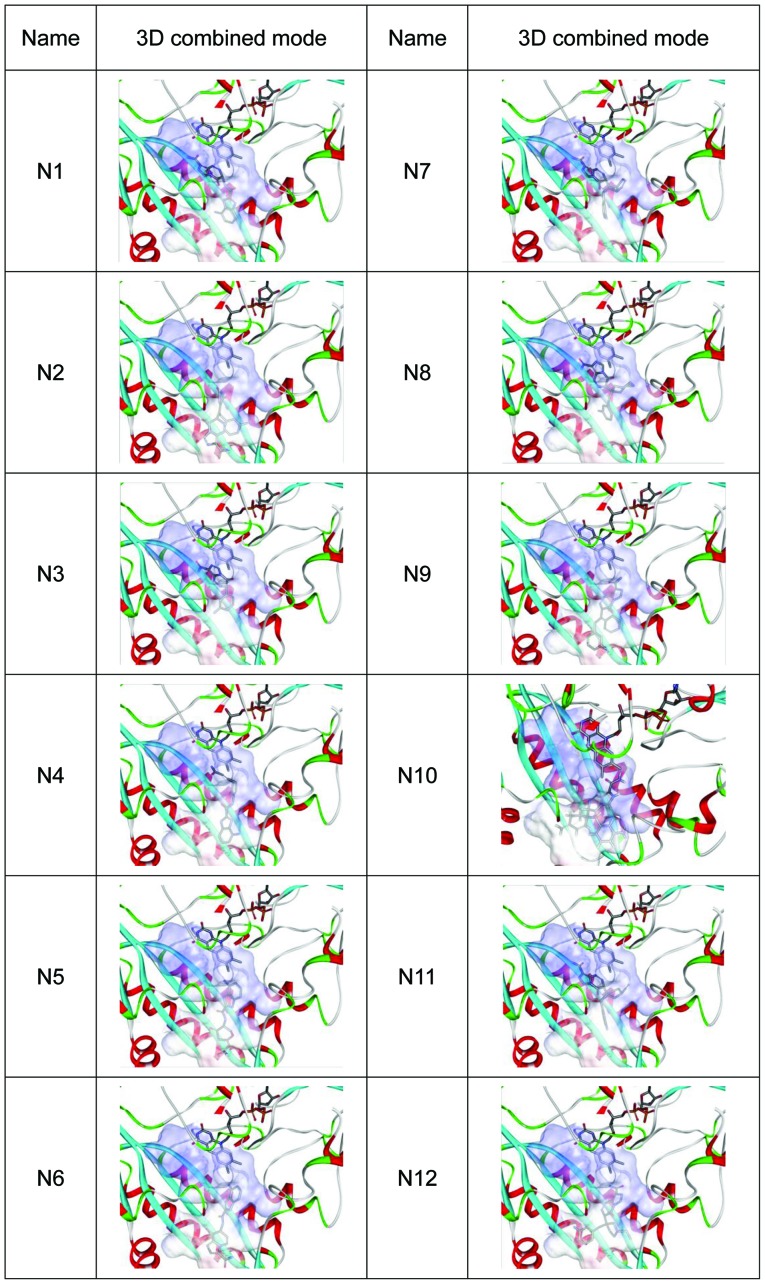
A total of 12 compounds were designed for the analysis on affinity, which is represented by the docking score (a high docking score indicates a high affinity) (Fig. 1). The 2D combined mode with amino acid residue (Fig. 2) and the 3D combined mode (Fig. 3) with AGPS show the hydrophobic bond (green circle and green line), hydrogen (pink circle and blue line) and pi bond (a covalent bond, orange line) interactions of the compounds (the dotted lines in Fig. 2).
Figure 1.
Structure and docking score of nitrogenous heterocyclic compounds N1-N12.
Figure 2.
2D combined mode of nitrogenous heterocyclic compounds N1-N12. The green circle and green line represent the hydrophobic bond, the pink circle and blue line represent the hydrogen bond, and the orange line represents the pi bond (a covalent bond) in interactions of the compounds. 2D, two-dimensional.
Figure 3.
3D combined mode of nitrogenous heterocyclic compounds N1-N12. 3D, three-dimensional.
ADME prediction
ADME properties are an important index to check whether clinical candidates can reach the required standard (9). Bad properties imply a high risk of failure for this candidate, which may become a less than ideal drug. The ADME of an ideal medicine is as follows: Hydrogen bond donor, ≤5; hydrogen bond receptor, <10; molecular weight, <500 Da; lipid water partition coefficient, <5; water-solubility partition coefficient, −6.5<logS<-0.5; and polar surface area, 7.0–200.0 (10).
Table I shows the ADME results of the nitrogenous heterocyclic compounds, with some that satisfied the aforementioned qualifications. N4, N5, N6, N7, N8 and N12 were considered to exhibit potential drug properties.
Table I.
Absorption, distribution, metabolism and excretion prediction of nitrogenous heterocyclic compounds.
| Compound | MW (Da) | donorHB | accptHB | QPlogPo/w | QPlogS | PSA |
|---|---|---|---|---|---|---|
| N1 | 353.299 | 4.75 | 13.75 | −2.350 | −2.809 | 215.170 |
| N2 | 394.349 | 5.50 | 14.00 | −2.247 | −2.459 | 230.122 |
| N3 | 270.250 | 3.50 | 10.50 | −1.464 | −2.210 | 148.217 |
| N4 | 323.310 | 4.75 | 8.75 | −0.409 | −3.568 | 170.861 |
| N5 | 329.315 | 4.75 | 9.50 | −0.617 | −3.307 | 178.267 |
| N6 | 350.336 | 4.75 | 8.75 | 0.100 | −3.810 | 172.853 |
| N7 | 362.390 | 3.50 | 9.50 | 0.008 | −2.991 | 144.227 |
| N8 | 376.417 | 3.50 | 9.50 | 0.259 | −3.435 | 143.247 |
| N9 | 376.417 | 3.50 | 10.50 | 0.488 | −2.838 | 142.237 |
| N10 | 376.417 | 3.50 | 9.50 | 0.505 | −2.489 | 135.360 |
| N11 | 376.417 | 4.00 | 10.50 | 0.340 | −2.651 | 139.990 |
| N12 | 380.449 | 3.50 | 9.50 | 0.506 | −2.749 | 139.842 |
MW, molecular weight; donorHB, hydrogen bond donor; accptHB, hydrogen bond receptor; QPlogPo/w, lipid water partition coefficient; QPlogS, water solubility partition coefficient; PSA, polar surface area.
Toxicity prediction
Table II shows the toxicity prediction results of the nitrogenous heterocyclic compounds. All compounds were found to exhibit suitable toxicity for drug development.
Table II.
Toxicity prediction of nitrogenous heterocyclic compounds.
| Compound | Mouse female NTP prediction | Mouse male NTP prediction | Rat female NTP prediction | Rat male NTP prediction | Ames prediction | Skin irritancy | Ocular irritancy | Aerobic biodegradability prediction |
|---|---|---|---|---|---|---|---|---|
| N1 | Non-carcinogen | Non-carcinogen | Non-carcinogen | Non-carcinogen | Mutagen | None | Mild | Non-degradable |
| N2 | Non-carcinogen | Non-carcinogen | Non-carcinogen | Non-carcinogen | Non-mutagen | None | Mild | Non-degradable |
| N3 | Non-carcinogen | Non-carcinogen | Non-carcinogen | Non-carcinogen | Non-mutagen | None | Mild | Non-degradable |
| N4 | Non-carcinogen | Non-carcinogen | Non-carcinogen | Non-carcinogen | Non-mutagen | None | Mild | Non-degradable |
| N5 | Non-carcinogen | Non-carcinogen | Non-carcinogen | Non-carcinogen | Non-mutagen | None | Mild | Non-degradable |
| N6 | Non-carcinogen | Non-carcinogen | Non-carcinogen | Non-carcinogen | Mutagen | None | Mild | Non-degradable |
| N7 | Non-carcinogen | Non-carcinogen | Non-carcinogen | Non-carcinogen | Mutagen | None | Mild | Non-degradable |
| N8 | Non-carcinogen | Non-carcinogen | Non-carcinogen | Non-carcinogen | Mutagen | None | Mild | Non-degradable |
| N9 | Non-carcinogen | Non-carcinogen | Non-carcinogen | Non-carcinogen | Mutagen | None | Mild | Non-degradable |
| N10 | Non-carcinogen | Non-carcinogen | Non-carcinogen | Non-carcinogen | Non-mutagen | None | Mild | Non-degradable |
| N11 | Non-carcinogen | Non-carcinogen | Non-carcinogen | Non-carcinogen | Non-mutagen | None | Mild | Non-degradable |
| N12 | Non-carcinogen | Non-carcinogen | Non-carcinogen | Non-carcinogen | Non-mutagen | None | Mild | Non-degradable |
NTP, National Toxicology Program.
Effect of nitrogenous heterocyclic compounds on the proliferation of U251 cells
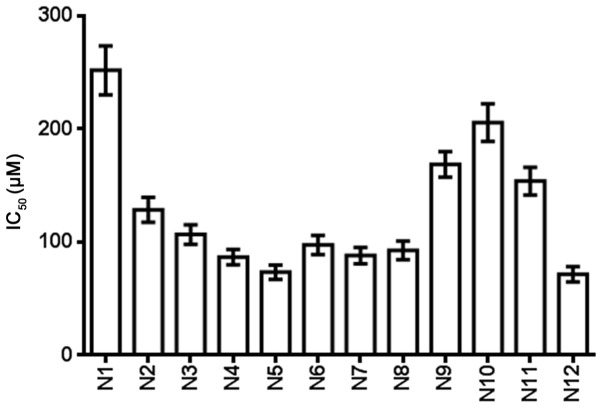
Table III and Fig. 4 show the IC50 of the nitrogenous heterocyclic compounds for 72 h. It was found that compounds N4, N5, N6, N7, N8 and N12, which had IC50 values of <100 µM, were suitable for drug development.
Table III.
IC50 of nitrogenous heterocyclic compounds in U251 cells.
| Compound | IC50, µM |
|---|---|
| N1 | 251.7 |
| N2 | 128.5 |
| N3 | 106.8 |
| N4 | 86.7 |
| N5 | 73.5 |
| N6 | 97.5 |
| N7 | 88.2 |
| N8 | 92.8 |
| N9 | 168.7 |
| N10 | 205.6 |
| N11 | 153.8 |
| N12 | 71.7 |
IC50, half maximal inhibitory concentration.
Figure 4.
MTS assay showed that nitrogenous heterocyclic compounds suppressed the proliferation of U251 cells and the IC50 was determined. IC50, half maximal inhibitory concentration.
Effect of nitrogenous heterocyclic compounds on the cell apoptosis of U251 cells
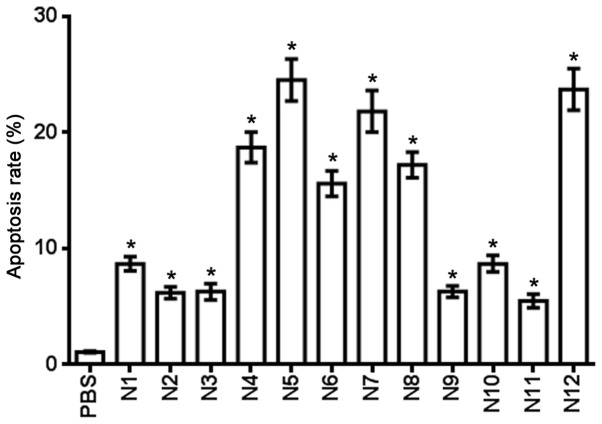
Table IV shows the effect of the nitrogenous heterocyclic compounds on cell apoptosis for 24 h. Compounds N4, N5, N6, N7, N8 and N12 induced a >10% cell apoptosis rate at a 100 µM concentration (Fig. 5).
Table IV.
Apoptosis rate of nitrogenous heterocyclic compounds in U251 cells.
| Compound | Apoptosis rate, % |
|---|---|
| PBS control | 1.1 |
| N1 | 8.7 |
| N2 | 6.2 |
| N3 | 6.3 |
| N4 | 18.7 |
| N5 | 24.5 |
| N6 | 15.6 |
| N7 | 21.8 |
| N8 | 17.2 |
| N9 | 6.3 |
| N10 | 8.7 |
| N11 | 5.5 |
| N12 | 23.7 |
Figure 5.
Effect of nitrogenous heterocyclic compounds on the cell apoptosis of U251 cells. HCS assay showed that nitrogenous heterocyclic compounds induced cell apoptosis of U251 cells. *P<0.05 compared with the PBS group. PBS, phosphate-buffered saline.
Effect of nitrogenous heterocyclic compounds on the cell cycle of U251 cells
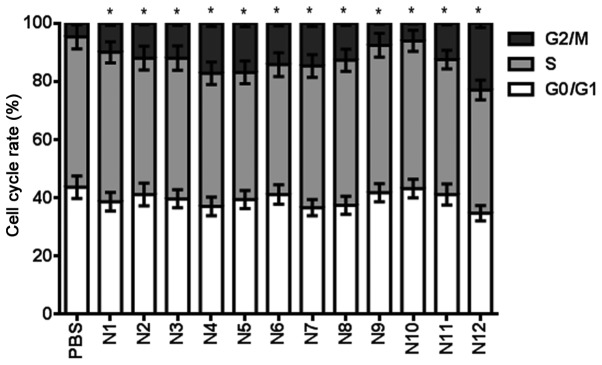
Table V shows the effect of nitrogenous heterocyclic compounds on the cell cycle for 24 h. It was found that compounds N2, N3, N4, N5, N6, N7, N8, N11 and N12 induced a >10% cell cycle arrest at a 100 µM concentration (Fig. 6).
Table V.
Effect of nitrogenous heterocyclic compounds on the cell cycle of U251 cells.
| Cell cycle stage (%) | PBS | N1 | N2 | N3 | N4 | N5 | N6 | N7 | N8 | N9 | N10 | N11 | N12 |
|---|---|---|---|---|---|---|---|---|---|---|---|---|---|
| G0/G1 | 43.7 | 38.7 | 41.2 | 39.7 | 37.1 | 39.5 | 41.2 | 36.7 | 37.5 | 41.8 | 43.2 | 41.2 | 34.8 |
| S | 51.6 | 51.3 | 46.8 | 48.3 | 45.7 | 43.6 | 44.6 | 48.6 | 49.8 | 50.6 | 50.7 | 46.3 | 42.3 |
| G2/M | 4.7 | 10.0 | 12.0 | 12.0 | 17.2 | 16.9 | 14.2 | 14.7 | 12.7 | 7.6 | 6.1 | 12.5 | 22.9 |
PBS, phosphate-buffered saline.
Figure 6.
Effect of nitrogenous heterocyclic compounds on the cell cycle of U251 cells. HCS assay showed that nitrogenous heterocyclic compounds induced cell cycle arrest in the G2/M phase of U251 cells. *P<0.05 compared with the PBS group. PBS, phosphate-buffered saline.
Discussion
Malignant glioma is a disease that seriously damages human health; it accounts for ~70% of primary malignant brain tumors, with an annual incidence of ~5/100,000 individuals (11,12). The number of new cases every year exceeds 14,000. As for glioblastoma (World Health Organization stage IV) patients, median survival time is only between 14.6 and 17 months, and the annual number of associated mortalities reaches 30,000 (13–15). The chemical features comprise: The hydrogen bond receptor, hydrogen bond donor, hydrophobic center, positive charge center, negative charge center and aromatic ring center (16–18). In the present study, compounds N1-N12 were first docked, resulting in high docking scores with the target AGPS. This implies their potential ability to inhibit AGPS.
In previous years, the medicine discovery phase mainly focused on the discovery of active compounds, and other problems, including pharmacokinetics, toxicity, solubility and stability, were not considered until the development phase. Thus, solely analyzing the affinity of the compound and target cannot ascertain the possibility of these compounds becoming potential medicines (19). ADME properties are an important index to check whether clinical candidates can reach the required standard. Bad properties imply a high risk of failure for this candidate, which may then become a less than ideal drug. According to a previous study, ~40% of failures to develop a medicine in the development phase are due to poor biopharmaceutical properties (PK and bioavailability) (20). High development expenses make such failures a primary economic loss in medicine development. Thus, ADME has become an indispensable part of the medicine discovery process, and it can be used to supervise the selection and optimization of precious lead compounds. The QikProp module (in part of the Erwin Schrodinger 2009 software) can predict the following properties of compounds: the logarithm value of brain to plasma concentration ratio, water solubility, liposolubility, MDCK cell line and Caco-2 cell line for permeability, general central nervous system activity, K ion channel blocking of human ether-a-go-go related gene log IC50 and the bonding activity of serum albumin (log Khsa). The present study experiments predicted water solubility, polar surface area, MDCK cell permeability, and oil and water partition coefficient. It was found that N4, N5, N6, N7, N8 and N12 exhibited potential drug properties. The toxicity predictions of the compounds were also investigated with Discovery Studio using the TOPKAT protocol, and the toxicity of the compounds was found to be suitable for the development into a medical drug.
HCS was the novel technology used for the drug activity screening in the present study, and it was able to analyze the effect on cell proliferation, cell apoptosis and the cell cycle by high throughput and quick screening using the HCS platform. The effect on proliferation, apoptosis and the cell cycle by 12 nitrogenous heterocyclic compounds was analyzed, and N4, N5, N6, N7, N8 and N12 were shown to be most active in vitro according the ADME prediction, showing the accuracy of the CADD screening model.
In conclusion, 12 nitrogenous heterocyclic compounds were designed in the present study, 6 of which presented with suitable ADME parameters and toxicity predictions; these 6 may be suitable for development into novel glioma therapeutic drugs. This study provides a foundation for the study into novel nitrogenous heterocyclic anti-glioma drugs and future studies will investigate the toxicity in animal models.
Acknowledgements
Not applicable.
Funding
The present study was supported by the National Natural Science Foundation of China (grant nos. 31501159 and 81601047), the Tianjin Public Health Key Research Project (grant no. 15KG108), the Tianjin Science and Technology Key Project on Chronic Disease Prevention and Treatment (grant no. 16ZXMJSY00020), the Special Program of Talent Development for Excellent Youth Scholars in Tianjin, China (grant no. TJTZJH-QNBJRC-2-9) and the Tianjin 131 Creative Talents Cultivation Project (1st Class, 2016).
Availability of data and materials
All data and materials relevant to the present study are described in this published article or available from the corresponding author on reasonable request.
Authors' contributions
YZ performed the statistical analysis, YZ and YH designed the study and performed the cell experiments, YM designed and synthesized the computer-aided drug, and PY performed the statistical analysis.
Ethics approval and consent to participate
Not applicable.
Consent for publication
Not applicable.
Competing interests
The authors declare that they have no competing interests.
References
- 1.Ames H, Halushka MK, Rodriguez FJ. miRNA regulation in gliomas: Usual suspects in glial tumorigenesis and evolving clinical applications. J Neuropathol Exp Neurol. 2017;76:246–254. doi: 10.1093/jnen/nlx005. [DOI] [PubMed] [Google Scholar]
- 2.Cives M, Ghayouri M, Morse B, Brelsford M, Black M, Rizzo A, Meeker A, Strosberg J. Analysis of potential response predictors to capecitabine/temozolomide in metastatic pancreatic neuroendocrine tumors. Endocr Relat Cancer. 2016;23:759–767. doi: 10.1530/ERC-16-0147. [DOI] [PubMed] [Google Scholar]
- 3.Dilillo M, Ait-Belkacem R, Esteve C, Pellegrini D, Nicolardi S, Costa M, Vannini E, Graaf EL, Caleo M, McDonnell LA. Ultra-high mass resolution MALDI imaging mass spectrometry of proteins and metabolites in a mouse model of glioblastoma. Sci Rep. 2017;7:603. doi: 10.1038/s41598-017-00703-w. [DOI] [PMC free article] [PubMed] [Google Scholar]
- 4.Piano V, Benjamin DI, Valente S, Nenci S, Marrocco B, Mai A, Aliverti A, Nomura DK, Mattevi A. Discovery of inhibitors for the ether lipid-generating enzyme AGPS as anti-cancer agents. ACS Chem Biol. 2015;10:2589–2597. doi: 10.1021/acschembio.5b00466. [DOI] [PMC free article] [PubMed] [Google Scholar]
- 5.Zhu Y, Liu XJ, Yang P, Zhao M, Lv LX, Zhang GD, Wang Q, Zhang L. Alkylglyceronephosphate synthase (AGPS) alters lipid signaling pathways and supports chemotherapy resistance of glioma and hepatic carcinoma cell lines. Asian Pac J Cancer Prev. 2014;15:3219–3226. doi: 10.7314/APJCP.2014.15.7.3219. [DOI] [PubMed] [Google Scholar]
- 6.Zhu Y, Liu A, Zhang X, Qi L, Zhang L, Xue J, Liu Y, Yang P. The effect of benzyl isothiocyanate and its computer-aided design derivants targeting alkylglycerone phosphate synthase on the inhibition of human glioma U87MG cell line. Tumour Biol. 2015;36:3499–3509. doi: 10.1007/s13277-014-2986-6. [DOI] [PubMed] [Google Scholar]
- 7.Razeto A, Mattiroli F, Carpanelli E, Aliverti A, Pandini V, Coda A, Mattevi A. The crucial step in ether phospholipid biosynthesis: Structural basis of a noncanonical reaction associated with a peroxisomal disorder. Structure. 2007;15:683–692. doi: 10.1016/j.str.2007.04.009. [DOI] [PubMed] [Google Scholar]
- 8.Zhu Y, Zhu L, Lu L, Zhang L, Zhang G, Wang Q, Yang P. Role and mechanism of the alkylglycerone phosphate synthase in suppressing the invasion potential of human glioma and hepatic carcinoma cells in vitro. Oncol Rep. 2014;32:431–436. doi: 10.3892/or.2014.3189. [DOI] [PubMed] [Google Scholar]
- 9.Battu MB, Chandra AM, Sriram D, Yogeeswari P. Pharmacophore-based 3DQSAR and molecular docking studies to identify new non-peptidic inhibitors of cathepsin S. Curr Med Chem. 2014;21:1910–1921. doi: 10.2174/09298673113206660275. [DOI] [PubMed] [Google Scholar]
- 10.Verma SK, Thareja S. Structure based comprehensive modelling, spatial fingerprints mapping and ADME screening of curcumin analogues as novel ALR2 inhibitors. PLoS One. 2017;12:e0175318. doi: 10.1371/journal.pone.0175318. [DOI] [PMC free article] [PubMed] [Google Scholar]
- 11.Silginer M, Weller M, Stupp R, Roth P. Biological activity of tumor-treating fields in preclinical glioma models. Cell Death Dis. 2017;8:e2753. doi: 10.1038/cddis.2017.171. [DOI] [PMC free article] [PubMed] [Google Scholar]
- 12.Lin CY, Huang HM. Unilateral malignant optic glioma following glioblastoma multiforme in the young: A case report and literature review. BMC Ophthalmol. 2017;17:21. doi: 10.1186/s12886-017-0415-5. [DOI] [PMC free article] [PubMed] [Google Scholar]
- 13.Louis DN, Perry A, Reifenberger G, et al. The 2016 World Health Organization classification of tumors of the central nervous system: A summary. Acta Neuropathol. 2016;131:803–820. doi: 10.1007/s00401-016-1545-1. [DOI] [PubMed] [Google Scholar]
- 14.Wang N, Zhang Q, Ning B, Luo L, Fang Y. β-Asarone promotes Temozolomide's entry into glioma cells and decreases the expression of P-glycoprotein and MDR1. Biomed Pharmacother. 2017;90:368–374. doi: 10.1016/j.biopha.2017.03.083. [DOI] [PubMed] [Google Scholar]
- 15.Holdhoff M, Ye X, Supko JG, Nabors LB, Desai AS, Walbert T, Lesser GJ, Read WL, Lieberman FS, Lodge MA, et al. Timed sequential therapy of the selective T-type calcium channel blocker mibefradil and temozolomide in patients with recurrent high-grade gliomas. Neuro Oncol. 2017;19:845–852. doi: 10.1093/neuonc/nox020. [DOI] [PMC free article] [PubMed] [Google Scholar]
- 16.Cai Z, Zhang G, Zhang X, Liu Y, Fu X. Current insights into computer-aided immunotherapeutic design strategies. Int J Immunopathol Pharmacol. 2015;28:278–285. doi: 10.1177/0394632015588765. [DOI] [PubMed] [Google Scholar]
- 17.Medeiros Turra K, Pineda Rivelli D, Berlanga de Moraes Barros S, Mesquita Pasqualoto KF. Constructing and validating 3D-pharmacophore models to a set of MMP-9 inhibitors for designing novel anti-melanoma agents. Mol Inform. 2016;35:238–252. doi: 10.1002/minf.201600004. [DOI] [PubMed] [Google Scholar]
- 18.Valasani KR, Chaney MO, Day VW, Shidu Yan S. Acetylcholinesterase inhibitors: Structure based design, synthesis, pharmacophore modeling, and virtual screening. J Chem Inf Model. 2013;53:2033–2046. doi: 10.1021/ci400196z. [DOI] [PubMed] [Google Scholar]
- 19.Cao D, Wang J, Zhou R, Li Y, Yu H, Hou T. ADMET evaluation in drug discovery. 11. PharmacoKinetics Knowledge Base (PKKB): A comprehensive database of pharmacokinetic and toxic properties for drugs. J Chem Inf Model. 2012;52:1132–1137. doi: 10.1021/ci300112j. [DOI] [PubMed] [Google Scholar]
- 20.Gomeni R, Bani M, D'Angeli C, Corsi M, Bye A. Computer-assisted drug development (CADD): An emerging technology for designing first-time-in-man and proof-of-concept studies from preclinical experiments. Eur J Pharm Sci. 2001;13:261–270. doi: 10.1016/S0928-0987(01)00111-7. [DOI] [PubMed] [Google Scholar]
Associated Data
This section collects any data citations, data availability statements, or supplementary materials included in this article.
Data Availability Statement
All data and materials relevant to the present study are described in this published article or available from the corresponding author on reasonable request.


