Abstract
Bladder cancer (BLCA) is among the most malignant types of cancer. At present, the prognostic tools available for this disease are insufficient. In the present study, the transcriptome of 1,049 BLCA samples from four datasets from the Gene Expression Omnibus and The Cancer Genome Atlas (TCGA) were analyzed. By utilizing the RNA-seq data provided by TCGA, a risk score staging system model was built to predict the outcome of patients with BLCA using random forest variable hunting and Cox multivariate regression. A total of 7 genes, including zinc finger protein 230, Bcl2-like 14, AHNAK, transmembrane protein 109, apolipoprotein L2, advanced glycation end-product specific receptor and amine oxidase, copper containing 2 were identified as predicting the survival time of patients with BLCA. The patients with a low risk score had a significantly higher survival rate than those with a high-risk score both in the training and validation datasets. Association analyses between risk score and other clinical information were additionally performed; it was demonstrated that the risk score was significantly associated with pathological stage. A nomogram was plotted to compare risk score and other clinical information. The risk score spanned the greatest range of points, indicating the relative accuracy of risk score. In summary, the risk staging model based on the expression of 7 genes is robust and performs more effectively than other clinical information in predicting a prognosis.
Keywords: bladder cancer, prognosis, risk score, gene expression
Introduction
Bladder cancer (BLCA) is among the most malignant types of cancer; 76,790 new cases and 16,390 mortalities were reported in the United States in 2016 (1). Based on a recent study on cancer in China, there were 80,500 new cases and 32,900 mortalities from BRCA reported in 2015 (2). Metastasis and early relapse are common in BLCA, thus determining the prognosis is important for patients with BLCA (3). However, the current clinical staging system is insufficient to predict the outcome of patients with BLCA (4). Therefore, novel molecular biomarkers for prediction of BLCA prognosis are urgently required.
According to a previous study, single biomarkers often fail to accurately predict the prognosis of patients in datasets, whereas multiple biomarkers perform more effectively (5). In the present study, random forest variable hunting coupled with Cox multivariate regression were used to produce a model based on gene expression levels to evaluate the prognosis of patients with BLCA from The Cancer Genome Atlas (TCGA) dataset. The patients with high risk scores had a significantly shorter survival time than those with low risk scores, which was validated in 3 further independent cohorts. Furthermore, the association between risk score and other clinical information demonstrated that the risk score was associated with the pathological stage, while a nomogram based on risk score and clinical information indicated that the risk score corresponded the most with the outcome of bladder cancer.
Materials and methods
Data processing
mRNA expression levels from the ‘TCGA Bladder Cancer (BLCA)’ dataset (n=407) were downloaded from UCSC Xena (http://xena.ucsc.edu/) and converted to RNAseq by expectation-maximization (RSEM) values using the Xena website. Genes not expressed in any of the samples were filtered from the dataset. log 2-transformed RSEM values were retained for model development.
Raw data from the expression profiles GSE31684, GSE48075 and E-MTAB-4321 were downloaded from Gene Expression Omnibus (https://www.ncbi.nlm.nih.gov/geo) and Array Express (www.ebi.ac.uk/arrayexpress/) in CEL format. Background correction and normalization with Robust Multiarray Averaging were performed on the raw data (6,7). Probes were matched to the HUGO Gene (https://www.genenames.org/) Nomenclature Committee-approved gene names. Probes without annotation were discarded, genes matching more than one probe were merged and mean values were used to represent gene expression. The Z-score was calculated in each dataset for each gene across samples and used for further analysis (8).
Gene selection and model construction
Univariate Cox regression analysis was performed on the training (TGCA) dataset. Gene expression significantly associated with overall survival (OS) in the training dataset was selected for further analysis, with a threshold of P<0.001. Random forest variable hunting was performed using 100 replications and 100 steps to select the most significant candidate genes, including zinc finger protein 230 (ZNF230), BCL2-like 14 (BCL2L14), AHNAK, transmembrane protein 109 (TMEM109), apolipoprotein L2 (APOL2), advanced glycation end-product specific receptor (AGER) and amine oxidase, copper containing 2 (AOC2).
Multivariate Cox regression analysis was implemented to calculate the risk score using the candidate genes and overall survival information. Risk score was calculated using the following formula; where βi indicates the coefficients evaluated with gene expression and xi refers to gene relative expression level.
Coefficients were locked to calculate the risk scores of the three test datasets.
Statistical analysis
All statistical analysis in this study was performed with R (version 3.0.1; https://www.r-project.org/) and R packages. Normalization of raw data was performed using the ‘affy’ package (v1.56.0) (9), the survival analysis and Cox probability hazard analyses were performed using the ‘survival’ (v1.4–8) package, random forest variable hunting was performed using the ‘randomForestSRC’ package (v2.0.5) (10) and the receiving operating characteristic (ROC) curves were drawn using the ‘pROC’ package (v1.11.0) (11). The gene set enrichment analysis (GSEA) was performed using Java GSEA software (http://software.broadinstitute.org/gsea/index.jsp) (v5.2) (12).
Results
Risk score staging system
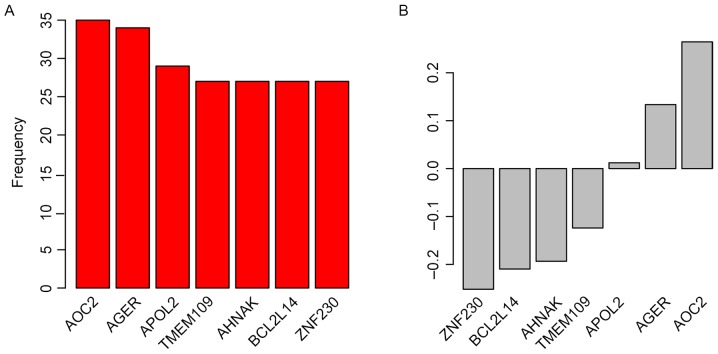
Candidate genes for the staging system were selected by Univariate Cox regression analysis between gene expression and OS in the ‘TCGA Bladder Cancer (BLCA)’ dataset. Random forest variable hunting was implemented to select the most suitable combination of candidate genes; 7 genes were identified (Fig. 1A). Multivariate Cox regression analysis was performed and coefficients were calculated. The risk score of each patient was calculated using the following formula: Risk score=(0.012050982× ZNF230) + (−0.124027149× BCL2L14) + (−0.251893959× AHNAK) + (0.264530911× TMEM109) + (0.133540278× APOL2) + (−0.19351212× AGER) + (−0.209706035× AOC2); where gene name represents the Z-score for that gene. Parameters for each gene are detailed in Table I. Genes with positive coefficients indicate genes identified as cancer drivers, whereas genes with negative coefficients were identified as tumor suppressor genes (Fig. 1B).
Figure 1.
Candidate genes identified by random forest variable hunting, including (A) the frequency and (B) the coefficients of each gene. AOC2, amine oxidase; AGER, advanced glycation end-product specific receptor; APOL2, apolipoprotein L2; copper containing 2; TMEM109, transmembrane protein 109; BCL2L14, BCL2-like 14; ZNF230, zinc finger protein 230.
Table I.
Analysis of the candidate genes with univariate and multivariate Cox regression.
| Univariate | Multivariate | |||||
|---|---|---|---|---|---|---|
| Gene | HR | 95% CI | P-value | HR | 95% CI | P-value |
| TMEM109 | 1.50 | 1.50–1.30 | <0.001 | 1.30 | 1.08–1.57 | 0.005 |
| AHNAK | 1.40 | 1.40–1.20 | <0.001 | 1.14 | 0.95–1.37 | 0.152 |
| BCL2L14 | 0.76 | 0.76–0.68 | <0.001 | 0.82 | 0.73–0.93 | 0.003 |
| AOC2 | 0.79 | 0.79–0.69 | <0.001 | 1.01 | 0.85–1.2 | 0.890 |
| ZNF230 | 0.73 | 0.73–0.62 | <0.001 | 0.81 | 0.69–0.96 | 0.015 |
| AGER | 0.77 | 0.77–0.68 | <0.001 | 0.88 | 0.75–1.04 | 0.133 |
| APOL2 | 0.73 | 0.73–0.63 | <0.001 | 0.78 | 0.67–0.9 | 0.001 |
HR, hazard ratio; CI, confidence interval; TMEM109, transmembrane protein 109; BCL2L14, BCL2-like 14; AOC2, amine oxidase, copper containing 2; ZNF230, zinc finger protein 230; AGER, advanced glycation end-product specific receptor; APOL2, apolipoprotein L2.
Risk score predicts survival in the training dataset
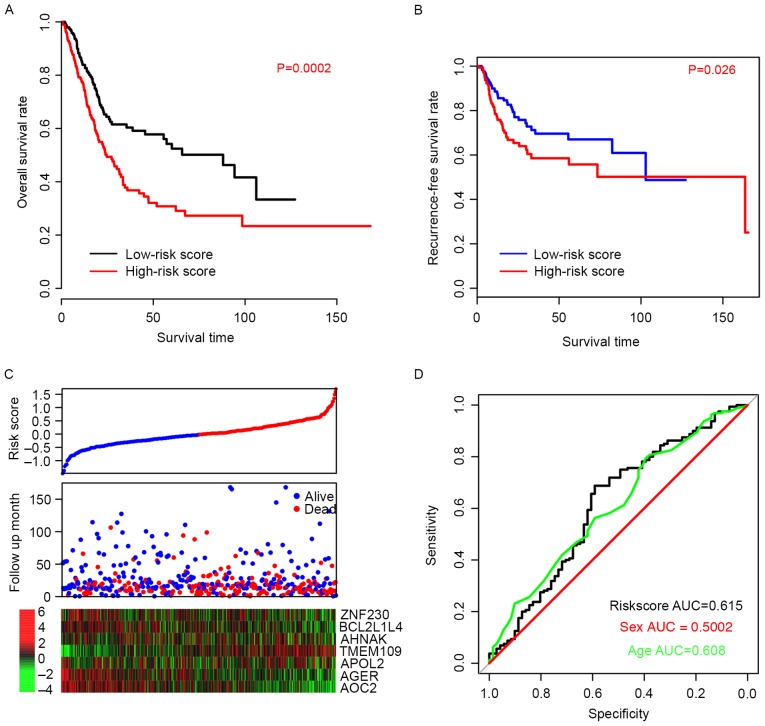
The efficiency of the risk score in predicting the outcome of BLCA patients was evaluated. Using the median risk score value as a cutoff, patient data from the TCGA dataset was divided into high-risk and low-risk groups. The OS time of patients in the high-risk group was significantly longer than patients in the low-risk group (P=0.0002; Fig. 2A). The median survival of high-risk patients was 24.6 months (95% CI; 20–33.5 months) whereas the median survival of low-risk patients was 88 months (95% CI; 45.6-NA months). Furthermore, the recurrence-free survival (RFS) time was also compared between the high- and low-risk groups, and the resulting profiles resembled those of OS (P=0.026; Fig. 2B). Patients with high-risk scores were more prone to early relapse, and the expression pattern was consistent with the coefficients of each gene (Fig. 2C). The ROC curve for three-year events was also plotted based on age, sex and risk score (Fig. 2D) and the area under curve (AUC) was 0.608, 0.500, and 0.615, respectively. These results suggest that the risk score staging system performed better in predicting the survival of BLCA patients than other clinical information.
Figure 2.
Risk score predicts survival in the training dataset. (A) Overall survival and (B) recurrence-free survival rates were significantly higher in the low-risk score groups than in the high-risk score group. (C) Overall survival outcomes of the patients. (D) Sensitivity, specificity and associated AUC of the 7-gene model for the training dataset, compared with age and sex. AUC, area under curve.
Validation of performance of risk score in test datasets
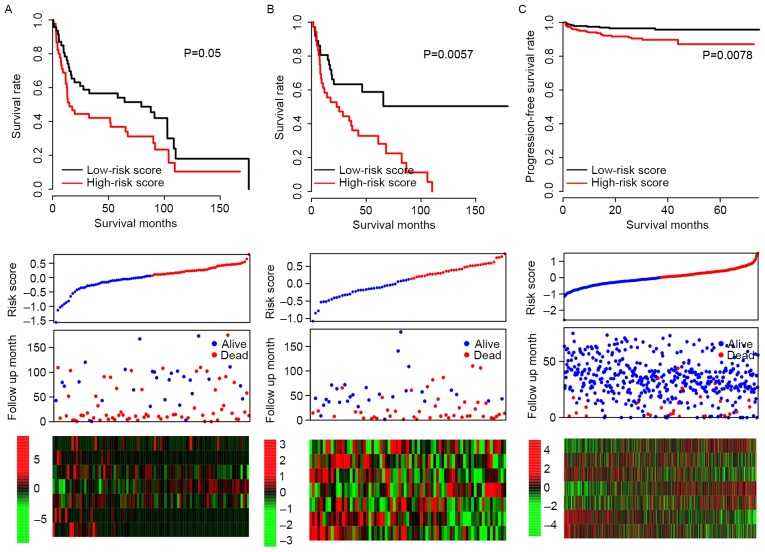
It was possible that the model may have overfit to the training dataset; in order to test the robustness of the model, subsequent to locking the coefficients for each gene, risk scores of all patients in three independent test datasets (GSE31684, GSE48075 and E-MTAB-4321) were evaluated, and the median risk score value of each dataset was used as a cutoff. Consistent with the OS profile in the training dataset, the OS rate of the high-risk group was significantly lower than that of the low-risk group in both GSE31684 and GSE48075 datasets (P=0.050 and P=0.006, respectively; Fig. 3A and B). The progression-free survival curve for E-MTAB4321 resembled the RFS curve for the training dataset (P=0.0078; Fig. 3C) and the expression patterns of the 7 genes in the GSE31684, GSE48075 and E-MTAB-4321 datasets were also similar to the training dataset. These results indicate that the risk score staging system is robust across datasets.
Figure 3.
Validation of risk score in 3 independent data sets. The overall survival stratified by the high and low-risk score groups was plotted for the (A) GSE31684 and (B) GSE48075 datasets. (C) Progression-free survival stratified by high and low-risk score groups for the E-TABM-4321 dataset. Detailed risk scores, survival information and heat maps of gene expression are also included for each dataset.
Association between risk score, clinical information
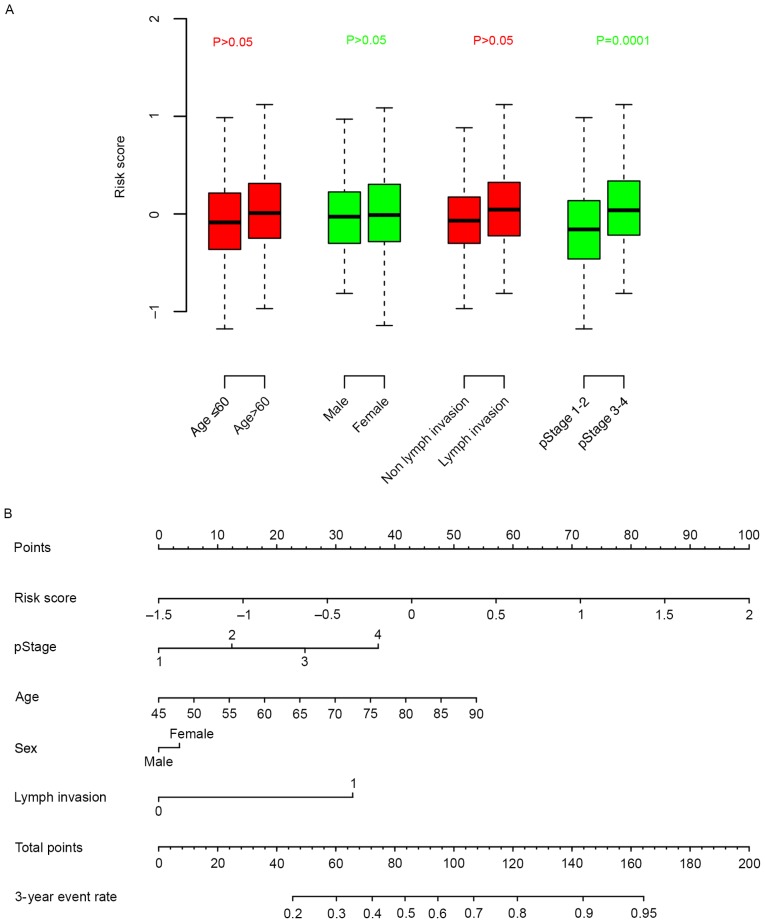
The association between clinical information and risk score was calculated. It was observed that the risk score was independent from age, sex and lymph invasion, but significantly associated with pathological stage (Fig. 4A). A nomogram for three-year survival, considering pathological stage, age, sex and lymph invasion status, was plotted against risk score (Fig. 4B). According to the nomogram, the risk score ranged the most (from 0–100), indicative of the relative accuracy of the risk score staging system.
Figure 4.
The association between clinical information and the risk score (A) Box plots illustrating the association of age, sex, lymph invasion status and cancer stage with risk score. (B) A nomogram comparing clinical parameters with risk score. pStage, pathological stage.
Discussion
The prognostic value of clinical information, including tumor-node-metastasis staging and age, is currently unreliable for BLCA (13–15). Therefore, an effective molecular prognostic biomarker is required to guide the therapy and follow up of patients with BLCA. Various singular molecular markers for prognosis have been suggested (16–19) but the clinical power that they have demonstrated across datasets is unsatisfactory. In contrast, the predictive effect of multiple genes has been highlighted as a tool of greater potential (11,20–23). In the present study, a gene expression and multivariate Cox regression analysis-based model performed well in the prognosis of 1,049 samples in four independent datasets. The risk score calculated in this model may therefore be suitable for determining the prognosis of patients with BLCA.
Of the 7 genes in the model, BCL2L14 has previously been associated with carcinogenesis (24) and a single-nucleotide polymorphism in this gene has been associated with lung cancer (25). The role of AHNAK is controversial between different types of cancer (26); AHNAK has been reported to be downregulated in melanoma and its low expression associated with reduced survival time (27), whereas the high expression of AHNAK is reported to be associated with cell migration and invasion in mesothelioma (28). To the best of our knowledge, the remaining genes, ZNF230, TMEM109, APOL2, AGER and AOC2, have not been associated with prognostic value prior to the present study.
The clinical application of risk score is feasible as the quantification of gene expression in cancer tissue is time-efficient, and the risk score model can be applied to data from various platforms. However, the present study is constrained by certain limitations. The study is retrospective, thus important clinical information, including BLCA subtypes and muscle invasiveness were not included, and other types of survival information, including progression-free, recurrence-free and metastasis-free survival, were not directly predicted by the model.
In summary, the risk score model constructed in this study is robust and performed effectively in predicting the survival of BLCA patients. The model has potential to be developed as a BCLA prognostic tool.
Acknowledgements
Not applicable.
Funding
No funding received.
Availability of data and materials
Raw data was obtained from Gene Expression Omnibus (https://www.ncbi.nlm.nih.gov/geo) and Array Express (www.ebi.ac.uk/arrayexpress/). Probes were matched to the HUGO Gene (https://www.genenames.org/).
Authors' contributions
JC performed data processing and analysis. FL wrote the manuscript. NL and FL were responsible for the collection of the relevant literature. All authors have read and approved the final manuscript.
Ethics approval and consent to participate
Not applicable.
Consent for publication
Not applicable.
Competing interests
The authors declare that they have no competing interests.
References
- 1.Siegel RL, Miller KD, Jemal A. Cancer statistics, 2016. CA Cancer J Clin. 2016;66:7–30. doi: 10.3322/caac.21332. [DOI] [PubMed] [Google Scholar]
- 2.Siegel R, Miller K, Jemal A. Cancer statistics, 2015. CA Cancer J Clin. 2015;65:5–29. doi: 10.3322/caac.21254. [DOI] [PubMed] [Google Scholar]
- 3.Funt SA, Rosenberg JE. Systemic, perioperative management of muscle-invasive bladder cancer and future horizons. Nat Rev Clin Oncol. 2017;14:221–234. doi: 10.1038/nrclinonc.2016.188. [DOI] [PMC free article] [PubMed] [Google Scholar]
- 4.Santoni M, Catanzariti F, Minardi D, Burattini L, Nabissi M, Muzzonigro G, Cascinu S, Santoni G. Pathogenic and diagnostic potential of BLCA-1 and BLCA-4 nuclear proteins in urothelial cell carcinoma of human bladder. Adv Urol. 2012;2012:397412. doi: 10.1155/2012/397412. [DOI] [PMC free article] [PubMed] [Google Scholar]
- 5.Salomaa V, Havulinna A, Saarela O, Zeller T, Jousilahti P, Jula A, Muenzel T, Aromaa A, Evans A, Kuulasmaa K, Blankenberg S. Thirty-one novel biomarkers as predictors for clinically incident diabetes. PLoS One. 2010;5:e10100. doi: 10.1371/journal.pone.0010100. [DOI] [PMC free article] [PubMed] [Google Scholar]
- 6.Izadi F, Zarrini HN, Kiani G, Jelodar NB. A comparative analytical assay of gene regulatory networks inferred using microarray and RNA-seq datasets. Bioinformation. 2016;12:340–346. doi: 10.6026/97320630012340. [DOI] [PMC free article] [PubMed] [Google Scholar]
- 7.Deandrés-Galiana EJ, Fernández-Martínez JL, Saligan LN, Sonis ST. Impact of microarray preprocessing techniques in unraveling biological pathways. J Comput Biol. 2016;23:957–968. doi: 10.1089/cmb.2016.0042. [DOI] [PMC free article] [PubMed] [Google Scholar]
- 8.Colantuoni C, Henry G, Zeger S, Pevsner J. SNOMAD (Standardization and NOrmalization of MicroArray Data): web-accessible gene expression data analysis. Bioinformatics. 2002;18:1540–1541. doi: 10.1093/bioinformatics/18.11.1540. [DOI] [PubMed] [Google Scholar]
- 9.Gautier L, Cope L, Bolstad BM, Irizarry RA. Affy-analysis of Affymetrix GeneChip data at the probe level. Bioinformatics. 2004;20:307–315. doi: 10.1093/bioinformatics/btg405. [DOI] [PubMed] [Google Scholar]
- 10.Dazard JE, Choe M, LeBlanc M, Rao JS. R package PRIMsrc: Bump hunting by patient rule induction method for survival, regression and classification. Proc Am Stat Assoc. 2015;2015:650–664. [PMC free article] [PubMed] [Google Scholar]
- 11.Robin X, Turck N, Hainard A, Tiberti N, Lisacek F, Sanchez JC, Müller M. pROC: An open-source package for R and S+ to analyze and compare ROC curves. BMC bioinformatics. 2011;12:77. doi: 10.1186/1471-2105-12-77. [DOI] [PMC free article] [PubMed] [Google Scholar]
- 12.Subramanian A, Tamayo P, Mootha VK, Mukherjee S, Ebert BL, Gillette MA, Paulovich A, Pomeroy SL, Golub TR, Lander ES, Mesirov JP. Gene set enrichment analysis: A knowledge-based approach for interpreting genome-wide expression profiles. Proc Natl Acad Sci USA. 2005;102:15545–15550. doi: 10.1073/pnas.0506580102. [DOI] [PMC free article] [PubMed] [Google Scholar]
- 13.Zhao M, He XL, Teng XD. Understanding the molecular pathogenesis and prognostics of bladder cancer: An overview. Chin J Cancer Res. 2016;28:92–98. doi: 10.3978/j.issn.1000-9604.2016.02.05. [DOI] [PMC free article] [PubMed] [Google Scholar]
- 14.Dadhania V, Czerniak B, Guo CC. Adenocarcinoma of the urinary bladder. Am J Clin Exp Urol. 2015;3:51–63. [PMC free article] [PubMed] [Google Scholar]
- 15.Boustead GB, Fowler S, Swamy R, Kocklebergh R, Hounsome L. Stage, grade and pathological characteristics of bladder cancer in the UK: British association of urological surgeons (BAUS) urological tumour registry. BJU Int. 2014;113:924–930. doi: 10.1111/bju.12468. [DOI] [PubMed] [Google Scholar]
- 16.Hong Z, Li H, Li L, Wang W, Xu T. Different expression patterns of histone H3K27 demethylases in renal cell carcinoma and bladder cancer. Cancer Biomark. 2017;18:125–131. doi: 10.3233/CBM-160003. [DOI] [PubMed] [Google Scholar]
- 17.Nandagopal L, Sonpavde G. Circulating biomarkers in bladder cancer. Bladder Cancer. 2016;2:369–379. doi: 10.3233/BLC-160075. [DOI] [PMC free article] [PubMed] [Google Scholar]
- 18.Yang J, Platt LT, Maity B, Ahlers KE, Luo Z, Lin Z, Chakravarti B, Ibeawuchi SR, Askeland RW, Bondaruk J, et al. RGS6 is an essential tumor suppressor that prevents bladder carcinogenesis by promoting p53 activation and DNMT1 downregulation. Oncotarget. 2016;7:69159–69172. doi: 10.18632/oncotarget.12473. [DOI] [PMC free article] [PubMed] [Google Scholar]
- 19.Wang J, Zhang X, Wang L, Dong Z, Du L, Yang Y, Guo Y, Wang C. Downregulation of urinary cell-free microRNA-214 as a diagnostic and prognostic biomarker in bladder cancer. J Surg Oncol. 2015;111:992–999. doi: 10.1002/jso.23937. [DOI] [PubMed] [Google Scholar]
- 20.Gogalic S, Sauer U, Doppler S, Heinzel A, Perco P, Lukas A, Simpson G, Pandha H, Horvath A, Preininger C. Validation of a protein panel for the non-invasive detection of recurrent non-muscle invasive bladder cancer. Biomarkers. 2017;22:674–681. doi: 10.1080/1354750X.2016.1276628. [DOI] [PubMed] [Google Scholar]
- 21.Urquidi V, Netherton M, Gomes-Giacoia E, Serie DJ, Eckel-Passow J, Rosser CJ, Goodison S. A microRNA biomarker panel for the non-invasive detection of bladder cancer. Oncotarget. 2016;7:86290–86299. doi: 10.18632/oncotarget.13382. [DOI] [PMC free article] [PubMed] [Google Scholar]
- 22.Li Y, Huang J, Sun J, Xiang S, Yang D, Ying X, Lu M, Li H, Ren G. The transcription levels and prognostic values of seven proteasome alpha subunits in human cancers. Oncotarget. 2017;8:4501–4519. doi: 10.18632/oncotarget.13885. [DOI] [PMC free article] [PubMed] [Google Scholar]
- 23.Kavalieris L, O'Sullivan P, Frampton C, Guilford P, Darling D, Jacobson E, Suttie J, Raman JD, Shariat SF, Lotan Y. Performance characteristics of a multigene urine biomarker test for monitoring for recurrent urothelial carcinoma in a multicenter study. J Urol. 2017;197:1419–1426. doi: 10.1016/j.juro.2016.12.010. [DOI] [PubMed] [Google Scholar]
- 24.Lin ML, Park JH, Nishidate T, Nakamura Y, Katagiri T. Involvement of maternal embryonic leucine zipper kinase (MELK) in mammary carcinogenesis through interaction with Bcl-G, a pro-apoptotic member of the Bcl-2 family. Breast Cancer Res. 2007;9:R17. doi: 10.1186/bcr1650. [DOI] [PMC free article] [PubMed] [Google Scholar]
- 25.Spitz MR, Gorlov IP, Dong Q, Wu X, Chen W, Chang DW, Etzel CJ, Caporaso NE, Zhao Y, Christiani DC, et al. Multistage analysis of variants in the inflammation pathway and lung cancer risk in smokers. Cancer Epidemiol Biomarkers Prev. 2012;21:1213–1221. doi: 10.1158/1055-9965.EPI-12-0352-T. [DOI] [PMC free article] [PubMed] [Google Scholar]
- 26.Davis TA, Loos B, Engelbrecht AM. AHNAK: The giant jack of all trades. Cell Signal. 2014;26:2683–2693. doi: 10.1016/j.cellsig.2014.08.017. [DOI] [PubMed] [Google Scholar]
- 27.Sheppard HM, Feisst V, Chen J, Print C, Dunbar PR. AHNAK is downregulated in melanoma, predicts poor outcome, and may be required for the expression of functional cadherin-1. Melanoma Res. 2016;26:108–116. doi: 10.1097/CMR.0000000000000228. [DOI] [PMC free article] [PubMed] [Google Scholar]
- 28.Sudo H, Tsuji AB, Sugyo A, Abe M, Hino O, Saga T. AHNAK is highly expressed and plays a key role in cell migration and invasion in mesothelioma. Int J Oncol. 2014;44:530–538. doi: 10.3892/ijo.2013.2183. [DOI] [PubMed] [Google Scholar]
Associated Data
This section collects any data citations, data availability statements, or supplementary materials included in this article.
Data Availability Statement
Raw data was obtained from Gene Expression Omnibus (https://www.ncbi.nlm.nih.gov/geo) and Array Express (www.ebi.ac.uk/arrayexpress/). Probes were matched to the HUGO Gene (https://www.genenames.org/).


