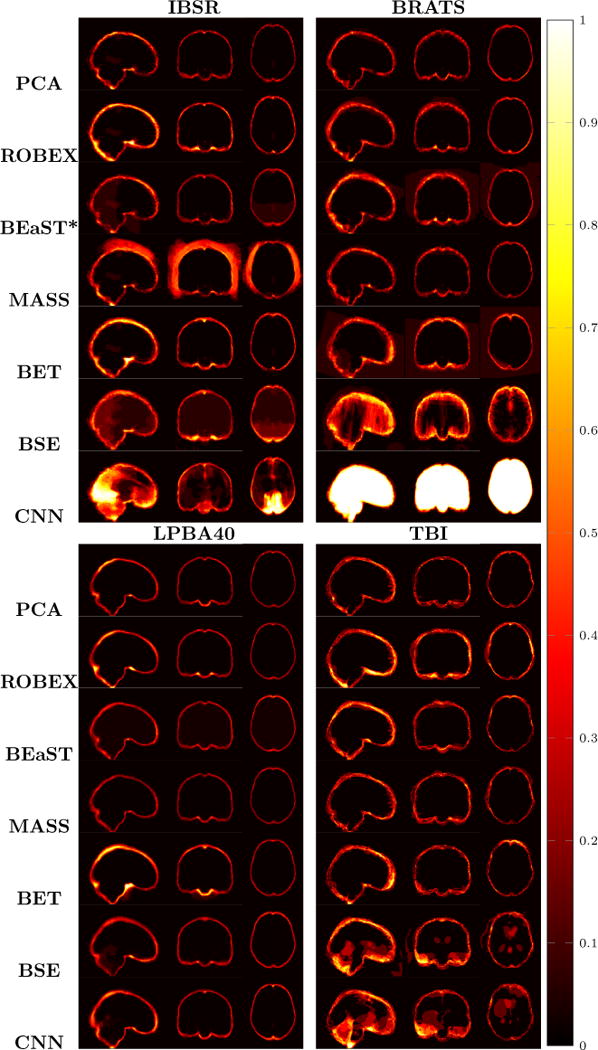
Figure 9.

Examples of 3D volumes of average errors for the normal IBSR and LPBA40 datasets, as well as for the pathological BRATS and TBI datasets. For IBSR/BRATS, we show results for BEaST*. Images and their brain masks are first affinely aligned to the atlas. At each location we then calculate the proportion of segmentation errors among all the segmented cases of a dataset (both over- and under-segmentation errors). Lower values are better (a value of 0 indicates perfect results over all images) and higher values indicate poorer performance (a value of 1 indicates failure on all cases). Clearly, BSE and CNN struggle with the BRATS dataset whereas our PCA method shows good performance across all datasets.
