

Abstract
Hormone-binding protein (HBP) is a kind of soluble carrier protein and can selectively and non-covalently interact with hormone. HBP plays an important role in life growth, but its function is still unclear. Correct recognition of HBPs is the first step to further study their function and understand their biological process. However, it is difficult to correctly recognize HBPs from more and more proteins through traditional biochemical experiments because of high experimental cost and long experimental period. To overcome these disadvantages, we designed a computational method for identifying HBPs accurately in the study. At first, we collected HBP data from UniProt to establish a high-quality benchmark dataset. Based on the dataset, the dipeptide composition was extracted from HBP residue sequences. In order to find out the optimal features to provide key clues for HBP identification, the analysis of various (ANOVA) was performed for feature ranking. The optimal features were selected through the incremental feature selection strategy. Subsequently, the features were inputted into support vector machine (SVM) for prediction model construction. Jackknife cross-validation results showed that 88.6% HBPs and 81.3% non-HBPs were correctly recognized, suggesting that our proposed model was powerful. This study provides a new strategy to identify HBPs. Moreover, based on the proposed model, we established a webserver called HBPred, which could be freely accessed at http://lin-group.cn/server/HBPred.
Keywords: Hormone-binding protein, Benchmark dataset, Dipeptide composition, Feature selection, Webserver
Introduction
Hormone-binding proteins (HBPs) are proteins that selectively and non-covalently bind to hormone (as shown in Figure 1) and carry hormone to target tissues to produce a desired effect 1. HBPs were first recognized in plasma of pregnant mouse, rabbit and man a decade ago. They are associated with the regulation of the hormone supply in the circulatory system and affect the metabolism or behavior of other cells possessing functional receptors for the hormone. The sex HBPs produced mainly in the liver bind to sex steroid hormones and thereby regulate their bioavailability 2. The abnormal expression of HBPs always causes various diseases3. Thus, it is important to clarify the function of HBPs and their regulation mechanisms.
Figure 1.

Schematic diagram of human growth hormone (red) binding to two HBPs (yellow) 4
The first step to study HBPs' function is to accurately identify HBPs. However, with more and more proteins generated in the postgenomic age, it is difficult to determine HBPs with biochemical experiments due to expensive experimental materials and long experimental period. Computational methods are a good choice for timely and accurately identifying HBPs. Several machine learning methods, such as support vector machine (SVM), Mahalanobis discriminant (MD), increment of diversity (ID), neural network (NN) and random forest (RF), have been widely used in immunoglobulin prediction 5, apolipoprotein prediction 6, cell-penetrating peptides prediction 7, protein subcellular localization 8-14, conotoxin classification 15-17, ion channel prediction 18, 19, protein structure prediction 20-25, promoter prediction 26, 27, prediction of the origin of replication 28, 29 and the prediction of protein, DNA and RNA modification sites 30-33. These methods do provide a great convenience to scholars. However, to the best of our knowledge, there is no computational method for HBP identification. The study aims to develop a new predictor for identifying HBPs.
According to previous comprehensive methods 34, the following five steps were conducted in this work to establish a statistical predictor for HBP identification. Firstly, functional HBPs were selected to construct a valid benchmark dataset to train and test the proposed method. Secondly, dipeptide composition which could truly reflect the residue correlation was extracted to formulate the protein samples. Thirdly, analysis of various (ANOVA)-based technique was used to rank these features. Fourthly, a widely used engine in bioinformatics, support vector machine, was selected to perform the prediction. Fifthly, the jackknife cross-validation was then used to objectively evaluate the anticipated accuracy of the predictor. In addition, based on the proposed model, we established a user-friendly web-server called HBPred for the identification of HBPs. These steps are introduced below.
Materials and Methods
Benchmark Dataset
In a statistical predictor, enough related functional data should be collected to obtain prior knowledge. Thus, it is important to construct an objective benchmark dataset to guarantee the robustness of the model. However, to our knowledge, no database for HBP was published. Thus, we searched and collected HBPs from the Universal Protein Resource (UniProt) 35, which provide a stable, comprehensive, and freely accessible central resource of protein sequences and functional annotations. Firstly, we selected the hormone-binding keyword in molecular function item of Gene Ontology (GO) to generate original HBP dataset. Then, a total of 2460 HBPs were obtained. Subsequently, in order to improve the reliability of the dataset, the 2104 HBPs which were not manually annotated or reviewed were excluded. Finally, in order to avoid the redundancy which affected the accuracy estimation of the prediction model, we used CD-HIT 36, which had been widely used to cluster and compare protein or nucleotide sequences, to remove highly similar HBP sequences by setting the cutoff threshold to 0.6. In fact, a more objective dataset could be produced when the cutoff threshold was set to 0.25. However, in this study, we did not use such a stringent criterion because the currently available data did not allow the strict criterion. Otherwise, the number of proteins would be too few to have statistical significance. As a result, a total of 123 HBPs were obtained and regarded as positive data. As a control, non-HBPs were obtained by using the similar selection strategy. For the purpose of keeping a balance between positive data and negative data and providing an objective evaluation model, 123 non-HBPs were randomly selected from UniProt as negative data. The identity between any two sequences in non-HBPs was also less than 60%. The positive and negative datasets can be formulated as
 , ,
|
(1) |
where the subset  contains 123 HBPs;
  contains 123 samples of non-HBPs; the symbol ⋃ represents the union in the set theory. All the data can be obtained from our website http://lin-group.cn/server/HBPred/download.html.
Sample descriptions
For a HBP P with L residues, how do we translate it into a mathematical expression for statistical prediction? This is the second important step to develop a predictor for identifying HBP. Based on a widely accepted viewpoint that the protein sequence contains key information which could determine the protein's structure and function, we extracted the features from the primary sequence of HBPs and non-HBPs. The most straightforward method is to formulate a HBP P with L residues by using the residue sequence as:
| P=R1 R2 R3 R4 … RL, | (2) |
where R1 represents the 1st residue of the HBP; R2 the 2nd residue of the protein, and so forth.
A straightforward method to perform statistical prediction is to utilize the search tools based on sequence similarity, such as FASTA and BLAST. However, when there is no similar sequence in the training dataset for a query HBP, the similarity-based method fails. Machine learning methods can overcome such disadvantage. However, in these machine learning-based methods, protein samples should be translated into vectors with the same dimension. Generally, a simple vector used to represent a protein sample is its amino acid composition (AAC) or residue composition:
 , ,
|
(3) |
where T is the transpose operator;  is the normalized occurrence frequency of the i-th type of native residue in the protein chain and can be calculated as
 ; ;
|
(4) |
where  is the occurrence number of i-th residue in the protein P.
The AAC feature has been widely used in protein bioinformatics 12, 37-39. However, AAC feature does not contain the sequence order information so that the prediction quality is always far from satisfactory. To include the correlation information between two residues, we consider the dipeptide composition which describes the correlation between two most contiguous amino acid residues. Thus, a HBP P can be expressed as a 400-dimensional vector (20×20=400):
 , ,
|
(5) |
where the component 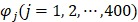 and T is the transpose operator. Each component is given by
 , ,
|
(6) |
where A, C, …, W, and Y are respectively the single letter codes of 20 native amino acids;  is the occurrence number for the dipeptide AA in the protein sequence (Eq. (2));
  for the dipeptide AC, and so forth.
Feature ranking technique
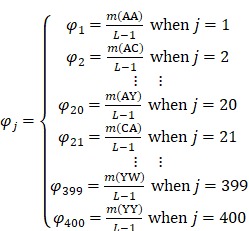
From Eqs. (5-6), a total of 400 dipeptide frequencies were calculated. In previous studies 40-46, some features were noise or redundant information. In fact, in statistical learning, for high-dimensional features, it is widely accepted that many features have no or even negative contribution to the classification. Thus, it is necessary to rank the features and evaluate the contribution of every feature to the classification. According to the statistical theory, ANOVA can be used to investigate the statistical significance of ratio of between groups variance and within groups variance 47. Thus, the ratio called F-score is used to describe the contribution of each feature as:
 , ,
|
(7) |
where  ,
,  , and
, and  are the means of dipeptide k frequencies in all samples, HBP samples and non-HBP samples, respectively. Thus, the numerator and denominator in Eq. (7) denote the variances between groups and within groups, respectively. It is obvious that the larger the F(k) is, the better prediction capability the feature k has. Thus, the 400 dipeptides can be ranked according to their F-scores.
Support vector machine (SVM)
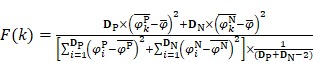
In the construction of a predictor of HBPs, the third important step is to discriminate HBPs from non-HBPs with a powerful predictive algorithm. The powerful and popular SVM in bioinformatics 48-56 was utilized in the study. The method was developed by Vapnik and his colleagues based on the statistical learning theory 57. By projecting samples with low-dimensional feature into a high-dimension Hilbert space, it searches and constructs a separating hyperplane which could classify positive and negative samples with the maximal margin in the space by using the decision function:
 , ,
|
(8) |
where  is the i-th training vector;
  represents the type of the i-th training vector;
  is called a kernel function which defines an inner product in a high dimensional feature space. The radial basis kernel function (RBF) defined as
 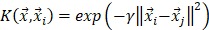 was used in the work because it was more suitable for nonlinear classification than other kernel functions. A free software package LibSVM, which could be freely downloaded from http://www.csie.ntu.edu.tw/~cjlin/libsvm
58, was used to implement the SVM. Grid search was performed with a miscellaneous tool based on LIBSVM called grid.py for optimizing the regularization parameter C and kernel parameter
was used in the work because it was more suitable for nonlinear classification than other kernel functions. A free software package LibSVM, which could be freely downloaded from http://www.csie.ntu.edu.tw/~cjlin/libsvm
58, was used to implement the SVM. Grid search was performed with a miscellaneous tool based on LIBSVM called grid.py for optimizing the regularization parameter C and kernel parameter  . The search spaces for C and
  are:
are:
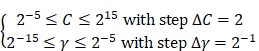 , ,
|
(9) |
where  and
and  denote the step gaps for C and
  , respectively.
Performance Evaluation
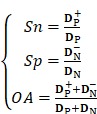
A suitable statistical test is extremely important in the performance evaluation of the proposed model. In the study, the jackknife cross-validation test is used to evaluate the proposed model because it is more suitable for small sample sizes and always yields a unique result for a given benchmark dataset 59-62. The following three indexes called Sensitivity (Sn), Specificity (Sp) and Overall Accuracy (OA) were used:
 |
(10) |
where  and
and  are the number of the correctly identified HBPs (also called true positives) and the number of the correctly identified non-HBPs (also called true negatives), respectively.
Results
Prediction Performance
We firstly investigated the prediction performance of 400 dipeptide compositions on the discrimination between HBPs and non-HBPs through the jackknife cross-validation test. We found that the overall accuracy reached maximum (75.6%) when C=2 and  .
.
Generally, high-dimensional features contain more information for HBPs. However, these features also contain noise or redundant information, which results in the poor predictive capabilities on HBP prediction in the cross-validation test 11. We thought that the HBP prediction accuracy could be further improved by noise exclusion. Therefore, we used ANOVA-based feature selection technique to find out the best feature subset which produced the maximum accuracy for distinguishing HBPs from non-HBPs. The F-scores of 400 dipeptides were calculated according to Eq. (7). Then, we ranked the 400 dipeptides according to the decreasing order of their F-scores:
 , ,
|
(11) |
where the  is the first dipeptide with the maximum F-score;
  is the second dipeptide with the second maximum F-score;
  is the third dipeptide with the third maximum F-score and so forth; T is the transpose operator.
Subsequently, we utilized the incremental feature selection (IFS) strategy 5, 18, 19 to find out the optimal features which are the best for HBP prediction based on the following steps. Firstly, we obtained 400 feature subsets. The first feature subset only contained the first dipeptide in the ranked set D and arbitrary sample can be formulated as  . The second feature subset contains the first and second dipeptides in the ranked set and arbitrary sample can be formulated as
  , and so on. It is obvious that the 400th feature subset contains 400 dipeptides whose accuracy has been achieved above. Secondly, all the 400 feature subsets were inputted into SVM for classification. The jackknife cross-validation test was used to evaluate all 400 models. A total of 400 OAs were obtained. The maximum OA can be easily observed by plotting the ISF curve in Figure 2. When the top 73 dipeptides were used as inputs, the maximum OA of 84.9% could be obtained. We also noticed that the 86th feature subset could also produce the OA of 84.9% in the jackknife cross-validation test (Blue dot in Figure 2). Here, we used the 73th feature subset to construct the final prediction model because it contained fewer features than the 86th feature subset. These 73 dipeptides had the higher F-scores, meaning that they had the high confidence level and could give more reliable information for classification. In addition, we investigated the Sn and Sp, which were 88.6% and 81.3%, respectively. The parameters C and
  were 8 and 0.03125, respectively.
Figure 2.

IFS curve for discriminating HBPs from non-HBPs. When the top 73 dipeptides were used to perform prediction, the overall success rate (Red dot) reaches an IFS peak of 84.9% in jackknife cross-validation. Another IFS peak (Blue dot) is observed when the abscissa is 86 (namely, 86 features). The green dot denotes the results obtained with 20 features.
In general, the dipeptides with high F-score give more reliable information for classification. Thus, we extracted the top 20 dipeptides with the maximum F-score to investigate their performance on HBP prediction. The OA reached 80.1% in jackknife cross-validation test (Green dot in Figure 2). However, the number of features is too small to provide enough information, thus resulting in the poor performance of 20 best dipeptides compared with 73 best dipeptides.
Feature analysis
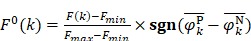
To provide a visible and direct analysis on the contributions of different dipeptides in the prediction model, we drew a heat map (Figure 3) representing a matrix in which the elements represented the features and were encoded with different colors according to their  defined as 6, 47
Figure 3.

Heat map or chromaticity diagram for the F-scores of the 400 dipeptides. Red elements indicate the dipeptides enriched in HBPs, whereas blue elements indicate the dipeptides enriched in non-HBPs.
 , ,
|
(12) |
where Fmin and Fmax are the minimum and maximum F-scores of the 400 dipeptides;  and
and  are the average frequencies of the kth dipeptide in HBP dataset and non-HBP dataset, respectively; sgn is the sign function. Thus, the upper limit and lower limit of
  are 1 and -1, respectively. The first and second residues of 400 dipeptides are respectively listed in the row and column of the heat map. It is obvious that if
  , the kth dipeptide prefers HBP, otherwise it prefers non-HBP. In Figure 3, the dipeptides in red and blue boxes are positively and negatively correlated with HBPs, respectively. The redder the element is, the more highly relevant with HBPs it is, and vice versa. From the figure, we found that HBPs contained the more abundant residues of Cys (C), His (H), Lys (K), Thr (T), Asn (N) and Arg (R) (red) than non-HBPs, whereas non-HBPs contained the more abundant residues of Leu (L), Phe (F), Trp (W), and Tyr (Y) (blue).
Discussion
The purpose of the work is to develop a powerful tool to accurately recognize HBPs. Currently, the approaches for protein function prediction mainly contain two kinds of strategies. The one is based on similarity search. Another is on the basis of machine learning method. In the first strategy, the query sequence is aligned with the sequences in benchmark dataset to find out highly similar sequences or homologues. Some famous tools such as BLAST and FASTA are generally used to perform the sequence alignment. Their advantage is not affected by sequence length. Although this kind of sequence model is straightforward and intuitive, unfortunately, it fails when a query sequence does not have significant similarity to any of the peptide sequences in the training dataset.
The machine learning-based method can overcome the disadvantage by transferring any sequence into a vector with the same dimension. Many feature models, such as amino acid composition (AAC) 37, n-mer peptide composition 8, 50, 63, 64, g-gap dipeptide composition 6, 12, 47, and pseudo amino acid composition (PseAAC) 5, 9, 10, 43, 65, 66, have been proposed to formulate protein sequences. For the purpose of improving protein function prediction, some scholars used Position-Specific Scoring Matrix (PSSM) 3, 67-71 and gene ontology (GO) 72-74 to describe protein samples. Although PSSM and GO always produced the high accuracy for protein classification, formulating protein samples with the methods generally led to significant flaws. PSSM is generated with the software PSI-BLAST 75, a similarity search tool. Therefore, it is necessary to search for a query protein in a big dataset (usually UniProt or SwissProt) by using PSI-BLAST. In most cases, the big dataset contains the query protein. Thus, the cross-validated results with machine learning method are not objective or strict. If the dataset did not contain the query sequence, but there was similar sequence in the dataset, we accepted the cross-validated results. However, it is time-consuming and not necessary to input PSSM into classifier because the BLAST or FASTA can give more accurate and straightforward results. Furthermore, if the dataset did not contain query sequence or similar sequence, the PSSM could not correctly reflect the consensus motif, thus resulting in wrong prediction.
We also thought that GO information was not suitable for the HBP prediction due to the following factors. The GO is designed to describe gene function along three aspects: molecular functions (molecular activities of gene products), cellular components (where gene products are active) and biological processes (pathways and processes of the activities of multiple gene products). The computational approaches of identifying protein type aim to determine protein functions. In other words, our computational approaches should be able to predict the GO information of proteins. If the GO information of one protein or its homologues has been annotated, it is not necessary to predict the function of the protein. Thus, using GO information to predict protein function likes putting the cart before the horse. Besides, the dimension of GO information can increase when new GO node is added. Thus, any old GO-based model cannot handle such feature. Therefore, the two features are not adopted in our model. In fact, the sequence information is the most objective feature in sample descriptions, which also obey the theoretical biology route (also called reverse biology route) that sequence determines structure, and structure determines function.
To provide the convenience for the most of wet-experimental users, a user-friendly web-server called HBPred was established based on above calculations. The web server can be freely accessed at http://lin-group.cn/server/HBPred. The prediction page is shown in Figure 4. One may firstly upload a sequence file or paste protein sequences in the FASTA format into the input box. Then, after clicking the button of “submit”, the predicted results will be obtained.
Figure 4.

HBPred
Conclusion
We constructed an effective predictor to identify HBPs. Encouraging accuracy was achieved. We also discussed why PSSM or GO information was not suitable for HBP prediction. A free webserver could provide convenience to most of wet-experimental scholars 76-80. Thus, finally, we established a new tool, called HBPred, to accurately predict potential novel HBPs. We expect that the tool will help scholars to improve drug development in relevant diseases. In the future, we will perform the prediction on the subtypes of HBPs.
Acknowledgments
This work was supported by the National Nature Scientific Foundation of China (61772119 and 61702430), Applied Basic Research Program of Sichuan Province (No. 2015JY0100 and 14JC0121), the Scientific Research Foundation of the Education Department of Sichuan Province (11ZB122), the Fundamental Research Funds for the Central Universities of China (Nos. ZYGX2015J144; ZYGX2015Z006), the Scientific Research Foundation of the Health Department of Sichuan Province (120373), the Scientific Research Foundation of Luzhou city (2012-S-36).
Author Contributions
H.T. and H.L. conceived and designed the experiments; H.T. analyzed the data and implemented SVM. Y.W.Z established the web-server; H.T. and H.L performed the analysis and wrote the paper. All authors read and approved the final manuscript.
References
- 1.Baumann G. Growth hormone binding protein. The soluble growth hormone receptor. Minerva Endocrinol. 2002;27:265–76. [PubMed] [Google Scholar]
- 2.Ozzola G. Essay of sex hormone binding protein in internal medicine:a brief review. Clin Ter. 2016;167:e127–e9. doi: 10.7417/CT.2016.1956. [DOI] [PubMed] [Google Scholar]
- 3.Kraut JA, Madias NE. Adverse Effects of the Metabolic Acidosis of Chronic Kidney Disease. Adv Chronic Kidney Dis. 2017;24:289–97. doi: 10.1053/j.ackd.2017.06.005. [DOI] [PubMed] [Google Scholar]
- 4.Sundstrom M, Lundqvist T, Rodin J. et al. Crystal structure of an antagonist mutant of human growth hormone, G120R, in complex with its receptor at 2.9 A resolution. J Biol Chem. 1996;271:32197–203. doi: 10.1074/jbc.271.50.32197. [DOI] [PubMed] [Google Scholar]
- 5.Tang H, Chen W, Lin H. Identification of immunoglobulins using Chou's pseudo amino acid composition with feature selection technique. Mol BioSyst. 2016;12:1269–75. doi: 10.1039/c5mb00883b. [DOI] [PubMed] [Google Scholar]
- 6.Tang H, Zou P, Zhang C. et al. Identification of apolipoprotein using feature selection technique. Sci Rep. 2016;6:30441. doi: 10.1038/srep30441. [DOI] [PMC free article] [PubMed] [Google Scholar]
- 7.Tang H, Su ZD, Wei HH. et al. Prediction of cell-penetrating peptides with feature selection techniques. Biochem Biophy Res Commun. 2016;477:150–4. doi: 10.1016/j.bbrc.2016.06.035. [DOI] [PubMed] [Google Scholar]
- 8.Zhu PP, Li WC, Zhong ZJ. et al. Predicting the subcellular localization of mycobacterial proteins by incorporating the optimal tripeptides into the general form of pseudo amino acid composition. Mol BioSyst. 2015;11:558–63. doi: 10.1039/c4mb00645c. [DOI] [PubMed] [Google Scholar]
- 9.Lin H, Ding H, Guo FB. et al. Predicting subcellular localization of mycobacterial proteins by using Chou's pseudo amino acid composition. Protein Pept Let. 2008;15:739–44. doi: 10.2174/092986608785133681. [DOI] [PubMed] [Google Scholar]
- 10.Yang H, Tang H, Chen XX. et al. Identification of Secretory Proteins in Mycobacterium tuberculosis Using Pseudo Amino Acid Composition. BioMed Res Int. 2016;2016:5413903. doi: 10.1155/2016/5413903. [DOI] [PMC free article] [PubMed] [Google Scholar]
- 11.Ding C, Yuan LF, Guo SH. et al. Identification of mycobacterial membrane proteins and their types using over-represented tripeptide compositions. J Proteomics. 2012;77:321–8. doi: 10.1016/j.jprot.2012.09.006. [DOI] [PubMed] [Google Scholar]
- 12.Lin H. The modified Mahalanobis Discriminant for predicting outer membrane proteins by using Chou's pseudo amino acid composition. J Theor Biol. 2008;252:350–6. doi: 10.1016/j.jtbi.2008.02.004. [DOI] [PubMed] [Google Scholar]
- 13.Tang H, Zhang C, Chen R. et al. Identification of Secretory Proteins of Malaria Parasite by Feature Selection Technique. Lett Org Chem. 2017;14:621–4. [Google Scholar]
- 14.Zhang S, Jin J. Prediction of Protein Subcellular Localization by Using λ-Order Factor and Principal Component Analysis. Lett Org Chem. 2017;14:717–24. [Google Scholar]
- 15.Dao FY, Yang H, Su ZD. et al. Recent Advances in Conotoxin Classification by Using Machine Learning Methods. Molecules. 2017;22:1057. doi: 10.3390/molecules22071057. [DOI] [PMC free article] [PubMed] [Google Scholar]
- 16.Ding H, Deng EZ, Yuan LF. et al. iCTX-type: a sequence-based predictor for identifying the types of conotoxins in targeting ion channels. BioMed Res Int. 2014;2014:286419. doi: 10.1155/2014/286419. [DOI] [PMC free article] [PubMed] [Google Scholar]
- 17.Yuan LF, Ding C, Guo SH. et al. Prediction of the types of ion channel-targeted conotoxins based on radial basis function network. Toxicol In Vitro. 2013;27:852–6. doi: 10.1016/j.tiv.2012.12.024. [DOI] [PubMed] [Google Scholar]
- 18.Zhao YW, Su ZD, Yang W. et al. IonchanPred 2.0: A Tool to Predict Ion Channels and Their Types. Int J Mol Sci. 2017;18:1838. doi: 10.3390/ijms18091838. [DOI] [PMC free article] [PubMed] [Google Scholar]
- 19.Lin H, Ding H. Predicting ion channels and their types by the dipeptide mode of pseudo amino acid composition. J Theor Biol. 2011;269:64–9. doi: 10.1016/j.jtbi.2010.10.019. [DOI] [PubMed] [Google Scholar]
- 20.Kong L, Kong L, Wang C. et al. Predicting Protein Structural Class for Low-Similarity Sequences via Novel Evolutionary Modes of PseAAC and Recursive Feature Elimination. Lett Org Chem. 2017;14:673–83. [Google Scholar]
- 21.Wang X, Zhang Y, Wang J. Prediction of Protein Structural Class Based on ReliefF-SVM. Lett Org Chem. 2017;14:696–702. [Google Scholar]
- 22.Wei Z, Feng Y. Identify Protein 8-Class Secondary Structure with Quadratic Discriminant Algorithm based on the Feature Combination. Lett Org Chem. 2017;14:625–31. [Google Scholar]
- 23.Cao R, Adhikari B, Bhattacharya D. et al. QAcon: single model quality assessment using protein structural and contact information with machine learning techniques. Bioinformatics. 2017;33:586–8. doi: 10.1093/bioinformatics/btw694. [DOI] [PMC free article] [PubMed] [Google Scholar]
- 24.Cao R, Bhattacharya D, Hou J. et al. DeepQA: improving the estimation of single protein model quality with deep belief networks. BMC Bioinformatics. 2016;17:495. doi: 10.1186/s12859-016-1405-y. [DOI] [PMC free article] [PubMed] [Google Scholar]
- 25.Cao R, Cheng J. Protein single-model quality assessment by feature-based probability density functions. Sci Rep. 2016;6:23990. doi: 10.1038/srep23990. [DOI] [PMC free article] [PubMed] [Google Scholar]
- 26.Lin H, Deng EZ, Ding H. et al. iPro54-PseKNC: a sequence-based predictor for identifying sigma-54 promoters in prokaryote with pseudo k-tuple nucleotide composition. Nucleic Acids Res. 2014;42:12961–72. doi: 10.1093/nar/gku1019. [DOI] [PMC free article] [PubMed] [Google Scholar]
- 27.Lin H, Liang ZY, Tang H. et al. Identifying sigma70 promoters with novel pseudo nucleotide composition. IEEE/ACM Trans Comput Biol Bioinform. 2017 doi: 10.1109/TCBB.2017.2666141. doi: 10.1109/TCBB.2017.2666141. [DOI] [PubMed] [Google Scholar]
- 28.Zhang CJ, Tang H, Li WC. et al. iOri-Human: identify human origin of replication by incorporating dinucleotide physicochemical properties into pseudo nucleotide composition. Oncotarget. 2016;7:69783–93. doi: 10.18632/oncotarget.11975. [DOI] [PMC free article] [PubMed] [Google Scholar]
- 29.Li WC, Deng EZ, Ding H. et al. iORI-PseKNC: A predictor for identifying origin of replication with pseudo k-tuple nucleotide composition. Chemometr Intell Lab. 2015;141:100–6. [Google Scholar]
- 30.Feng P, Ding H, Yang H. et al. iRNA-PseColl: Identifying the Occurrence Sites of Different RNA Modifications by Incorporating Collective Effects of Nucleotides into PseKNC. Mol Ther Nucleic Acids. 2017;7:155–63. doi: 10.1016/j.omtn.2017.03.006. [DOI] [PMC free article] [PubMed] [Google Scholar]
- 31.Chen W, Yang H, Feng P. et al. iDNA4mC: identifying DNA N4-methylcytosine sites based on nucleotide chemical properties. Bioinformatics. 2017;33:3518–23. doi: 10.1093/bioinformatics/btx479. [DOI] [PubMed] [Google Scholar]
- 32.Zhao YW, Lai HY, Tang H. et al. Prediction of phosphothreonine sites in human proteins by fusing different features. Sci Rep. 2016;6:34817. doi: 10.1038/srep34817. [DOI] [PMC free article] [PubMed] [Google Scholar]
- 33.Lei GC, Tang J, Du PF. Predicting S-sulfenylation Sites Using Physicochemical Properties Differences Properties Differences. Lett Org Chem. 2017;14:665–72. [Google Scholar]
- 34.Chou KC. Some remarks on protein attribute prediction and pseudo amino acid composition. J Theor Biol. 2011;273:236–47. doi: 10.1016/j.jtbi.2010.12.024. [DOI] [PMC free article] [PubMed] [Google Scholar]
- 35.Breuza L, Poux S, Estreicher A. et al. The UniProtKB guide to the human proteome. Database. 2016;2016:bav120. doi: 10.1093/database/bav120. [DOI] [PMC free article] [PubMed] [Google Scholar]
- 36.Fu L, Niu B, Zhu Z. et al. CD-HIT: accelerated for clustering the next-generation sequencing data. Bioinformatics. 2012;28:3150–2. doi: 10.1093/bioinformatics/bts565. [DOI] [PMC free article] [PubMed] [Google Scholar]
- 37.Lin H, Chen W. Prediction of thermophilic proteins using feature selection technique. J Microbiol Methods. 2011;84:67–70. doi: 10.1016/j.mimet.2010.10.013. [DOI] [PubMed] [Google Scholar]
- 38.Feng PM, Lin H, Chen W. Identification of antioxidants from sequence information using naive Bayes. Comput Math Methods Med. 2013;2013:567529. doi: 10.1155/2013/567529. [DOI] [PMC free article] [PubMed] [Google Scholar]
- 39.Feng PM, Ding H, Chen W. et al. Naive Bayes classifier with feature selection to identify phage virion proteins. Comput Math Methods Med. 2013;2013:530696. doi: 10.1155/2013/530696. [DOI] [PMC free article] [PubMed] [Google Scholar]
- 40.Lai HY, Chen XX, Chen W. et al. Sequence-based predictive modeling to identify cancerlectins. Oncotarget. 2017;8:28169–75. doi: 10.18632/oncotarget.15963. [DOI] [PMC free article] [PubMed] [Google Scholar]
- 41.Ding H, Yang W, Tang H. et al. PHYPred: a tool for identifying bacteriophage enzymes and hydrolases. Virol Sin. 2016;31:350–2. doi: 10.1007/s12250-016-3740-6. [DOI] [PMC free article] [PubMed] [Google Scholar]
- 42.Ding H, Liang ZY, Guo FB. et al. Predicting bacteriophage proteins located in host cell with feature selection technique. Comput Biol Med. 2016;71:156–61. doi: 10.1016/j.compbiomed.2016.02.012. [DOI] [PubMed] [Google Scholar]
- 43.Chen XX, Tang H, Li WC. et al. Identification of Bacterial Cell Wall Lyases via Pseudo Amino Acid Composition. BioMed Res Int. 2016;2016:1654623. doi: 10.1155/2016/1654623. [DOI] [PMC free article] [PubMed] [Google Scholar]
- 44.Ding H, Li D. Identification of mitochondrial proteins of malaria parasite using analysis of variance. Amino Acids. 2015;47:329–33. doi: 10.1007/s00726-014-1862-4. [DOI] [PubMed] [Google Scholar]
- 45.Lin H, Chen W, Ding H. AcalPred: a sequence-based tool for discriminating between acidic and alkaline enzymes. PloS One. 2013;8:e75726. doi: 10.1371/journal.pone.0075726. [DOI] [PMC free article] [PubMed] [Google Scholar]
- 46.Tang H, Cao RZ, Wang W. et al. A two-step discriminated method to identify thermophilic proteins. Int J Biomath. 2017;10:1750050. [Google Scholar]
- 47.Lin H, Liu WX, He J. et al. Predicting cancerlectins by the optimal g-gap dipeptides. Sci Rep. 2015;5:16964. doi: 10.1038/srep16964. [DOI] [PMC free article] [PubMed] [Google Scholar]
- 48.Guo SH, Deng EZ, Xu LQ. et al. iNuc-PseKNC: a sequence-based predictor for predicting nucleosome positioning in genomes with pseudo k-tuple nucleotide composition. Bioinformatics. 2014;30:1522–9. doi: 10.1093/bioinformatics/btu083. [DOI] [PubMed] [Google Scholar]
- 49.Lin H, Ding C, Yuan LF. et al. Predicting Subchloroplast Locations Of Proteins Based on the General Form Of Chou's Pseudo Amino Acid Composition: Approached From Optimal Tripeptide Composition. Int J Biomath. 2013;6:1350003. [Google Scholar]
- 50.Lin H, Chen W, Yuan LF. et al. Using over-represented tetrapeptides to predict protein submitochondria locations. Acta Biotheor. 2013;61:259–68. doi: 10.1007/s10441-013-9181-9. [DOI] [PubMed] [Google Scholar]
- 51.Ding H, Liu L, Guo FB. et al. Identify Golgi protein types with modified Mahalanobis discriminant algorithm and pseudo amino acid composition. Protein Pept Lett. 2011;18:58–63. doi: 10.2174/092986611794328708. [DOI] [PubMed] [Google Scholar]
- 52.Song J, Burrage K. Predicting residue-wise contact orders in proteins by support vector regression. BMC Bioinformatics. 2006;7:425. doi: 10.1186/1471-2105-7-425. [DOI] [PMC free article] [PubMed] [Google Scholar]
- 53.Li N, Kang J, Jiang L. et al. PSBinder: A Web Service for Predicting Polystyrene Surface-Binding Peptides. BioMed Res Int. 2017;2017:5761517. doi: 10.1155/2017/5761517. [DOI] [PMC free article] [PubMed] [Google Scholar]
- 54.Hua ZG, Lin Y, Yuan YZ. et al. ZCURVE 3.0: identify prokaryotic genes with higher accuracy as well as automatically and accurately select essential genes. Nucleic Acids Res. 2015;43:W85–90. doi: 10.1093/nar/gkv491. [DOI] [PMC free article] [PubMed] [Google Scholar]
- 55.He B, Kang J, Ru B. et al. SABinder: A Web Service for Predicting Streptavidin-Binding Peptides. Biomed Res Int. 2016;2016:9175143. doi: 10.1155/2016/9175143. [DOI] [PMC free article] [PubMed] [Google Scholar]
- 56.Guo FB, Dong C, Hua HL. et al. Accurate prediction of human essential genes using only nucleotide composition and association information. Bioinformatics. 2017;33:1758–64. doi: 10.1093/bioinformatics/btx055. [DOI] [PMC free article] [PubMed] [Google Scholar]
- 57.Cortes C, Vapnik V. Support-vector networks. Machine Learning. 1995;20:273–97. [Google Scholar]
- 58.Chang CC, Lin CJ. LIBSVM: A Library for Support Vector Machines. Acm T Intel Syst Tec; 2011. p. 2. [Google Scholar]
- 59.Lin H, Ding C, Song Q. et al. The prediction of protein structural class using averaged chemical shifts. J Biomol Struct Dyn. 2012;29:643–9. doi: 10.1080/07391102.2011.672628. [DOI] [PubMed] [Google Scholar]
- 60.Chou KC, Shen HB. Recent progress in protein subcellular location prediction. Anal Biochem. 2007;370:1–16. doi: 10.1016/j.ab.2007.07.006. [DOI] [PubMed] [Google Scholar]
- 61.Feng P, Yang H, Ding H. et al. iDNA6mA-PseKNC: Identifying DNA N(6)-methyladenosine sites by incorporating nucleotide physicochemical properties into PseKNC. Genomics. 2018 doi: 10.1016/j.ygeno.2018.01.005. doi: 10.1016/j.ygeno.2018.01.005. [DOI] [PubMed] [Google Scholar]
- 62.Qiu WR, Sun BQ, Tang H. et al. Identify and analysis crotonylation sites in histone by using support vector machines. Artif Intell Med. 2017;83:75–81. doi: 10.1016/j.artmed.2017.02.007. [DOI] [PubMed] [Google Scholar]
- 63.Ding H, Lin H, Chen W. et al. Prediction of protein structural classes based on feature selection technique. Interdiscip Sci. 2014;6:235–40. doi: 10.1007/s12539-013-0205-6. [DOI] [PubMed] [Google Scholar]
- 64.Cao R, Freitas C, Chan L. et al. ProLanGO: Protein Function Prediction Using Neural Machine Translation Based on a Recurrent Neural Network. Molecules. 2017;22:1732. doi: 10.3390/molecules22101732. [DOI] [PMC free article] [PubMed] [Google Scholar]
- 65.Lin H, Wang H, Ding H. et al. Prediction of subcellular localization of apoptosis protein using Chou's pseudo amino acid composition. Acta Biotheor. 2009;57:321–30. doi: 10.1007/s10441-008-9067-4. [DOI] [PubMed] [Google Scholar]
- 66.Ding H, Luo L, Lin H. Prediction of cell wall lytic enzymes using Chou's amphiphilic pseudo amino acid composition. Protein Pept Lett. 2009;16:351–5. doi: 10.2174/092986609787848045. [DOI] [PubMed] [Google Scholar]
- 67.Hasan MM, Guo D, Kurata H. Computational identification of protein S-sulfenylation sites by incorporating the multiple sequence features information. Mol BioSyst. 2017;13:2545–50. doi: 10.1039/c7mb00491e. [DOI] [PubMed] [Google Scholar]
- 68.Khan M, Hayat M, Khan SA. et al. Bi-PSSM: Position specific scoring matrix based intelligent computational model for identification of mycobacterial membrane proteins. J Theor Biol. 2017;435:116–24. doi: 10.1016/j.jtbi.2017.09.013. [DOI] [PubMed] [Google Scholar]
- 69.Li ZW, You ZH, Chen X. et al. Accurate prediction of protein-protein interactions by integrating potential evolutionary information embedded in PSSM profile and discriminative vector machine classifier. Oncotarget. 2017;8:23638–49. doi: 10.18632/oncotarget.15564. [DOI] [PMC free article] [PubMed] [Google Scholar]
- 70.Liang Y, Zhang S. Predict protein structural class by incorporating two different modes of evolutionary information into Chou's general pseudo amino acid composition. J Mol Graph Model. 2017;78:110–7. doi: 10.1016/j.jmgm.2017.10.003. [DOI] [PubMed] [Google Scholar]
- 71.Wang J, Yang B, Revote J. et al. POSSUM: a bioinformatics toolkit for generating numerical sequence feature descriptors based on PSSM profiles. Bioinformatics. 2017;33:2756–8. doi: 10.1093/bioinformatics/btx302. [DOI] [PubMed] [Google Scholar]
- 72.Cheng X, Xiao X, Chou KC. pLoc-mPlant: predict subcellular localization of multi-location plant proteins by incorporating the optimal GO information into general PseAAC. Mol BioSyst. 2017;13:1722–7. doi: 10.1039/c7mb00267j. [DOI] [PubMed] [Google Scholar]
- 73.Kulmanov M, Khan MA, Hoehndorf R. DeepGO: Predicting protein functions from sequence and interactions using a deep ontology-aware classifier. Bioinformatics. 2018;34:660–8. doi: 10.1093/bioinformatics/btx624. [DOI] [PMC free article] [PubMed] [Google Scholar]
- 74.Zhou H, Yang Y, Shen HB. Hum-mPLoc 3.0: prediction enhancement of human protein subcellular localization through modeling the hidden correlations of gene ontology and functional domain features. Bioinformatics. 2017;33:843–53. doi: 10.1093/bioinformatics/btw723. [DOI] [PubMed] [Google Scholar]
- 75.Altschul SF, Madden TL, Schaffer AA. et al. Gapped BLAST and PSI-BLAST: a new generation of protein database search programs. Nucleic Acids Res. 1997;25:3389–402. doi: 10.1093/nar/25.17.3389. [DOI] [PMC free article] [PubMed] [Google Scholar]
- 76.Zhang T, Tan P, Wang L. et al. RNALocate: a resource for RNA subcellular localizations. Nucleic Acids Res. 2017;45:D135–D8. doi: 10.1093/nar/gkw728. [DOI] [PMC free article] [PubMed] [Google Scholar]
- 77.Liang ZY, Lai HY, Yang H. et al. Pro54DB: a database for experimentally verified sigma-54 promoters. Bioinformatics. 2017;33:467–9. doi: 10.1093/bioinformatics/btw630. [DOI] [PubMed] [Google Scholar]
- 78.He B, Chai G, Duan Y. et al. BDB: biopanning data bank. Nucleic Acids Res. 2016;44:D1127–32. doi: 10.1093/nar/gkv1100. [DOI] [PMC free article] [PubMed] [Google Scholar]
- 79.Huang J, Ru B, Zhu P. et al. MimoDB 2.0: a mimotope database and beyond. Nucleic Acids Res. 2012;40:D271–7. doi: 10.1093/nar/gkr922. [DOI] [PMC free article] [PubMed] [Google Scholar]
- 80.Feng PM, Ding H, Lin H. et al. AOD: the antioxidant protein database. Sci Rep. 2017;7:7449. doi: 10.1038/s41598-017-08115-6. [DOI] [PMC free article] [PubMed] [Google Scholar]