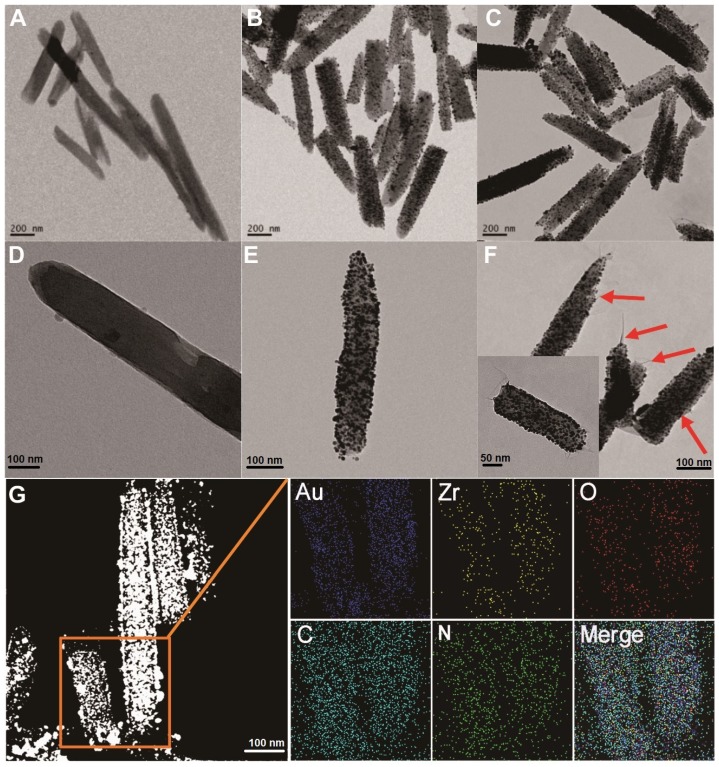
Figure 1.
TEM imaging analysis of Zr-based MOF, MOF@AuNP, and MOF@AuNP@GO. (A and D) TEM images of Zr-based MOF, (B and E) TEM images of MOF@AuNP, and (C and F) TEM images of MOF@AuNP@GO, in which the GO layer with filaments was indicated by the red arrows. (G) EDS mapping analysis of the MOF@AuNP@GO nanohybrid.

