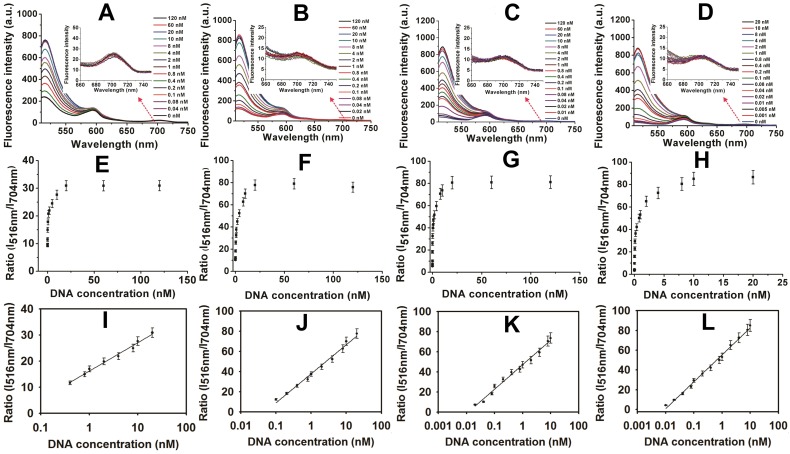
Figure 4.
Fluorescence spectra and the corresponding standard curves of four MOF-based nanoquenchers in the presence of different concentrations of target p53 gene. Fluorescence spectra of MOF alone (A), MOF@GO (B), MOF@AuNP (C), and MOF@AuNP@GO (D), the corresponding relationships between the ratio of I516nm/I704nm and target concentrations from A to D, and the corresponding calibration curves at low target concentrations (I, J, K, and L) from E to H, respectively. All experiments were carried out at 37 ℃ in 10 mM Tris-HCl buffered (pH 7.4, containing 100 mM NaCl, 5 mM KCl and 5 mM MgCl2) with concentrations of MOF, MOF@GO, MOF@AuNP, and MOF@AuNP@GO at 5, 3.75, 2 and 2 µg mL-1 in the final solution, respectively. Fluorescence spectra were recorded with the excitation of 485 nm. Error bars were obtained from three repeats.

