Abstract
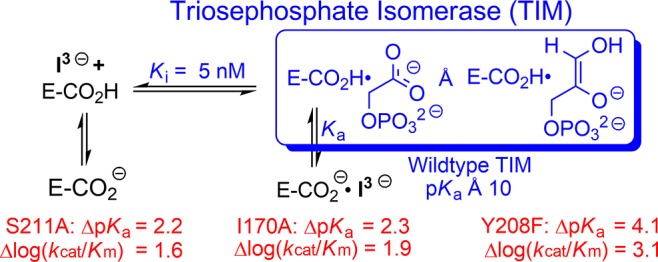
We report pH rate profiles for kcat and Km for the isomerization reaction of glyceraldehyde 3-phosphate catalyzed by wildtype triosephosphate isomerase (TIM) from three organisms and by ten mutants of TIM; and, for Ki for inhibition of this reaction by phosphoglycolate trianion (I3–). The pH profiles for Ki show that the binding of I3– to TIM (E) to form EH·I3– is accompanied by uptake of a proton by the carboxylate side-chain of E165, whose function is to abstract a proton from substrate. The complexes for several mutants exist mainly as E–·I3– at high pH, in which cases the pH profiles define the pKa for deprotonation of EH·I3–. The linear free energy correlation, with slope of 0.73 (r2 = 0.96), between kcat/Km for TIM-catalyzed isomerization and the disassociation constant of PGA trianion for TIM shows that EH·I3– and the transition state are stabilized by similar interactions with the protein catalyst. Values of pKa = 10–10.5 were estimated for deprotonation of EH·I3– for wildtype TIM. This pKa decreases to as low as 6.3 for the severely crippled Y208F mutant. There is a correlation between the effect of several mutations on kcat/Km and on pKa for EH·I3–. The results support a model where the strong basicity of E165 at the complex to the enediolate reaction intermediate is promoted by side-chains from Y208 and S211, which serve to clamp loop 6 over the substrate; I170, which assists in the creation of a hydrophobic environment for E165; and P166, which functions in driving the carboxylate side-chain of E165 toward enzyme-bound substrate.
Introduction
Triosephosphate isomerase catalyzes the reversible isomerization of d-glyceraldehyde 3-phosphate to dihydroxyacetone phosphate.1−3 The proton transfers at the active site of TIM are carried out by the carboxylate side-chain of Glu165/167,4−6 which shuttles a proton between C1 and C2; and, by the imidazole side-chain of His95, which shuttles a proton between O1 and O2 of enediolate intermediates (Scheme 1).7,8 (We note the following small differences in the numbering of amino acid residues at TIM from chicken muscle or yeast and TIM from Trypanosoma brucei brucei, (cTIM/TbbTIM): Glu165/Glu167; Pro166/Pro168; Ile170/Ile172; Leu230/Leu232.) The amino acid side-chains play roles similar to that for small molecule Brønsted acid/base catalysts of isomerization in water.9 However, the “directed” proton transfer reactions at the tightly packed and structured active site of TIM are much faster than those carried out by freely diffusing Bronsted acids and bases in water.10
Scheme 1. TIM-Catalyzed Isomerization of Triosephosphates.
Recent results from empirical valence-bond calculations to model TIM-catalyzed deprotonation of DHAP, GAP or the substrate pieces glycolaldehye + phosphite dianion show that binding of these substrates to TIM results in a ≈13 kcal/mol decrease in ΔG° for deprotonation of the carbon acid by an alkyl carboxylate anion.11,12 This corresponds to a ≈10 unit reduction at TIM in the 14 unit difference in the pKa values of the carboxylic acid side-chain (ca. 4) and the carbon acid substrate DHAP (ca. 18) in water.9 We are interested in understanding the mechanism by which the protein catalyst reduces the thermodynamic barrier for deprotonation of carbon acid substrates.11,13−17
The fifty-year old observation that phosphoglycolate (PGA) binds to triosephosphate isomerase with a higher affinity than substrate triggered the proposal that this stable ligand captured the strong stabilization observed for transition state binding,18 and in some manner is analogous to the transition state.19 PGA is an analog for the enediolate trianion intermediate of TIM-catalyzed deprotonation of DHAP (Scheme 2), so that inhibitor binding may capture the stabilization of an enediolate-like transition state from electrostatic interactions provided by catalytic side-chains at the enzyme active site.
Scheme 2. Deprotonation of the Complex between TIM and the Intermediate Analog PGA Trianion.
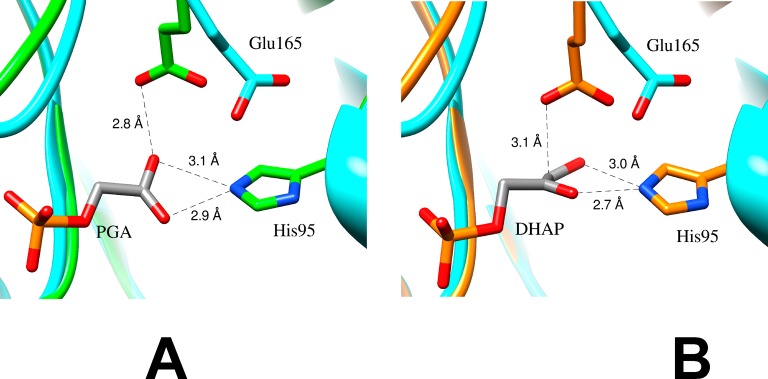
Wolfenden and co-workers determined that the values of Ki for competitive inhibition of TIM by PGA trianion are inversely proportional to [H+].20 These results prompted NMR studies of the TIM·inhibitor complex, which showed that the binding of PGA trianion (I3–) to TIM (E–) is accompanied by the uptake of a proton to form the EH·I3– complex.21,22 Inhibitor and substrate binding to TIM (Figure 1A,B) drive complex enzyme conformational changes that move the carboxylate side-chain of E165 toward the ligand. The resulting short 2.8 Å separation between the ligand and enzyme carboxylates (Figure 1A) is consistent with formation of a hydrogen bond that stabilizes the TIM·PGA complex.
Figure 1.
(A) Models, from X-ray crystal structures,23 of the active site of unliganded yeast TIM (light blue, PDB entry 1YPI) and yeast TIM complexed with PGA (green, PDB entry 2YPI). Ligand binding is accompanied by a 2 Å shift in the position of the carboxylate side-chain of Glu165 toward the bound ligand. (B) Models, from X-ray crystal structures, of the active site of unliganded yeast TIM (light blue, PDB entry 1YPI) and yeast TIM complexed with DHAP (orange, PDB entry 1NEY).24 Ligand binding is accompanied by a 2 Å shift in the position of the carboxylate side-chain of Glu165, similar to that observed for binding of PGA.
We reported a pH profile of inhibition constants Ki for release of PGA trianion (I3–) from TIM from Trypanosoma brucei brucei (TbbTIM) that is linear, with slope of −1 through pH 9.7, so that pKEHI for release of a proton from the EH·I3– complex (Scheme 2) is >10.14 The I170A mutation was found to result in a >2 units decrease in the pKa of this complex to pKa = 7.7. We proposed that the reduction in the kinetic parameters for the I170A mutant, compared to wildtype TbbTIM-catalyzed isomerization, is directly related to the reduction in the pKa of the EH·I3– complex.14 The significance of these results is profound, provided that PGA trianion is a high-quality analog for the enediolate phosphate trianion reaction intermediate, because they require a strong basicity of the carboxylate side-chain at the complex to this reaction intermediate, which favors effective catalysis of proton transfer at carbon.
We now report the results of experiments that extend this work to a broad series of structural mutations of TIM from chicken (cTIM), yeast (yTIM) and Trypanosoma brucei brucei (TbbTIM). The good linear free energy relationship between the effect of these mutations on the stability of the rate determining transition state for TIM-catalyzed isomerization, and the stability of the complex with PGA trianion, provides strong evidence that PGA trianion is an analog for the transition state.25 Several mutations are shown to result in a reduction in the basicity of the EH·I3– complex. We propose that these mutations result in a similar reduction in the basicity of the complex to the true enediolate intermediate, and that the change in side-chain basicity is the direct cause of the reduction in activity observed for these mutants.
Experimental Section
Materials
Human wildtype α-glycerol phosphate dehydrogenase (GPDH) was prepared by published procedures.26 Bovine serum albumin (BSA) was from Roche. d,l-Glyceraldehyde 3-phosphate diethyl acetal (barium salt), dihydroxyacetone phosphate (DHAP, lithium or magnesium salt), NADH (disodium salt), triethanolamine hydrochloride (TEA), 2-(N-morpholino)ethanesulfonic acid (MES), 3-(N-morpholino)propanesulfonic acid (MOPS), N-[tris(hydroxymethyl)methyl]-3-aminopropanesulfonic acid (TAPS), 2-(cyclohexylamino)ethanesulfonic acid (CHES), imidazole and Amberite (H+-form) were purchased from Sigma. All other commercial materials were reagent grade or better and were used without further purification.
2-Phosphoglycolic acid (PGA) was prepared according to a literature procedure,27 and was purified by passage through a DEAE-Sephadex A25 anion exchange column, with gradient (0–250 mM) elution using triethylammonium bicarbonate. PGA was detected by its activity as an inhibitor of TIM. The triethylammonium salt of PGA was converted to the free acid using Amberlite cation exchanger. Stock solutions of PGA (40–50 mM) were prepared in water, and the pH was adjusted to the required value using 1 M NaOH. The concentration of PGA in the stock solution was determined by 1H NMR analysis. This solution was diluted by 20-fold into 30 mM imidazole (pD 8.0, 70% free base), and the concentration determined by comparing the integrated areas of the signals for C-4 and C-5 protons of imidazole with the C-2 protons of PGA. Solutions of PGA at pH 7.5 were stored at −20 °C, where they are stable toward hydrolysis of the phosphoryl group for at least 6 months.
d-Glyceraldehyde 3-phosphate (sodium salt) was prepared according to a literature procedure.28 Stock solutions of d,l-glyceraldehyde 3-phosphate (D,L-GAP) were prepared by hydrolysis of the diethyl acetal (barium salt) using Dowex 50WX4-200R (H+-form) in a boiling water bath.29 The solutions of D-GAP or D,L-GAP were stored at −20 °C and were adjusted to the appropriate pH by the addition of 1 M NaOH. It was shown in several cases that there is no significant difference in the kinetic parameters for TIM-catalyzed isomerization determined using D-GAP or a racemic D,L-GAP mixture. This is consistent with the report that L-GAP binds much more weakly to TIM than D-GAP.30 We will refer to the d-glyceraldehyde 3-phosphate substrate for TIM as GAP for the remainder of this paper.
The methods for the cloning and overexpression of the genes for wildtype cTIM/yTIM/TbbTIM,31−33TbbP166A,34cL7R (loop seven replacement),34yY208T/S/A/F, yS211A35,36 mutants of TIM, and for protein purification, were described in earlier work. The concentrations of protein used in the determination of enzyme kinetic parameters were obtained from the absorbance at 280 nm and extinction coefficients that were calculated using the ProtParam tool available on the ExPASy server.37
Enzyme Assays
The initial velocity for TIM-catalyzed isomerization of GAP was determined by coupling the formation of DHAP to the oxidation of NADH, using GPDH.29 The kinetic parameters kcat and Km for the isomerization of GAP and (Ki)obs for competitive inhibition by PGA for wildtype and mutant TIMs were determined at 25 °C, I = 0.1 (NaCl), and over a broad range of pH. The pH was maintained by the following buffers: pH 4.9 - acetic acid, 65% free base; pH 5.7 - MES, 25% free base; pH 6.4 - MES, 60% free base; pH 7.0 - MOPS, 61% free base; pH 7.5 - TEA, 30% free base; pH 8.3 - TAPS, 45% free base; pH 8.9 - CHES, 30% free base; pH 9.3 - CHES, 50% free base. The assay mixtures (1.0 mL) contained 30 mM buffer, 0.2 mM NADH, GAP or D,L-GAP and 1–2 units of GPDH at an ionic strength of 0.1 (NaCl). There is a decrease in the specific activity of GPDH at increasing pH. The concentration of the coupling enzyme was varied to maintain a total activity of 1–2 units for all assays. The inhibition constants (Ki)obs for competitive inhibition were determined by varying [GAP] at two or three different fixed [PGA]. The maximum concentration of PGA was at least equal to Ki (M), but was limited to ≤13 mM in order to maintain a constant ionic strength of 0.10. The kinetic parameters for TIM-catalyzed isomerization, and for inhibition of isomerization by PGA were determined from the nonlinear least-squares fit of the kinetic data to the appropriate equation, as described in greater detail in the Supporting Information.
Results
Steady-State Kinetic Parameters for Wildtype and Mutant TIM-Catalyzed Reactions
The initial velocities vi for wildtype and mutant TIM-catalyzed isomerization of GAP were determined over a broad range of pH at 25 °C and I = 0.1 (NaCl). The following plots of vi/[E] against [GAP] are reported in the Supporting Information. Figure S1: wildtype yTIM; pH 4.9, 5.7, 6.4, 7.5, 8.3, 8.9, 9.3 and 9.9, where the concentration of [GAP] at each pH is varied over two different fixed [PGA]. Figure S2: Y208T yTIM; data at the same pH as for wildtype yTIM, except there is no data at pH 9.9. Figure S3: Y208S yTIM; data at the same pH as for wildtype yTIM, except there were no experiments at pH 9.9 and only a single [PGA] was examined at pH 8.9. Figure S4: Y208A yTIM; data at the same pH as for wildtype yTIM, except there were no experiments at pH 9.3 and 9.9. Figure S5: Y208F yTIM; data at the same pH as for wildtype yTIM, except there were no experiments at pH 9.3 and 9.9; four different [PGA] were examined at pH 7.5 and only a single [PGA] was examined at pH 5.7, 6.4, 8.3, 8.9 and 9.3. Figure S6: S211A yTIM; same as for wildtype yTIM, except there were no experiments at pH 9.3 and 9.9 and only a single [PGA] was examined at pH 8.3 and 8.9. Figure S7: S211G yTIM; same as for wildtype yTIM, but there were no experiments at pH 8.9 and only a single [PGA] was examined at pH 9.9. Figure S8: Y208T/S211G yTIM; same as for wildtype yTIM, except there were no experiments at pH 9.9 and only a single [PGA] was examined at 8.9 and 9.3. Figure S9: wildtype cTIM; same as for wildtype yTIM, but only a single [PGA] was examined at pH 9.9. Figure S10: L7R cTIM; same as for wildtype yTIM, except there were no experiments at pH 9.9 and only a single [PGA] was examined at pH 9.3. Figure S11: P166A TbbTIM; same as for wildtype yTIM.
| 1 |
| 2 |
Nonlinear least-squares fits of data from Figures S1–S11 for competitive inhibition by PGA were carried out to obtain the enzyme kinetic parameters kcat, Km and (Ki)obs, where (Ki)obs is the inhibition constant calculated for total PGA dianion + PGA trianion. These data were fit to eq 1 when significant curvature in the Michaelis–Menten type plot was observed as [GAP] approached saturation, and to eq 2 when the data showed a good fit to a linear equation [slope = (kcat/Km)obs]. The kinetic parameters kcat and Km, determined from these nonlinear least-squares fits are reported in Table S1 of the Supporting Information. Approximate values of kcat and Km are given in cases where the curvature is small, and the fit to the Michaelis–Menten equation gives Km ≥ 15 mM. The observed inhibition constants (Ki)obs for competitive inhibition of TIM by PGA are reported in Tables S2 and S3. The standard deviations obtained from nonlinear least-squares fits of these data are better than ±10%, except at high pH where the affinity of PGA becomes weak and (Ki)obs increases to as large as 0.02 M. In a few cases, standard deviations of as large as 25% are observed.
pH-Profiles of Kinetic Parameters and Inhibition Constants
Figures S12–S14 show pH profiles for the kinetic parameters kcat and Km for isomerization of GAP catalyzed by wildtype TIM [chicken (c), yeast (y) and T. brucei brucei (Tbb)] and mutant [TbbP166A, cLRM, TbbI170A, yY208T, yY208S, yY208A, yY208F, yS211G, yS211A, yY208T/yS211G] TIMs. Figure S15 shows pH profiles for the inhibition constants (Ki)obs for competitive inhibition of these different TIMs by PGA. These profiles show a downward break at pH = 6.3, the pKa for loss of a proton from PGA dianion to form PGA trianion.20 These data may be fit to kinetic equations derived for Schemes where the inhibitor binds to TIM as the dianion. However, it was shown earlier that PGA binds as the trianion (I3–), and that binding of I3– is accompanied by protonation of TIM, at the side-chain for Glu165, to form EH·I3–.22,23 This side-chain (pKa = 3.9)20 exists largely in the basic form at pH 6.3. The values of (Ki)obs at pH < 6.3 are pH-independent, because the decrease in [I3–] is balanced by the increase in the concentration of TIM in the protonated EH form.20 The values of Ki for inhibition of wildtype and mutant forms of TIM by I3–, calculated from the values of (Ki)obs using eq 3 and pKa = 6.3 for ionization of PGA dianion,20 are reported in Tables S2 and S3. Figure 2 shows pH profiles for the inhibition constants Ki, determined using eq 3, for wildtype and each mutant enzyme. Tables S2 and S3 also report the ratios [KiM]/[Ki] that define the effect of these mutations on values of Ki relative to wildtype TIM.
| 3 |
Figure 2.
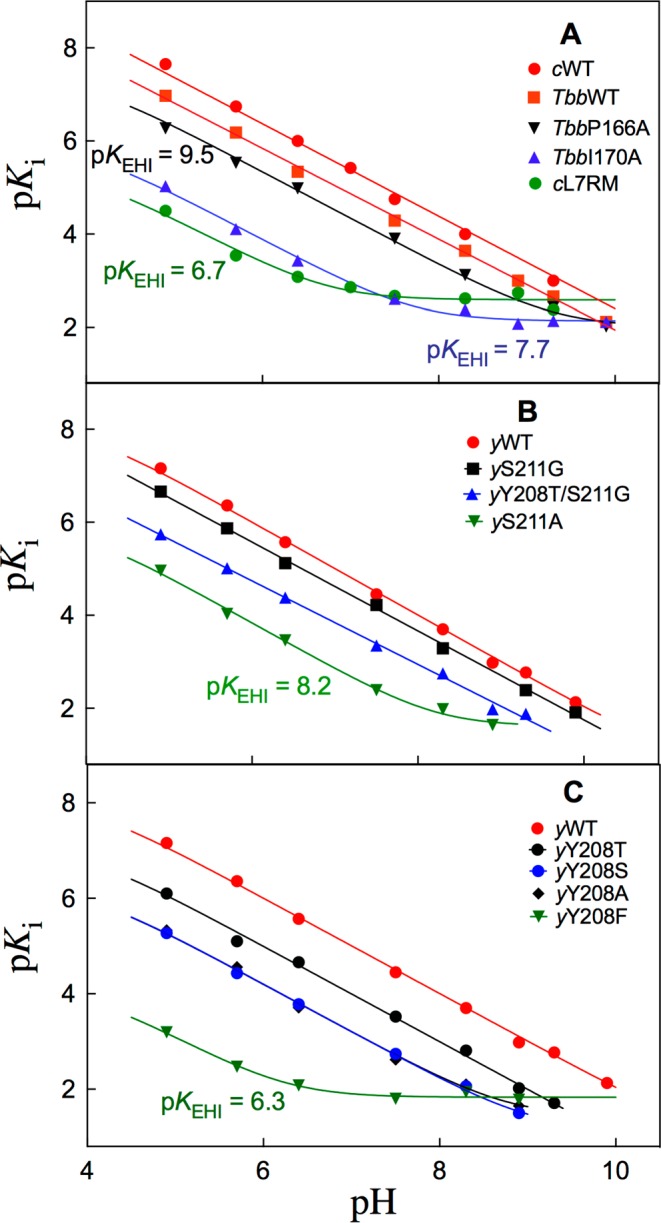
Logarithmic relationships between Ki for inhibition of wildtype and mutant forms of TIM by I3–, and the concentration of hydrogen ion. These data were fit to eq 7 or eq 8, derived for Scheme 3, depending upon whether an upward break was observed in the profile at high pH. The kinetic parameters determined from these fits are summarized in Table 1. The values of pKEHI determined from the position of the upward breaks are given next to the individual profiles. The data for TbbWT and the Tbb170A mutant enzyme are from reference (14).
Discussion
The kinetic parameters kcat/Km, kcat and the inhibition constants (Ki)obs were determined for wildtype and mutant forms of TIM between pH 4.9 and 9.9. There is no effect of any mutation on the pH profiles for kcat/Km determined for wildtype TIM (Figures S12–S14). Each of these profiles shows a good fit to eq 4, and downward breaks at pH = 6.0 ± 0.1, which is the pKa for deprotonation of GAP monoanion to form the dianion.9
| 4 |
| 5 |
There are small differences in the position of the downward breaks at low pH for the pH profiles of (kcat)obs for wildtype TIMs from chicken, yeast and T. brucei brucei (Figures S12–S14). The pH-independent value of kcat = 3500 s–1 for cTIM is nearly 2-fold larger than kcat = 2000 s–1 for TbbTIM, but at pH = 4.9, kcat = 1100 s–1 for cTIM is smaller than kcat = 1500 s–1 for TbbTIM. This is consistent with a lower pKa for the ionization at the site that controls the activity of substrate bound to TbbTIM compared with cTIM. The nonlinear least-squares fits of these data to eq 5 give pKa values of 4.2, 4.7 and 5.3 for TbbTIM, yTIM and cTIM, which are in acceptable agreement with the pKa values of 3.9, 4.6 and 6.0 determined, respectively, for TbbTIM,38yTIM39 and cTIM.40 The position of the downward breaks observed at low pH in the profiles for kcat for the isomerization of GAP catalyzed by yS211G and yY208T/S211G TIMs, pH = 4.7 and 4.5, respectively, are similar to the value of pH = 4.7 determined for wildtype yTIM.
pH-Profiles for Inhibition by PGA
The pH profiles of −log (Ki)obs for inhibition of wildtype and mutant forms of TIM by total PGA (Figure S15) show downward breaks, centered at pH = pKa = 6.3 for deprotonation of PGA dianion (I2–) to form the inhibitor trianion (I3–).20,22Figure 2 shows pH profiles of −log Ki = pKi calculated from eq 3, for inhibition of different TIMs by PGA trianion (I3–), using values of (Ki)obs and pKa = 6.3 for deprotonation of HI2– to form the active trianion I3–. The linear region of slope = −1.0 reflects the decrease in the concentration of the protonated form of TIM (EH, pKa = 3.9)20 with increasing pH. The upward breaks in the profiles observed at high pH are centered at pKa = pKEHI for deprotonation of EH·I3– to form E–·I3– + H+.
 |
6 |
 |
7 |
| 8 |
| 9 |
PGA trianion binds with different affinity to the carboxylic acid (Ki)EH and the carboxylate (Ki)E forms of the E165 side-chain of TIM, so that the pH profiles from Figure 2 are controlled by the pKa for ionization of the side-chain at TIM (KEH = 10–3.9),20 and at the inhibitor complex (KEHI).14eq 6, derived for Scheme 3, predicts downward breaks in these pH profiles at low pH (KEH = 10–3.9 ≪ [H+]), but it was not possible to examine inhibition of TIM by PGA at pH < 4.9. Several plots from Figure 2 show upward breaks at high pH, when I3– binds exclusively to the carboxylate form of TIM to form E–·I3–. The nonlinear least-squares fit of data from Figure 2 to eq 7 gives the values of KEHI for deprotonation of EH·I3– and (Ki)E breakdown of the E–·I3– complex reported in Table 1. We also noted systematic decreases, with increasing pH, in the ratio of inhibition constants [KiM]/[Ki] (Tables S2 and S3) in cases where wildtype and mutant TIMs show detectably different values of KEHI for deprotonation of EH·I3–. The wholly linear plots from Figure 2, with a slope of −1, were fit to eq 8 (KEHI ≪ [H+] ≪ KEH) to give the values for (Ki)EKEHI reported in Table 1.
Scheme 3. Pathways for Binding of PGA Trianion (I3–) and a Proton to the E165 Carboxylate Form of TIM (E–) To Form EH·I3–
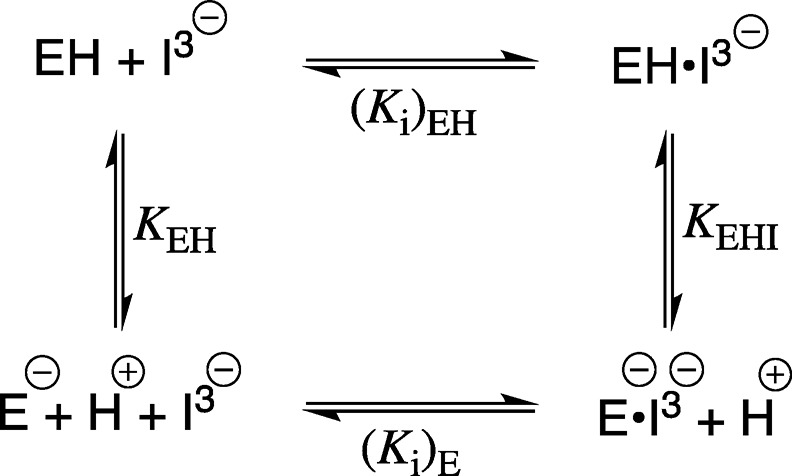
Table 1. Acidity Constants for Ionization of the EH·I3– Inhibitor Complex and Dissociation Constants (Ki)E and (Ki)EH for Release of PGA Trianion (Scheme 3) Determined for Wildtype and Mutant Forms of TIM for Reactions at 25 °C and I = 0.1 (NaCl).
| Enzyme | (Ki)E (M)a | KEHI (M)b | (Ki)EH (M)c | (Ki)E·KEHI (M–2)d | (kcat/Km) (M–1 s–1)e |
|---|---|---|---|---|---|
| cWT | ≈2 × 10⁻² | 2.9 × 10⁻¹¹ | 5 × 10⁻⁹ | 5.8 × 10⁻¹³ | 1.1 × 10⁷g |
| (pKa ≈ 10.5) | |||||
| TbbWTf | ≈2 × 10⁻² | 1.2 × 10⁻¹¹ | 2 × 10⁻⁹ | 2.4 × 10⁻¹³ | 8.4 × 10⁶ |
| (pKa ≈ 10.9) | |||||
| yWT | ≈2 × 10⁻² | 4.3 × 10⁻¹¹ | 7 × 10⁻⁹ | 8.5 × 10⁻¹³ | 8.9 × 10⁶h |
| (pKa ≈ 10.4) | |||||
| yS211G | n.d | n.d | 4.9 × 10⁻¹² | 4.2 × 10⁶h | |
| yY208T | n.d | n.d | 1.3 × 10⁻¹¹ | 1.0 × 10⁶h | |
| yY208S | n.d | n.d | 1.6 × 10⁻¹⁰ | 2.2 × 10⁵h | |
| yY208A | n.d | n.d | 1.6 × 10⁻¹⁰ | 1.8 × 10⁵h | |
| yY208T/S211G | n.d | n.d | 1.6 × 10⁻¹¹ | 7.3 × 10⁵h | |
| TbbP166A | 9.6 × 10⁻³ | 4.8 × 10⁻¹⁰ | 4.6 × 10⁻¹² | 2.5 × 10⁵g | |
| (pKa = 9.5) | |||||
| yS211A | 2.4 × 10⁻² | 6.1 × 10⁻⁹ | 1.5 × 10⁻¹⁰ | 2.2 × 10⁵h | |
| (pKa = 8.2) | |||||
| TbbI170Af | 7.1 × 10⁻³ | 1.9 × 10⁻⁸ | 1.3 × 10⁻¹⁰ | 8.0 × 10⁴f | |
| (pKa = 7.7) | |||||
| cL7R | 2.6 × 10⁻³ | 1.8 × 10⁻⁷ | 4.7 × 10⁻¹⁰ | 5.7 × 10⁴g | |
| (pKa = 6.7) | |||||
| yY208F | 1.6 × 10⁻² | 4.9 × 10⁻⁷ | 7.8 × 10⁻⁹ | 9.6 × 10³h | |
| (pKa = 6.3) |
Determined from the fit of the data from Figure 2 to eq 7, in cases where there is an upward break in the pH profiles from Figure 2. The value of (Ki)E ≈ 0.02 M for wildtype TIMs was estimated as described in the text.
Determined from the fit of the experimental data to eq 7, when there is an upward break in the pH profiles from Figure 2. The values for wildtype TIM were estimated as described in the text.
Calculated from eq 9 using values of (Ki)EKEHI determined from nonlinear least-squares fits of the inhibition data 7 and KEH = 10–3.9.20
Determined from the nonlinear least-squares fit of data from Figure 2 to eq 7 or to 8, depending on whether there is an upward break in the pH profile at high pH.
Second-order rate constant for TIM-catalyzed isomerization of GAP, calculated for the total concentration of the hydrated and carbonyl forms of substrate.
Ref (14).
Ref (34).
Ref (35).
The values of (Ki)EH for wildtype TIMs reported in Table 1 for disassociation of PGA trianion from the EH·I3– complex were calculated using eq 9 and the values of (Ki)EKEHI (Table 1), and KEH = 10–3.9.20 The disassociation constants (Ki)E for mutant TIMs shows only a small range (0.003–0.03 M, Table 1). This suggests that these mutations have only small effects on (Ki)E for wildtype TIM. The values of KEHI for deprotonation of EH·I3– at wildtype TIMs reported in Table 1 were therefore estimated from the value of (Ki)E·KEHI (Table 1) and (Ki)E = 2 × 10⁻² M determined for the conservative S211A mutation. The values of pKEHI for wildtype TIMs range from 10.0 for TbbTIM to 10.5 for cTIM, and are consistent with the failure to observe breaks at pH 9.7 in the pH profiles for wildtype TIMs (Figure 2).14
Structure–Reactivity Correlation
PGA trianion is referred to as a transition state analog19 because, like the transition state, it binds to TIM more tightly than the substrate. A linear free energy relationship (LFER) is expected for logarithmic correlations between inhibitor affinity and transition state stability for reactions catalyzed by wildtype and mutant TIMs, when the inhibitor is an analog of the transition state.25,41 The relative affinity of wildtype and mutant TIMs for PGA trianion, when inhibitor binding is accompanied by uptake of a proton, is defined by the relative values for (Ki)EKEHI (Scheme 3 and Table 1). Figure 3 shows the linear logarithmic correlation (excluding data for the P166A mutant), with slope 0.73 (r2 = 0.96), between kcat/Km for isomerization of GAP catalyzed by wildtype and mutant forms of TIM and (Ki)EKEHI for binding of H+ and I3– to TIM (E-) to form EH·I3– (Scheme 3). The linear correlation from Figure 3 shows that TIM acts to stabilize features that are common to the isomerization reaction transition state and the complex to PGA trianion; and, that 73% of the stabilizing interaction at the PGA complex is observed at the transition state for TIM-catalyzed isomerization. These results support the conclusion that the stable ligand I3– is an analog of the late transition state for TIM-catalyzed isomerization through the enediolate reaction intermediate (Scheme 1).
Figure 3.
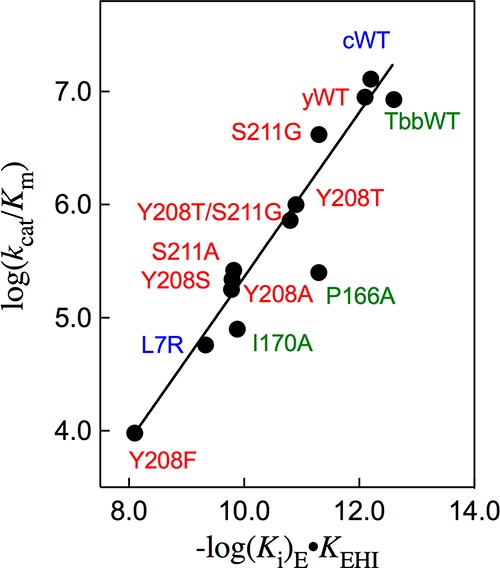
Linear logarithmic correlation, with slope of 0.73 (r2 = 0.96), between the values of kcat/Km for isomerization of GAP catalyzed by wildtype and mutant forms of TIM and (Ki)EKEHI (Scheme 3 and Table 1) for binding of H+ and I3– to TIM (E–) form the EH·I3– complex.
The 0.9 unit negative deviation of log kcat/Km for P166A mutant TIM from the correlation in Figure 3 shows that this kinetic parameter is smaller than expected for the affinity of the P166A mutant for PGA trianion. X-ray crystallographic analyses of the active site for unliganded wildtype TbbTIM,42 and the complex between wildtype TbbTIM and PGA (Figure 4)43 show that movement of loop 6 of wildtype TIM results in a clash between the carbonyl oxygen of G211 and the pyrolidine side-chain of P166. This clash is relieved by movement of the proline side-chain and the attached E165 side-chain toward the ligand. The P166A mutation relieves the unfavorable steric interaction, and leaving the side-chain of E165 at the PGA complex in the swung-out position: this is the only significant effect of the P166A mutation (Figure 4). We propose that the P166A mutation has a relatively small effect on log(Ki)EKEHI because the ligand carboxylate at the mutant enzyme is free to move toward the carboxylate of E165. By contrast, the requirement that GAP remain in the catalytic conformation, which enables optimal transition state stabilization by the organized side-chains of TIM, results in an added barrier to kcat/Km for P166A mutant TIM, due to the requirement that the swung-out E165 carboxylate move toward the bound substrate at the Michaelis complex.
Figure 4.
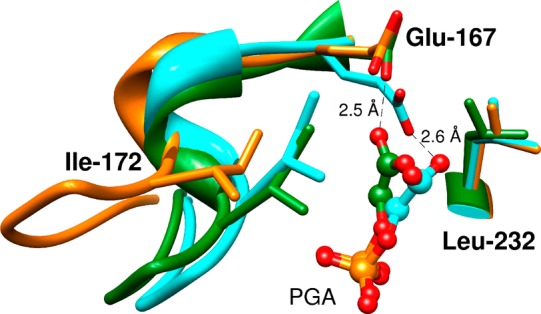
Superposition of models, from X-ray crystal structures, which show TIM active sites: (1) Unliganded wildtype TbbTIM (gold, PDB entry 5TIM); (2) Wildtype TIM from L. mexicana (LmTIM) liganded with PGA (cyan, 1N55; (3) The P166A mutant of TbbTIM liganded with PGA (green, 2J27). The ligand induced conformational changes observed for wildtype LmTIM and P166A mutant TbbTIM liganded to PGA are similar, except that the carboxylate side-chain of Glu165 of the P166A mutant remains in the swung-out position observed for the unliganded enzyme. There is a shift in the position of the bound PGA carboxylate for this mutant, which enables the formation of a hydrogen bond between the TIM and PGA carboxylates, as is observed for the complex of PGA to wildtype TIM.
Affinity of PGA for TIM
The disassociation constants (Ki)EH = (2–7) × 10–9 M (2–7 nM) for release of I3– from the wildtype EH·I3– complex (Table 1) correspond to binding energies of (11.1–11.8) kcal/mol, so that the small anion I3– shows an unusually large affinity for binding to EH. This is consistent with I3– acting as a mimic for the enediolate intermediate. By comparison, the disassociation constants (Ki)E ≈ 10–2 M (Table 1) for release of PGA trianion from the E–·I3– correspond to binding energies of only 3 kcal/mol for formation of E–·I3–. We conclude that formation of this complex is accompanied by a ca. 9 kcal/mol increase in the driving force for protonation of the carboxylate side-chain of E165. The increase from pKa = 3.9 for deprotonation of the carboxylate side-chain of E165 at free TIM, to pKa ≈ 10.5 for deprotonation of the EH·I3– (Scheme 2) is due to the combined effects of: (1) Stabilization of EH·I3– by the hydrogen bond between the carboxylic acid side-chain of TIM and the carboxylate of PGA. (2) Destabilization of E–·I3– by electrostatic interactions between the interacting anionic inhibitor and carboxylate side-chain of TIM.
There is an 8 kcal/mol difference between the 11 and 3 kcal/mol binding energy of PGA trianion for E– and EH. We propose that the observed binding energy of I3– for E– is reduced by the requirement to utilize binding energy to drive an enzyme conformational change that results in destabilizing interactions between the ligand and enzyme anions,23,43 and an increase in the basicity of the E165 side-chain at the complex to I3– or to the enediolate. In the case of I3–, this increase in side-chain basicity is accompanied by thermodynamically favorable side-chain protonation by solvent. In the case of GAP, the increase in side-chain basicity at the complex to the enediolate intermediate provides an increase in the thermodynamic driving force for substrate deprotonation.
Site-Directed Mutations: Simple Effects
The tight packing of the hydrophobic side-chain of I170 and the catalytic side-chain of E165 at the closed form of TIM is partly relieved at the I170A mutant, where the excised side-chain is replaced by a water molecule.13 This has the effect of reducing kcat/Km for the I170A mutant. The results of empirical valence bond calculations of the activation barriers for deprotonation of GAP catalyzed by wildtype and mutant forms of TIM reproduce the effect of the I170A mutation on kcat, and show that placement of the alkyl side-chain of I170 at the tightly packed active site of TIM is critical to the observation of optimal stabilizing electrostatic interactions between the transition state and neighboring polar side-chains at TIM.11,13−15
Figure 5 shows the partly transparent surface of the complex between yTIM and PGA,23 which highlights the hydrogen bonding interactions between the side-chains of Y208 and S211 from loop 7 (shaded purple) and backbone amides from loop 6 (shaded green). These interloop hydrogen bonds serve to lock the ligand into a tight cage.35,36,44−46 The importance of this cage for obtaining optimal transition state stabilization from electrostatic interactions with side-chains at the enzyme active site is highlighted by the large effects on kcat/Km of the weakening of the cage by mutations at positions 208 and/or 211.35,44,45Figure 3 shows that the Y208, S211 and L7R mutations likewise result in substantial destabilization of the complex to the PGA trianion intermediate analog; and, that 73% of this effect is observed as a destabilization of the rate determining transition state for TIM-catalyzed isomerization of GAP.
Figure 5.
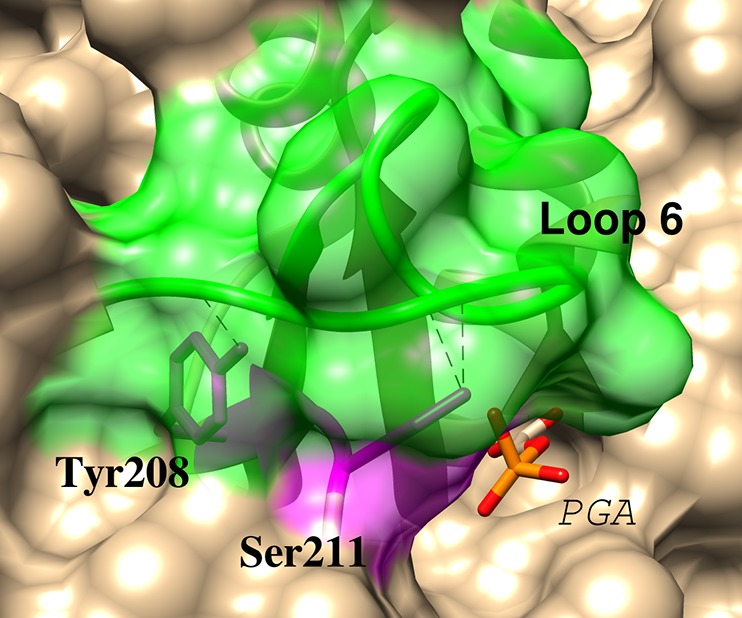
Representation of the complex between yeast TIM and PGA (PDB entry 2YPI) that shows interloop H-bonds between the amide-NH of Gly-173 and the γ-O of Ser-211; the amide-NH of Ala-176 and the phenol oxygen of Try-208; and, the carbonyl oxygen of Ala-169 and the γ-OH of Ser-211.
Site-Directed Mutations: Perturbation of the pKa for the Catalytic Glutamate
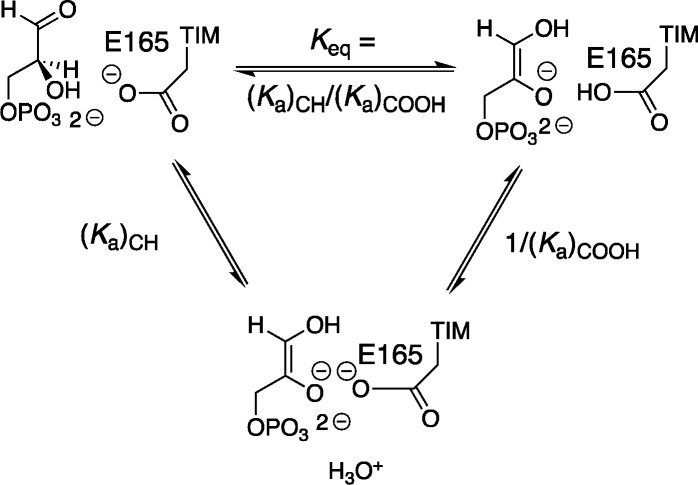
The binding of the enediolate analog I3– from water to TIM to form EH·I3– is accompanied by protonation of the catalytic side-chain (Scheme 3). By contrast, the enediolate phosphate intermediate is not released to water, but rather is generated by deprotonation of bound GAP (Keq, Scheme 4) to form the EH·Enediolate complex, where the proton at E165 is derived from substrate, not water. The LFER from Figure 3 shows that I3– is an excellent analog for the enediolate phosphate trianion, so that the binding of each of these ligands is expected to induce an increase in the basicity of the glutamate side-chain. The increase in side-chain basicity will increase the driving force for intermolecular proton transfer to form EH·Enediolate: we propose that this change in driving force for proton transfer is an important consequence of the ligand driven conformational change of TIM.
Scheme 4. Equilibrium Constant for Intermolecular Proton Transfer from Enzyme-Bound GAP to the Carboxylate Side-Chain of TIM (Keq) Expressed as the Ratio of Acidity Constants for Proton Transfer Reactions Mediated by Water [(Ka)CH/(Ka)COOH].
Table 2 reports values of pKEHI for deprotonation of EH·I3– for several mutants of TIM, of Δ(pK)EHI for the effect these mutations on the basicity of E165 at EH·I3–, and of Δlog (kcat/Km) for the effect on the activation barrier to TIM-catalyzed isomerization of GAP. This table shows that these mutations result in strikingly similar changes in the reaction activation barrier (Δlog (kcat/Km)), in Δ(pK)EHI for deprotonation of the complex to the enediolate (EH·I3–) and, we propose, in Δ(pK)EHI for deprotonation of the complex to the true enediolate intermediate.
Table 2. Comparison of the Effect of Mutations of Side-Chains near the Active Site of TIM on Catalytic Activity and the Stability of Complexes to PGA Trianion (I3–).
| Enzyme | log (Ki)E | pKEHI | Δ(pK)EHIa | Δlog (kcat/Km)b |
|---|---|---|---|---|
| Wildtype chicken | –1.7 | 10.5 | ||
| Wildtype Tbb | –1.7 | 10.0 | ||
| Wildtype yeast | –1.7 | 10.4 | ||
| TbbP166A | –2.0 | 9.3 | 0.7 | 1.4 |
| yS211A | –2.6 | 8.2 | 2.2 | 1.6 |
| TbbI170A | –2.1 | 7.7 | 2.3 | 1.9 |
| cL7R | –2.6 | 6.7 | 3.8 | 2.4 |
| yY208F | –1.8 | 6.3 | 4.1 | 3.1 |
The difference in the pKEHI for each mutant comparing to the wildtype enzyme.
Difference in the log(kcat/Km) for each mutant comparing to the wildtype enzyme.
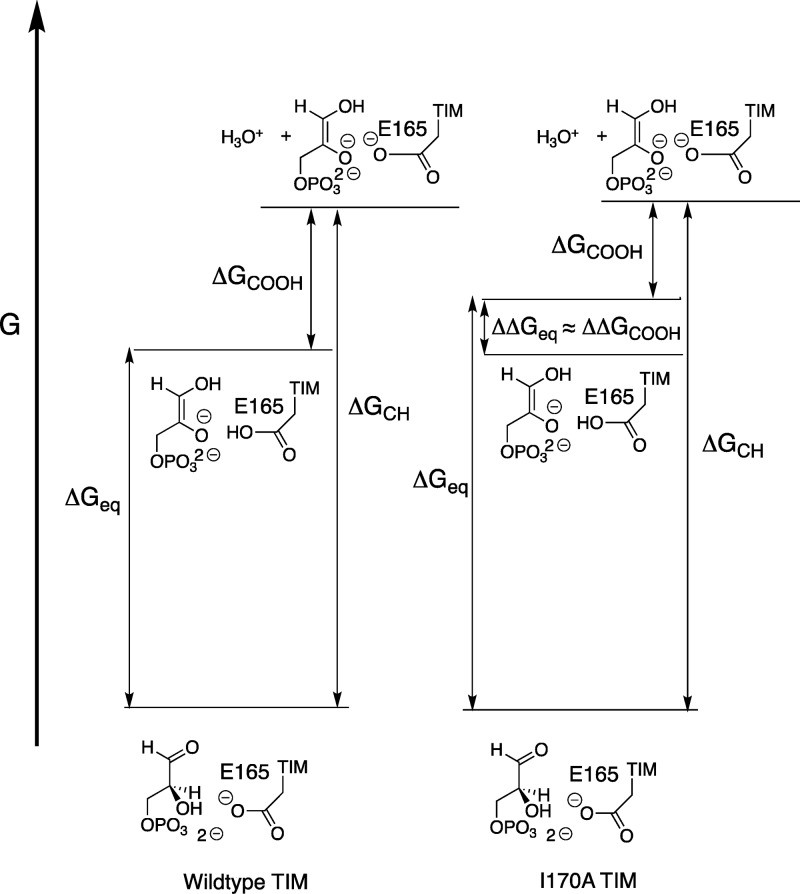
Wildtype TIM-catalyzed isomerization proceeds with several kinetically significant steps (Scheme 1). Our discussion will focus on the barrier to TIM-catalyzed deprotonation of substrate to form the EH·Enediolate intermediate, because this barrier largely controls the overall barrier to kcat for reaction of enzyme-bound substrate.11Figure 6, drawn for Scheme 4, compares the energetics for isomerization catalyzed by wildtype TIM and the I170A mutant of TIM, where ΔGeq for intermolecular proton transfer at the enzyme is controlled by the difference in pKCH for deprotonation of the carbon acid substrate (ΔGCH) and pKCOOH for deprotonation of the carboxylic acid side-chain of E165 (ΔGCOOH). The I170A mutation results in a falloff in kcat/Km and a decrease in pKEHI (Table 2). If ΔpKCOOH = ΔpKEHI = 2.3 for complexes to PGA trianion and to the enediolate intermediate, then we note the similarity between ΔpKCOOH = 2.3 for the I170A mutant, Δlog (kcat/Km) = 1.9 (Table 2) and Δlog Keq = 2.3 determined by empirical valence bond calculations.11 These similar effects of the I170A mutation on the kinetic [Δlog (kcat/Km)] and thermodynamic [Δlog Keq = 2.3] reaction barriers for deprotonation of substrate bound to TIM, and on the barrier for E165 side-chain deprotonation [ΔpKCOOH] is shown in Figure 6 as the matching ca. 3 kcal/mol effects of the I170A mutation on ΔΔGeq and ΔΔGCOOH. We suggest that, by contrast, the I170A mutation has little or no effect on the barrier to proton transfer from the E·GAP to solvent (KCH, Figure 6).
Figure 6.
Free energy diagram that compares deprotonation of GAP at the active sites of wildtype and I170A mutant TIMs. The product of the reaction, with free energy barrier ΔGeq, is the EH·Enediolate, which undergoes hypothetical proton transfer to solvent with pKCOOH to form E–·Enediolate. Figure 6 is drawn to show that the 3.0 kcal larger barrier for oxygen deprotonation of EH·Enediolate at wildtype, compared with mutant TIM (ΔΔGCOOH) (Table 2) is linked to 3.0 kcal increase in ΔGeq (ΔΔGeq), calculated in an EVB computational study.11 The reaction coordinate for substrate deprotonation is not shown in this Figure, but a late enediolate like transition state is assumed for TIM-catalyzed deprotonation of GAP.
The following arguments support the proposal that TIM acts specifically to reduce the thermodynamic barrier to intermolecular proton transfer at the enzyme (ΔGeq), but has a much smaller effect on the thermodynamic barrier for proton transfer from enzyme-bound substrate to solvent (ΔGCH), as shown in Figure 6.
(1) Mutations that stabilize EH·I3– toward loss of a proton (KEHI) cause little of no change in the stability of E–·I3– toward disassociation of I3– ((Ki)E, Tables 1 and 2). In other words, wildtype TIM provides optimal stabilization of EH·I3–, but a much smaller stabilization of the E–·I3– complex. We propose that there is a similar trend for the EH·Enediolate and E–·Enediolate complexes.
(2) Results from empirical valence bond calculations show that the effect of the I170A mutation on the stability of the EH·Enediolate relative to E–·GAP is due mainly to the effect of the mutation on stabilizing electrostatic interactions between TIM and the enzyme-bound intermediate.11 We propose that these stabilizing electrostatic interactions are largely lost at the E–·Enediolate complex, because of shifts in the position of interacting polar groups at E–·Enediolate compared with EH·Enediolate. If there is only weak stabilization of the E–·Enediolate complex, then there can be no significant difference between the stabilization of E–·Enediolate complexes to wildtype and to I170A mutant TIM, as shown in Figure 6.
Origin of the Catalytic Rate Acceleration for TIM
The prime imperative for enzymatic catalysis of deprotonation of weak carbon acids is to reduce the thermodynamic barrier for proton transfer at the enzyme compared to proton transfer from substrate to solvent.47,48 We propose that the large thermodynamic driving force for deprotonation of enzyme-bound substrates GAP or DHAP11 is reflected by a strong basicity of the E165 side-chain at the complex to the enediolate reaction intermediate (EH·Enediolate). This proposal is strongly supported by the observation of a strong basicity of the E165 side-chain at the EH·I3– complex to the excellent enediolate analog phosphoglycolate (Table 2).
TIM may operate to increase Keq (Scheme 4) for proton transfer either through interactions that increase the basicity of the carboxylate anion of E165 or through interactions that increase the acidity of the carbon acid substrate. The difficulties in partitioning this overall effect into effects on substrate acidity and protein basicity have been discussed in a recent report of EVB calculations to model the effects of I170A, L230A and I170A/L230A mutations on the activation barrier to TIM-catalyzed deprotonation of substrate to form the enediolate phosphate reaction intermediate.11 The results of these calculations support the proposal that the effect of the protein catalyst on the driving force for proton transfer is due mainly to an increase in the stabilizing intermolecular electrostatic and hydrogen bonding interactions of the protein with the bound ligand that accompanies proton transfer.11,49,50 For example, there is evidence that TIM increases the driving force for deprotonation of bound substrate by providing preferential stabilization of negative charge at an enediolate oxygen compared with water.8,33,51
Empirical valence bond calculations show that ΔpKa for the reacting carbon acid and carboxylate base is reduced by 8 units, from 18.5 for deprotonation of DHAP by propionate anion in water to reaction in water to 10.7 units for proton transfer from DHAP to the carboxylate side-chain of E165.11 By comparison, the binding of PGA trianion to TIM results in a large ≈6 unit increase in the basicity of the E165 side-chain. One important question that remains is the extent to which the increase in side-chain basicity is expressed at the transition state for TIM-catalyzed proton transfer.17 The results of EVB calculations of the effect of I170A, L230A and I170A/L230A on ΔG° and ΔG‡ for deprotonation of enzyme-bound DHAP or GAP show that 80% of the change in ΔG° for enediolate formation is expressed at the transition state for enzyme-catalyzed proton transfer.11
SUMMARY AND CONCLUSIONS
The excellent linear free energy relationship from Figure 3 shows that the effect of mutations of TIM on the stability of the complex to PGA trianion (I3–) and on the transition state for TIM-catalyzed isomerization are remarkably similar, so that I3– serves as an excellent analog for the enediolate phosphate intermediate. The binding of I3– to TIM drives a large enzyme conformational change that induces a ca. 6 unit increase in the pKa for deprotonation of the carboxylic acid side-chain of E165 at the EH·I3– complex. A similar increase in the basicity of this side-chain, which occurs during intermolecular proton transfer from bound substrate to enzyme to form the EH·Enediolate complex, would promote catalysis of substrate deprotonation by causing an increase in the thermodynamic driving force for proton transfer.17 We have examined the effect of mutations of side-chains that play several different structural roles in promoting efficient proton transfer at the active site of TIM. The good correlation between the effect of mutations on kcat/Km for TIM-catalyzed isomerization of GAP, and the pKa for deprotonation of EH·I3– shows that effective catalysis by TIM is directly linked to a strong basicity of the catalytic glutamate, which provides a strong thermodynamic driving force for deprotonation of the enzyme-bound substrate. The strong basicity of E165 is promoted by Y208 and S211, which serve to clamp loop 6 over the substrate;35,45 by I170, which assists in the creation of a hydrophobic environment for E165;13,43 and, by P166, which functions in driving the carboxylate side-chain of E165 toward enzyme-bound substrate.34,52 These results provide strong support for the conclusion that the evolution of key architectural features of the active site of TIM was guided by the imperative to optimize the thermodynamic driving force for proton transfer from the enzyme-bound substrate to the E165 side-chain.
Acknowledgments
This work was generously supported by the following grants from the U.S. National Institutes of Health: GM116921 and GM039754.
Supporting Information Available
The Supporting Information is available free of charge on the ACS Publications website at DOI: 10.1021/jacs.8b04367.
Procedures for determination of the kinetic parameters kcat and Km for TIM-catalyzed isomerization of GAP, and inhibition constants (Ki)obs for inhibition of this reaction by PGA. Table S1: Kinetic parameters kcat and Km for isomerization of GAP catalyzed by wildtype and mutant TIMs. Table S2: Observed inhibition constants (Ki)obs for PGA inhibition of isomerization reactions catalyzed by wildtype cTIM, wildtype TbbTIM, P166A TbbTIM and L7R cTIM-catalyzed isomerization of GAP by PGA, and inhibition constants Ki calculated for binding of PGA trianion to these different TIMs. Table S3: Observed inhibition constants (Ki)obs for PGA inhibition of isomerization reactions catalyzed by wildtype yTIM, Y208T yTIM, Y208S yTIM, Y208A yTIM, Y208F yTIM, S211A yTIM, S211G yTIM, and Y208T/S211G yTIM, and inhibition constants Ki calculated for binding of PGA trianion to these different TIMs. Figures S1–S11: Michaelis–Menten plots for uninhibited and the PGA-inhibited isomerization of GAP catalyzed by three different wildtype TIMs and nine different mutant TIMs at pH that range from 4.9 to 9.9. Figure S12: pH-Rate profiles of values for kcat and kcat/Km determined for isomerization reactions of GAP catalyzed by wildtype TbbTIM, wildtype cTIM, P166A TbbTIM, I170A TbbTIM and L7R cTIM. Figure S13: pH-Rate profiles of values for kcat and kcat/Km determined for isomerization reactions of GAP catalyzed by wildtype yTIM, Y208T yTIM, Y208S yTIM, 208A yTIM and Y208F yTIM. Figure S14: pH-Rate profiles of values for kcat and kcat/Km determined for isomerization reactions of GAP catalyzed by S211G yTIM, S211A yTIM and Y208T/S211G yTIM. Figure S15: pH-Rate profiles of values for (Ki)obs determined for wildtype TIM from yeast, chicken and Typanosoma brucei brucei, and for ten different mutants of TIM (PDF)
Author Present Address
⊥ Discovery Sciences, AstraZeneca R&D Boston, 35 Gatehouse Dr., Waltham, Massachusetts 02451 United States.
The authors declare no competing financial interest.
Supplementary Material
References
- Knowles J. R.; Albery W. J. Acc. Chem. Res. 1977, 10, 105–11. 10.1021/ar50112a001. [DOI] [Google Scholar]
- Knowles J. R. Philos. Trans. R. Soc., B 1991, 332, 115–21. 10.1098/rstb.1991.0039. [DOI] [PubMed] [Google Scholar]
- Wierenga R. K.; Kapetaniou E. G.; Venkatesan R. Cell. Mol. Life Sci. 2010, 67, 3961–3982. 10.1007/s00018-010-0473-9. [DOI] [PMC free article] [PubMed] [Google Scholar]
- Raines R. T.; Sutton E. L.; Straus D. R.; Gilbert W.; Knowles J. R. Biochemistry 1986, 25, 7142–54. 10.1021/bi00370a057. [DOI] [PubMed] [Google Scholar]
- De la Mare S.; Coulson A. F. W.; Knowles J. R.; Priddle J. D.; Offord R. E. Biochem. J. 1972, 129, 321–31. 10.1042/bj1290321. [DOI] [PMC free article] [PubMed] [Google Scholar]
- Waley S. G.; Miller J. C.; Rose I. A.; O’Connell E. L. Nature 1970, 227, 181. 10.1038/227181a0. [DOI] [PubMed] [Google Scholar]
- Lodi P. J.; Knowles J. R. Biochemistry 1991, 30, 6948–56. 10.1021/bi00242a020. [DOI] [PubMed] [Google Scholar]
- Komives E. A.; Chang L. C.; Lolis E.; Tilton R. F.; Petsko G. A.; Knowles J. R. Biochemistry 1991, 30, 3011–19. 10.1021/bi00226a005. [DOI] [PubMed] [Google Scholar]
- Richard J. P. J. Am. Chem. Soc. 1984, 106, 4926–36. 10.1021/ja00329a050. [DOI] [Google Scholar]
- Richard J. P.; Amyes T. L.; Goryanova B.; Zhai X. Curr. Opin. Chem. Biol. 2014, 21, 1–10. 10.1016/j.cbpa.2014.03.001. [DOI] [PMC free article] [PubMed] [Google Scholar]
- Kulkarni Y. S.; Liao Q.; Petrović D.; Krüger D. M.; Strodel B.; Amyes T. L.; Richard J. P.; Kamerlin S. C. L. J. Am. Chem. Soc. 2017, 139, 10514–10525. 10.1021/jacs.7b05576. [DOI] [PMC free article] [PubMed] [Google Scholar]
- Kulkarni Y. S.; Liao Q.; Byléhn F.; Amyes T. L.; Richard J. P.; Kamerlin S. C. L. J. Am. Chem. Soc. 2018, 140, 3854–3857. 10.1021/jacs.8b00251. [DOI] [PMC free article] [PubMed] [Google Scholar]
- Richard J. P.; Amyes T. L.; Malabanan M. M.; Zhai X.; Kim K. J.; Reinhardt C. J.; Wierenga R. K.; Drake E. J.; Gulick A. M. Biochemistry 2016, 55, 3036–3047. 10.1021/acs.biochem.6b00311. [DOI] [PMC free article] [PubMed] [Google Scholar]
- Malabanan M. M.; Nitsch-Velasquez L.; Amyes T. L.; Richard J. P. J. Am. Chem. Soc. 2013, 135, 5978–5981. 10.1021/ja401504w. [DOI] [PMC free article] [PubMed] [Google Scholar]
- Malabanan M. M.; Koudelka A. P.; Amyes T. L.; Richard J. P. J. Am. Chem. Soc. 2012, 134, 10286–10298. 10.1021/ja303695u. [DOI] [PMC free article] [PubMed] [Google Scholar]
- Malabanan M. M.; Amyes T. L.; Richard J. P. J. Am. Chem. Soc. 2011, 133, 16428–16431. 10.1021/ja208019p. [DOI] [PMC free article] [PubMed] [Google Scholar]
- Richard J. P. Biochemistry 1998, 37, 4305–4309. 10.1021/bi972655r. [DOI] [PubMed] [Google Scholar]
- Pauling L. Nature 1948, 161, 707–709. 10.1038/161707a0. [DOI] [PubMed] [Google Scholar]
- Wolfenden R. Nature 1969, 223, 704–705. 10.1038/223704a0. [DOI] [PubMed] [Google Scholar]
- Hartman F.; Lamuraglia G.; Tomozawa Y.; Wolfenden R. Biochemistry 1975, 14, 5274–5279. 10.1021/bi00695a007. [DOI] [PubMed] [Google Scholar]
- Campbell I. D.; Jones R. B.; Kiener P. A.; Waley S. G. Biochem. J. 1979, 179, 607–621. 10.1042/bj1790607. [DOI] [PMC free article] [PubMed] [Google Scholar]
- Campbell I. D.; Jones R. B.; Kiener P. A.; Richards E.; Waley S. C.; Wolfenden R. Biochem. Biophys. Res. Commun. 1978, 83, 347–52. 10.1016/0006-291X(78)90438-2. [DOI] [PubMed] [Google Scholar]
- Lolis E.; Petsko G. A. Biochemistry 1990, 29, 6619–25. 10.1021/bi00480a010. [DOI] [PubMed] [Google Scholar]
- Jogl G.; Rozovsky S.; McDermott A. E.; Tong L. Proc. Natl. Acad. Sci. U. S. A. 2003, 100, 50–55. 10.1073/pnas.0233793100. [DOI] [PMC free article] [PubMed] [Google Scholar]
- Bartlett P. A.; Marlowe C. K. Biochemistry 1983, 22, 4618–4624. 10.1021/bi00289a002. [DOI] [PubMed] [Google Scholar]
- Reyes A. C.; Zhai X.; Morgan K. T.; Reinhardt C. J.; Amyes T. L.; Richard J. P. J. Am. Chem. Soc. 2015, 137, 1372–1382. 10.1021/ja5123842. [DOI] [PMC free article] [PubMed] [Google Scholar]
- O’Connor E. J.; Tomita Y.; McDermott A. E. J. Labelled Compd. Radiopharm. 1994, 34, 735–40. 10.1002/jlcr.2580340806. [DOI] [Google Scholar]
- Bergemeyer H. U.; Haid E.; Nelboeck-Hochstetter M.. Process for preparing open ring tetrose and triosephosphate acetals and phosphate ketals. Patent US3662037A, 1972.
- O’Donoghue A. C.; Amyes T. L.; Richard J. P. Biochemistry 2005, 44, 2610–2621. 10.1021/bi047954c. [DOI] [PubMed] [Google Scholar]
- Richard J. P. Biochemistry 1985, 24, 949–53. 10.1021/bi00325a021. [DOI] [PubMed] [Google Scholar]
- Malabanan M. M.; Go M. K.; Amyes T. L.; Richard J. P. Biochemistry 2011, 50, 5767–5779. 10.1021/bi2005416. [DOI] [PMC free article] [PubMed] [Google Scholar]
- Wang Y.; Berlow R. B.; Loria J. P. Biochemistry 2009, 48, 4548–4556. 10.1021/bi9002887. [DOI] [PMC free article] [PubMed] [Google Scholar]
- Go M. K.; Koudelka A.; Amyes T. L.; Richard J. P. Biochemistry 2010, 49, 5377–5389. 10.1021/bi100538b. [DOI] [PMC free article] [PubMed] [Google Scholar]
- Zhai X.; Amyes T. L.; Wierenga R. K.; Loria J. P.; Richard J. P. Biochemistry 2013, 52, 5928–5940. 10.1021/bi401019h. [DOI] [PMC free article] [PubMed] [Google Scholar]
- Zhai X.; Amyes T. L.; Richard J. P. J. Am. Chem. Soc. 2015, 137, 15185–15197. 10.1021/jacs.5b09328. [DOI] [PMC free article] [PubMed] [Google Scholar]
- Zhai X.; Amyes T. L.; Richard J. P. J. Am. Chem. Soc. 2014, 136, 4145–4148. 10.1021/ja501103b. [DOI] [PMC free article] [PubMed] [Google Scholar]
- Gasteiger E.; Hoogland C.; Gattiker A.; Duvaud S.; Wilkins M. R.; Appel R. D.; Bairoch A. Proteomics Protoc. Handb. 2005, 571–607. 10.1385/1-59259-890-0:571. [DOI] [Google Scholar]
- Borchert T. V.; Abagyan R.; Kishan K. V.; Zeelen J. P.; Wierenga R. K. Structure 1993, 1, 205–13. 10.1016/0969-2126(93)90021-8. [DOI] [PubMed] [Google Scholar]
- Hartman F. C.; Ratrie H. III Biochem. Biophys. Res. Commun. 1977, 77, 746–752. 10.1016/S0006-291X(77)80041-7. [DOI] [PubMed] [Google Scholar]
- Plaut B.; Knowles J. R. Biochem. J. 1972, 129, 311–20. 10.1042/bj1290311. [DOI] [PMC free article] [PubMed] [Google Scholar]
- Balachandran N.; To F.; Berti P. J. Biochemistry 2017, 56, 592–601. 10.1021/acs.biochem.6b01211. [DOI] [PubMed] [Google Scholar]
- Wierenga R. K.; Noble M. E. M.; Vriend G.; Nauche S.; Hol W. G. J. J. Mol. Biol. 1991, 220, 995–1015. 10.1016/0022-2836(91)90368-G. [DOI] [PubMed] [Google Scholar]
- Kursula I.; Wierenga R. K. J. Biol. Chem. 2003, 278, 9544–9551. 10.1074/jbc.M211389200. [DOI] [PubMed] [Google Scholar]
- Sampson N. S.; Knowles J. R. Biochemistry 1992, 31, 8488–8494. 10.1021/bi00151a015. [DOI] [PubMed] [Google Scholar]
- Sampson N. S.; Knowles J. R. Biochemistry 1992, 31, 8482–8487. 10.1021/bi00151a014. [DOI] [PubMed] [Google Scholar]
- Malabanan M. M.; Amyes T. L.; Richard J. P. Curr. Opin. Struct. Biol. 2010, 20, 702–710. 10.1016/j.sbi.2010.09.005. [DOI] [PMC free article] [PubMed] [Google Scholar]
- Zhai X.; Malabanan M. M.; Amyes T. L.; Richard J. P. J. Phys. Org. Chem. 2014, 27, 269–276. 10.1002/poc.3195. [DOI] [PMC free article] [PubMed] [Google Scholar]
- Richard J. P. Biochemistry 2012, 51, 2652–2661. 10.1021/bi300195b. [DOI] [PMC free article] [PubMed] [Google Scholar]
- Warshel A.; Sharma P. K.; Kato M.; Parson W. W. Biochim. Biophys. Acta, Proteins Proteomics 2006, 1764, 1647–1676. 10.1016/j.bbapap.2006.08.007. [DOI] [PubMed] [Google Scholar]
- Warshel A. J. Biol. Chem. 1998, 273, 27035–27038. 10.1074/jbc.273.42.27035. [DOI] [PubMed] [Google Scholar]
- Lodi P. J.; Chang L. C.; Knowles J. R.; Komives E. A. Biochemistry 1994, 33, 2809–2814. 10.1021/bi00176a009. [DOI] [PubMed] [Google Scholar]
- Casteleijn M. G.; Alahuhta M.; Groebel K.; El-Sayed I.; Augustyns K.; Lambeir A. M.; Neubauer P.; Wierenga R. K. Biochemistry 2006, 45, 15483–94. 10.1021/bi061683j. [DOI] [PubMed] [Google Scholar]
Associated Data
This section collects any data citations, data availability statements, or supplementary materials included in this article.


