

Abstract
Surface acoustic wave nebulization (SAWN) is a novel method to transfer non-volatile analytes directly from the aqueous-phase to the gas-phase for mass spectrometric analysis. The lower ion energetics of SAWN and its planar nature make it appealing for analytically challenging lipid samples. This challenge is a result of their amphipathic nature, labile nature, and tendency to form aggregates, which readily precipitate clogging capillaries used for electrospray ionization (ESI). Here we report the use of SAWN to characterize the complex glycolipid, lipid A, which serves as the membrane anchor component of lipopolysaccharide (LPS) and has a pronounced tendency to clog nano-ESI capillaries. We also show that unlike ESI SAWN is capable of ionizing labile phospholipids without fragmentation. Lastly, we compare the ease of use of SAWN to the more conventional infusion-based ESI methods and demonstrate the ability to generate higher order tandem mass spectral data of lipid A for automated structure assignment using our previously reported hierarchical tandem mass spectrometry (HiTMS) algorithm. The ease of generating SAWN-MSn data combined with HiTMS interpretation offers the potential for high throughput lipid A structure analysis.
Keywords: Surface acoustic wave nebulization, SAWN, HiTMS, hierarchical tandem mass spectrometry, lipid A, phospholipid, lipopolysaccharide
Introduction
Lipids are a diverse class of biomolecules with roles in cellular membrane structure, cell signaling, trafficking, and lipid-protein interactions [1]. Due to their amphipathic nature, natural heterogeneity, and tendency to form aggregates [2], lipids are a particularly challenging class of analytes for identification and structural characterization [3, 4]. Despite these challenges, mass spectrometry (MS) is the method of choice for lipids analysis due to its high throughput nature, analytical sensitivity, and ability to elucidate intricate chemical structures [5–8]. Electrospray ionization (ESI) and matrix-assisted laser desorption (MALDI) are the most widely adopted ionization techniques mainly due to their relative softness that allows molecular ions of the intact molecule to be detected after ionization [9–11]. However, both techniques have specific limitations that will be outlined below, and therefore development of novel, softer ionization methods remains an active field of research [12–15].
MALDI, known for its ease of use and minimal training requirements suffers from matrix-ion interference at low mass/charge (m/z) [12] and imparts higher energies to analytes during ionization than ESI, which in turn can result in fragmentation of covalent bonds. While ESI is softer than MALDI and free of matrix, the use of capillaries required for fluid handling and ionization is problematic due to a tendency of some lipids to aggregate and clog ESI needles. The limitations of these traditional fluid handling techniques and ionization methods have therefore driven the integration of microfabricated, miniaturized systems to both improve performance and reduce sample loss. Specifically, several methods have been developed to integrate continuous flow microfluidics with microfabricated ESI tips that allow custom fluid handling solutions with the ease of integrated ESI spray tips [13, 14]. However, none of these improvements solve the problems associated with lipid analysis by ESI.
Recently we developed a novel ionization method, termed Surface Acoustic Wave Nebulization (SAWN) to generate ions of low internal energy from a planar piezoelectric surface (Figure 1) [16]. Surface acoustic wave (SAW) transducers are widely employed in the electronics industry and SAW technology has been utilized in various ways to manipulate fluids and as a microchip biosensor platform [17–20]. The use of a SAW to nebulize liquid samples placed on the surface of a piezoelectric lithium niobate wafer addresses some of the disadvantages of ESI and MALDI. SAWN functions by applying a radiofrequency (RF) signal to an interdigitated transducer (IDT) patterned onto a piezoelectric lithium niobate wafer. The SAW propagates along the surface and is refracted into a drop of liquid deposited on the SAWN chip. As energy is transferred to the liquid, nebulization occurs (Figure 1) [21, 22]. In our initial report, we demonstrated that SAW aerosols yield charged molecules from which MS1 and MS2 spectra could be recorded [16]. Another recent report demonstrated that SAWN can also be coupled with paper-based sample delivery [23]. In addition, we have also shown recently that a larger percentage of benzylpyridinium precursor ions survive the desorption/ionization by SAWN than by ESI [24], indicating that SAWN imparts less energy to ions during transfer to the mass spectrometer than ESI, thereby making it a “softer” ionization method.
Figure 1.
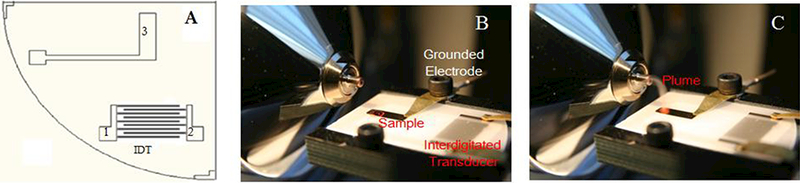
Configuration of the surface acoustic wave nebulization (SAWN) chip. Electrodes 1 and 2 of the interdigitated transducer (IDT) are connected to a signal generator and produce the surface acoustic wave upon application of an RF signal. Electrode 3 is used to ground the chip surface and liquid droplet containing the analyte (A). Coupling SAWN at atmospheric pressure (AP) to the inlet of a mass spectrometer where a drop of liquid is visible prior to SAW activation (B) and the nebulized plume entering the inlet post SAW activation (C).
The combination of a planar device like MALDI that produces ions of lower internal energy than ESI led us to investigate the use of SAWN on two classes of lipids important in bacterial response to their environments. Specifically, lipopolysaccharide (LPS) and phospholipids are structures that are regulated by an adaptive mechanism to resist host innate immune killing mechanisms [25, 26]. Lipid A, the membrane anchor and endotoxic portion of LPS is present in high abundance in the outer membrane of Gram-negative bacteria. In response to environmental cues, bacteria regulate their lipid A structures through a variety of covalent modifications resulting in structural variability across species and within species [27–31]. Phospholipids, present in both the inner and outer membrane, play major roles (cell signaling, energy storage, cellular shape, etc.) in the biochemistry of living cells and are abundant in all organisms [7]. Thus, there is a great deal of interest in characterizing these two classes of bacterial lipids. The diversity of lipid structures makes structural analysis challenging and their chemical nature (positional isomers) often makes separation by conventional chromatography for online ESI-MS-MS analysis difficult or impossible in the case of lipid A where extracts contain dozens of closely related structures. Furthermore, the hydrophobic nature of lipid A results in a propensity to form lamellar structures (micelles) making analysis in capillaries, as required by ESI, tedious at best.
Traditionally, lipid A structures have been manually assigned from tandem mass spectra, a process that requires a great deal of expertise and time, making structural assignment decidedly low-throughput. To overcome this low-throughput nature, various automated structural classifications have been developed [32–34]. One of these, hierarchical tandem mass spectrometry (HiTMS), is an automated informatics pipeline developed originally by our group to solve lipid A structures [35]. Here we use SAWN to generate higher order tandem MS (MSn) data from lipid A isolated from Gram-negative bacteria and HiTMS to automatically assign lipid A structure. Together SAWN and HiTMS provide a high-throughput lipid A structure characterization platform that will allow more rapid advances in the study of microbial-host interactions.
Materials and Methods
Purified and detoxified lipid A, Salmonella minnesota, and commercial phospholipids, 1-palmitoyl-2-oleoyl-sn-glycero-3-phospho-(1’-rac-glycerol) (Phosphatidylglycerol, POPG, PG(16:0/18:1)) and l-palmitoyl-2-oleoyl-.w-glycero-3-phosphoethanolamine (Phosphatidylehanolamine, POPE, PE(16:0/18:1) were purchased from Avanti Polar Lipids, Inc. (Alabaster, AL, USA). Lipid A from Francisella novicida grown at 37 °C was extracted using a microwave-based [36] or Bligh-Dyer extraction method [37], Each lipid was dissolved into a solution in CHCI3/CH3OH (2:1 v:v for lipid A and 1:10 for phospholipid) and introduced to the SAWN assembly by simple pipetting with a micropipet. Each droplet contained 2–3 μL of sample and generated a plume that lasted a few seconds. Single drops could generate mass spectrum, but in order to enhance the signal to noise ratio, multiple drops were loaded sequentially. For each spectrum shown the ion signal was acquired over a total volume of 10 μL from several droplets. The total experimental time for one MS spectrum took less than one minute.
The fabrication and operation of SAWN chips have been reported in detail elsewhere [16], Briefly, a 128 Y-cut X-propagating 3 inch LiNbO3 wafer (Crystal Technology Inc., Palo Alto, CA, USA) was used as a substrate to pattern a SAW transducer. SAWN electrodes were patterned using positive photo resist with a chrome mask made with a Heidelberg μPG 101 Laser Pattern Generator (Heidelberg Instruments, Heidelberg, Germany) at the University of Washington Nanotech User Facility (http://depts.washington.edu/ntuf). Each device had 20 pairs of 100 μm interdigitated (IDT) electrodes (40 in total) with 100 μm spacing and 10 mm aperture. The SAWN chip was mounted on a platform placed in front of the inlet capillary of the mass spectrometer. The inlet capillary was set to 300 °C. A SYNAPT G1 (Waters, Manchester, UK), a LTQ Velos, and a LTQ FT (Thermo Scientific, San Jose, CA, USA) were used for the experiments. Ion trap tandem MS were used to identify bacteria species with closely related lipid structures. Ion trap mass scans were performed up to m/z 2000. The SYNAPT was operated in V-mode at a 1 Hz sampling frequency for enhanced sensitivity.
To compare SAWN to ESI, all experimental conditions (solution compositions, voltages of ion optics, and capillary temperature) were kept identical. A spray voltage of 3.5 kV and a flow rate of 3 μL/min were used for ESI. To mitigate the effect of instantaneous signal fluctuations, the data were averaged over one minute. After introducing the lipid samples through the ESI source, the capillary line used to deliver sample to the ESI set-up was rinsed for thirty minutes with CHCI3/CH3OH (2:1 v:v) to prevent sample carryover. The spray tip was changed when it was clogged either during the actual runs or between samples. In contrast, SAWN required only a few seconds of scrubbing with a cotton swab and methanol on the surface of the chip for cleanup between samples. A linear ion trap mass spectrometer (LTQ-Velos, Thermo Scientific) was used for ESI and SAWN comparisons.
The detailed procedure of theoretical database construction for species specific lipid A and HiTMS algorithms are reported elsewhere [35]. MS experiments with LTQ-Velos generate data files in “raw” format. These raw files were converted into the mzXML data format by ReAdW, available in Xcalibur software (Thermo Scientific). The peak information from averaged mass spectra was extracted using MassSpecWavelet (Bioconductor project, http://www.bioconductor.org). The resulting peak information of each MSn spectrum was recorded in a peak list file. Acquired peak list files were searched against a theoretical signature ion database. From any identified signature ions, the neutral losses from the precursor ions were subsequently calculated and searched against the neutral loss database. A mass tolerance of 1 Da was used for the database search. The combination of signature ions and neutral losses provided candidate structures and X-score was applied to evaluate the closeness between every MSn spectrum and the predicted spectra of candidate structures.
Results and Discussion
SAWN mass spectrometry
SAWN, coupled with mass spectrometry, has been used to analyze, peptide and substituted benzylpyridinium salts [16, 23, 24]. Despite its demonstrated efficacy in producing ions, the mechanism of SAWN ion production is not well understood. The current most likely explanation put forward in a recent report suggests that the mechanism involves surface charging based on deformation of the piezo-electric substrate through which the SAW travels prior to nebulization. Subsequent to nebulization it is likely that ion evaporation from the charged droplet produces protonated and deprotonated molecular ions [23] in a manner similar to other atmospheric pressure ionization (API) sources. In another recent report, preformed ions were successfully analyzed using SAWN to demonstrate that ions produced by SAWN are less energetic than those produced by ESI. In these experiments a series of substituted benzylpyridinium salts that exist in solution as cations with associated counter anions were analyzed by both SAWN-MS and ESI-MS. In the absence of a voltage applied to the SAWN chip to aid nebulization [24], it is likely that both cations and anions were nebulized at the same time because both could be detected under identical conditions save for a reverse in the polarity of the MS detector [24]. Given the ease with which SAWN may be conducted and the lower ion internal energies, we examined the effectiveness of SAWN to facilitate study of two classes of lipids: phospholipids and the glycolipid known as Lipid A.
SAWN of highly purified Salmonella minnesota Lipid A.
For our initial experiments on lipids, a solution of commercially available detoxified lipid A (1 position phosphate moiety is removed) from Salmonella minnesota was nebulized by SAWN and characterized by MS and MSn. The SAWN method successfully generated Salmonella minnesota lipid A ions in both positive and negative ion mode (Figure 2), which were consistent with previous reports [38, 39]. Three major isotopic distributions were observed in positive (m/z 1530, 1740 and 1978) and negative (m/z 1506, 1716, and 1954) ion modes as depicted in Figure 2A and 2B, respectively. Importantly, SAWN generated the same relative ion distribution as those of ESI (see Supporting Information Figure S1). Interestingly, this was not the case for previously published peptide mass spectra where SAWN produced a [M + H]+ ion approximately 30% the intensity of the base peak (doubly protonated peptide), but ESI produced a [M + H]+ ion that was less than 1% of the corresponding doubly protonated peptide base peak [16]. This could be interpreted as a role for the piezoelectric substrate stripping charge from the basic peptide relative to the same peptide analyzed by ESI in a chemically identical solution. With lipid A there are far fewer sites to protonate and deprotonate which may explain why there was no difference there between ESI and SAWN. According to the supplier, the major component in the sample should be C80H151N2O21P (mono-phosphorylated penta-acyl disaccharide, 1507 Da), whose protonated ion would correspond to m/z 1508. Instead, we detected a 1530 m/z ion in positive mode as the base peak, which was interpreted as a Na+ adduct of the expected 1507 Da species (Δm/z = 23). The presence of the m/z 1506 ion in the same mass range in negative mode supports this conclusion. In addition, ions at m/z 1740 and 1978 differ from m/z 1530 by 210 and 210 + 238 m/z units respectively, which correspond to two fatty acid chains (a myristic acid, C14H28O2 and a palmitic acid, C16H32O2 see Supporting Information Figure S2). Theoretical isotopic distributions fit correctly with the observed ones, and measured masses were within 40 ppm of the computed masses, which was within the operational parameters for V-mode operation of the SYNAPT Q-TOF instrument used in these experiments.
Figure 2.
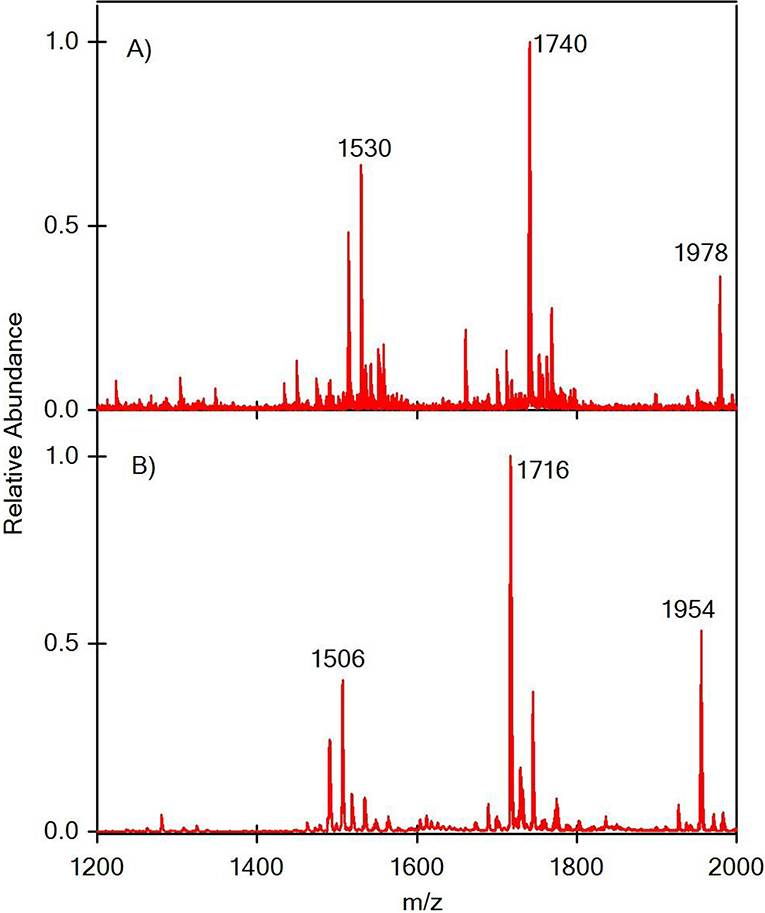
Surface acoustic wave nebulization (SAWN) of Salmonella minnesota lipid A in positive ion mode (A) and negative ion mode (B).
During these experiments it became clear that the signal intensity of SAWN generated ions was lower than for ESI (see Supporting Information Figure S1) by 2–3 orders of magnitude. We believe the reduced signal intensity is due to the larger droplet size produced by SAWN in comparison to ESI [22]. Obviously, droplets of larger volume require more energy to desolvate, and these larger droplets may also contribute to the lower ion internal energies of SAWN as well as the observed lower ionization efficiency [24].
While it was compelling to use the planar SAWN device for the sake of simplicity over ESI, the lower signal intensities of SAWN presented a concern for conducting hierarchical MSn analysis in an ion trap MS. As we have previously shown hierarchical MSn analysis is powerful for characterization of lipid A because the extracted material contains a mixture of closely related structures that only MSn analysis can tease apart [8, 27]. Thus, we investigated the degree to which the lower performance SAWN device could be coupled to MSn analysis to define lipid A structure. For SAWN-MSn analysis of the Salmonella minnesota lipid A sample in negative ion mode, the three major peaks at m/z 1506, 1716, and 1954 were successively selected for fragmentation. Consistent with our prior hypotheses regarding the Na+ lipid A ions, precursor ions at m/z 1716 lost a myristic acid and m/z 1954 yielded myristic acid and palmitic acid losses. Further fragmentation patterns were very similar between the three selected precursor ions. Therefore, we concluded, based on these data, that m/z 1716 (hexa-acyl disaccharide ion) and 1954 (hepta-acyl disaccharide ion) resulted from addition of myristate (Δm/z = 210) and palmitate (Δm/z = 238) to m/z 1506 (penta-acyl disaccharide ion), respectively. These same patterns were also observed for positive ion mode (see Supporting Information Figure S2). Briefly, the results of the MS4 experiment on the m/z 1716 precursor are discussed (Figure 3) relative to detailed structural assignment carried out from SAWN-MSn data. By conducting MS2 of the ion at m/z 1716, three major fragment ions were observed at m/z 1488, 1472, and 1244. The peak at m/z 1488 resulted from the loss of myristic acid ((14:0), C14H28O2, m/z 228). The fragment ion at m/z 1472 could be attributed to the loss of 3-hydroxytetradecanoic acid ((14:0)-3-OH, C14H28O3, m/z 244) at the 3-position. Combining losses of the two previous acids generates m/z 1244 (Figure 3A). In MS3 and MS4 modes, m/z 1036 and 1018 were generated by the loss of 3-hydroxytetradecanoic acid at the 3’-position. During these experiments we noted that while the overall ion signal intensity for SAWN was lower than for ESI (see Supporting Information), there was sufficient signal to allow MS4 analysis from a single drop of liquid placed on the chip.
Figure 3.
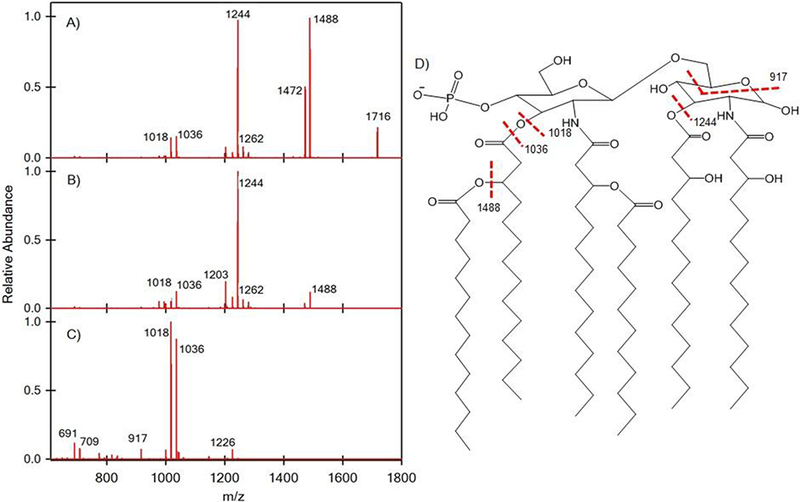
Surface acoustic wave nebulization (SAWN) tandem mass spectrometry (MSn) of Salmonella minnesota lipid A (shown in Figure 2) fragment ions: (A) MS2 of 1716, (B) MS3 of 1488, and (C) MS4 of 1244 where (D) is the structure of mono-phosphorylated hexa-acyl ion and fragmentation sites.
SAWN of Francisella novicida lipid A extract.
While the commercially available Salmonella minnesota lipid A was highly purified, real-life samples can be more challenging due to the presence dozens of structural isomers. For example, we previously reported on the existence of over 100 lipid A structures, defined by the aforementioned hierarchical MSn analysis and HiTMS analysis, from extracts of Francisella novicida grown at two different temperatures [35]. To test the applicability of SAWN in such cases, a lipid A extract of Francisella novicida from a single temperature growth condition was examined. The structures of lipid A isolated from Francisella novicida have been well studied widely by us and others using both ESI and MALDI [27, 35, 40, 41]. Here we showed that SAWN could in fact be used to generate a sufficient ion population for MS4 experiments from the heterogeneous Francisella novicida lipid A extract (see Figure 4). To illustrate our point that even with lower signal strength SAWN could still produce ions useful for structure prediction, we focus here on a few key fragmentation pathways. For example, the negatively charged precursor ion, m/z 1665 shown in Figure 4 was selected for fragmentation, resulting in a loss of a mono-hexosamine (C6O4NH14) ion at m/z 1504. The m/z 1409 originated from loss of a palmitic acid ((16:0), C16H32O2, m/z 256) and m/z 1248 resulted from a combined loss of mono-hexose and palmitic acid. The peak at m/z 1365 resulted from the loss of a 3-hydroxyoctadecanoic acid ((18:0)-3-OH, C18H36O3, m/z 300) at the 3-position and m/z 1204 was the combination of losses of mono-hexosamine and 3-hydroxyoctadecanoic acid. For MS3 of m/z 1204 (Figure 4B), the main fragment ion, m/z 948 was obtained by a loss of palmitic acid. The peak at m/z 922 was generated by the loss of an N-linked 3-hydroxyoctadecanoic acid at the 2-position. For MS4 of m/z 948 (Figure 4C), m/z 665 resulted from the loss of N-linked 3-hydroxyoctadecanoic acid at the 2-position. The peak at m/z 707 was also from the loss of N-linked 3-hydroxyoctadecanoic acid at the 2-position, but in this case, a stable acetamide group was formed at the 2-position. Instead of N-linked 3-hydroxyoctadecanoic acid cleavage, the glycosidic bond cleavage generated m/z 504 and 522.
Figure 4.
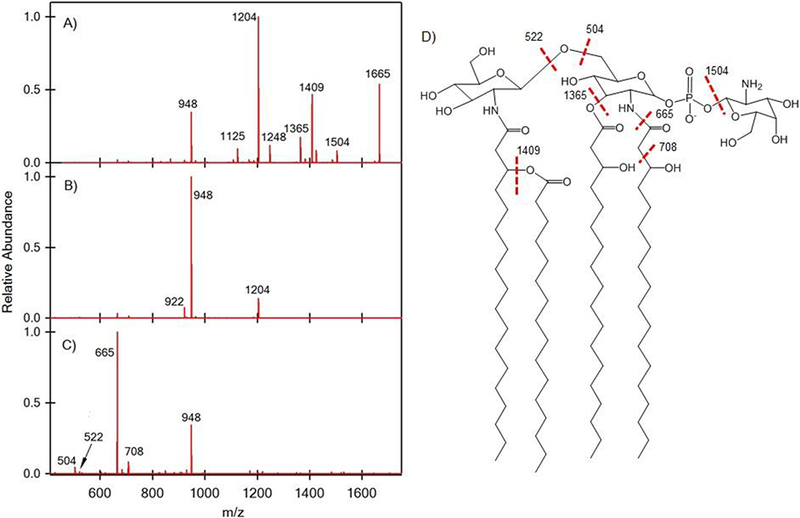
Surface acoustic wave nebulization (SAWN) tandem mass spectrometry (MSn) of Francisella novicida lipid A fragment ions: (A) MS2 of 1665, (B) MS3 of 1204, and (C) MS4 of 948 with (D) the annotated structure.
Automated lipid A structure assignment.
One of our goals in using SAWN-MSn is to facilitate more rapid lipid A structure assignment. As shown above, SAWN allowed straightforward generation of lipid A mass spectra and tandem mass spectra. However, data generation is only half of the problem with lipid A structure assignment. We next asked whether the above SAWN-MSn data were adequate for automated structure assignment using our automated lipid A structure elucidation software HiTMS [35], Firstly, in order to use HiTMS successfully one requires signature ions produced by glycosidic bond cleavage. As can be seen in Figure 4C the ions at m/z 504 and 522 are interpreted as such signature ions, allowing HiTMS to suggest the basic structure shown in Figure 5. It is worth noting that HiTMS uses a specific notation to guide structural interpretation, e.g. “18-ketene30H” represents a (18:0)-3-OH fatty acid and “Δ” represents a neutral loss. Here, the HiTMS process resulted in an annotated mass spectrum that suggested that “Δ18-ketene30H” became a fragment ion (m/z 665) with a (18:0)-3-OH loss from the precursor ion (m/z 948) where Y and Z represent m/z 522 (Y ion) and 504 (Z ion), respectively and P represents the phosphate group.
Figure 5.
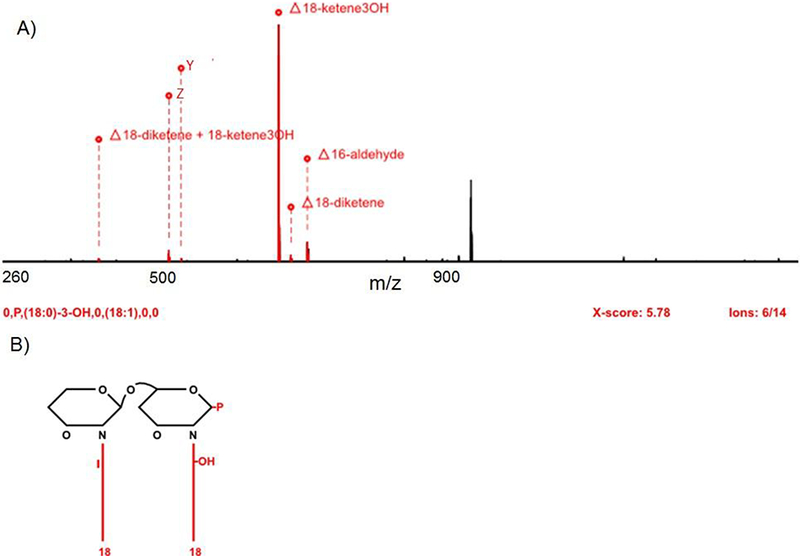
HiTMS result of a lipid A structure derived from MS4 spectrum. (A) Assigned theoretical neutral losses of lipid A spectrum, MS4 of m/z 948 (from MS3 of 1204, from MS2 of 1665), by HiTMS. (B) Retrieved lipid A structures of m/z 948.
Finally, to aid objective structure interpretation, HiTMS uses a scoring routine, i.e. a cross correlation score (X-score) similar to SEQUEST Xcorr, that reflects the closeness of fit between an acquired and a theoretical tandem mass spectrum [42, 43]. The derived structure in Figure 5B produced an X-score of 5.78, which is higher than the previously published basic cut off value of 3.0 for a good structure match [35]. Notably, this HiTMS structure assignment perfectly matched with the manual assignment shown in Figure 4D. To provide additional confidence in the assignment beyond the X-score, HiTMS also shows the ratio between detected ions and theoretical ions. HiTMS found that six ions in the SAWN-MS4 spectrum of m/z 948 (Figure 4C) matched 14 (or 43%) of the theoretical ions produced from the theoretical structure. Typically the ratio of HiTMS detected theoretical ions from ESI data, datasets used for the Ref 35, is in the range of 50–55 %. The lower match generated from SAWN-MSn spectra is attributed to the lower signal intensities than provided by ESI analysis. However, despite the lower overall ion signal, the SAWN data successfully yielded an accurate structure assignment.
From these experiments, we can conclude that SAWN is capable of producing results similar to ESI and MALDI [27] for both the highly purified Salmonella minnesota lipid A and the more complex Francisella novicida lipid A sample with significantly reduced preparative and experimental time over ESI. Importantly, the SAWN experiments were much simpler to carry out (much more like MALDI than ESI but without need for a matrix), easier to clean-up between samples (seconds rather than tens of minutes) making the overall process much faster than ESI, which takes several hours for preparation and clean up afterward. Thus, like MALDI the planar SAWN device facilitated lipid analysis, but provided the performance advantage of ESI on an ion trap mass spectrometer.
SAWN of phospholipids.
Phospholipids are another frequently studied class of molecule of great biological significance in microbiology that, like lipid A, can be difficult to study by conventional techniques [6, 7, 44]. Here we investigated whether SAWN would produce fragments of labile phospholipids to the same extent as ESI. This is generally an important consideration when analyzing chemical compounds of unknown composition because detecting the native precursor ion unperturbed by ionization will provide more accurate clues to the composition of the unknown. To test the “softness” of SAWN we analyzed a mixture of phosphatidylglycerol (PG (16:0/18:1)) and phosphoethanolamine (PE (16:0/18:1) by ESI and SAWN (Figure 6). Although ESI is known to be a soft ionization process, fatty acid chains are easily fragmented from phospholipids during ionization. In Figure 6A, peaks at m/z 255 and 281 show the 16:0 and 18:1 fatty acid ions respectively, while in Figure 6B the SAWN generated mass spectrum clearly shows a lack of detectable fragmentation in the precursor ion mass spectrum. Thus, analysis of labile compounds by SAWN offers a significant advantage over ESI. Additionally, SAWN again allowed tandem mass spectra on both phospholipids to be conducted revealing the expected in free fatty acid fragment ions at m/z 255 for the 16:0 species and at m/z 281 for the 18:1 species (Figure 6C,D). Also observed were fragment ions with a fatty acid and head group corresponding to loss of one neutral fatty acid for PG at m/z 483 and 465 (Figure 6C) and for PE at m/z 478 and 452 (Figure 6D). The peaks at m/z 391 and 417 are the neutral loss of 74 Da (C3H6O2) from 465 and 483 respectively (Figure 6C). This neutral loss was derived from the glycerol and is a characteristic of the PG species [44]. Thus, SAWN proved to be as beneficial as ESI for phospholipid analysis while also producing less fragmentation of the precursor ions.
Figure 6.
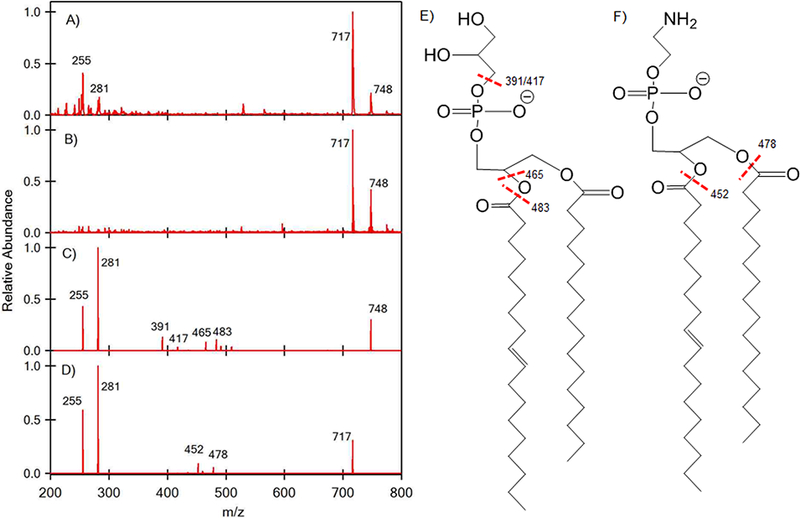
ESI MS1 of 1-palmitoyl-2-oleoyl-sn-glycero-3-phospho-(1’-rac-glycerol) (PG (16:0/18:1)) and 1-palmitoyl-2-oleoyl-sn-glycero-3-phosphoethanolamine (PE (16:0/18:1)) ion are shown in (A). SAWN MS1 of PG (16:0/18:1) and PE (16:0/18:1) ions are shown in (B). The ion at 748 (PG (16:0/18:1)) from (B) was subjected to MS2 to generate the ions shown in (C). The ion at 717 (PE (16:0/18:1)) from (B) was subjected to an MS2 to generate the ions shown in (D). The structure of PG (16:0/18:1) is shown in (E) and PE (16:0/18:1) in (F).
Conclusions
This proof-of-concept study demonstrated that SAWN facilitates lipid analysis for both simple mixtures of labile phospholipids and more complex mixtures of glycolipids like lipid A. In both cases, SAWN successfully generated both positive and negative ions of these analytes on both an ion trap and a q-TOF mass spectrometer. The advantages of using SAWN over conventional ionization methods are: 1) ionization occurs from a planar device circumventing clogging of capillaries which in turn facilitates higher throughput and ease of use in much the same way that MALDI does for the non-expert, 2) SAWN produces ions of lower internal energy than ESI, thereby preserving more of the labile phospholipid precursor ions, and 3) contrary to MALDI, no chemical matrix is required producing mass spectra free of matrix-based chemical noise in the low m/z region where lipids and their fragment ions are likely to be detected. Although the signal intensity of SAWN was lower than that of ESI, SAWN-MS readily generated multistage fragmentation spectra all the way up to MS4, allowing lipid A structures to be automatically assigned using the HiTMS algorithm. Thus, we feel that we have demonstrated the basis for a robust, high throughput platform for lipid A structure assignment and lipid analysis in general.
Supplementary Material
Acknowledgements
The authors thank the National Institutes of Health - grant 1U54 AI57141–01 (D.R.G. and R.K.E.), NSF grant 1143421 (J.S.E), and AI47938 (R.K.E.) and the Army Research Office (R.K.E) for funding and support. Additional thanks are due to the University of Washington, School of Pharmacy Mass Spectrometry Facility and University of Washington, School of Medicine Proteomics Resource (UWPR95794) as well as part of this work was conducted at the University of Washington NanoTech User Facility, a member of the National Science Foundation’s National Nanotechnology Infrastructure Network (NNIN). C.M. was awarded a CEA-Eurotalent outgoing fellowship (Grant PCOFUND-GA-2008–228664) to work at the University of Washington during the course of these experiments.
References
- 1.Cho WH; Stahelin RV, Membrane-protein interactions in cell signaling and membrane trafficking. In Annual review of biophysics and biomolecular structure, Annual Reviews: Palo Alto, 2005; Vol. 34, pp 119–151. [DOI] [PubMed] [Google Scholar]
- 2.Nelson DL; Cox MM, Lehninger principles of biochemistry. 5 ed.; W. H. Freeman: New York, 2008. [Google Scholar]
- 3.Miller SI; Ernst RK; Bader MW, Lps, tlr4 and infectious disease diversity. Nature Reviews Microbiology 2005, 3 (1), 36–46. [DOI] [PubMed] [Google Scholar]
- 4.Trent MS; Stead CM; Tran AX; Hankins JV, Diversity of endotoxin and its impact on pathogenesis. Journal of Endotoxin Research 2006, 12 (4), 205–223. [DOI] [PubMed] [Google Scholar]
- 5.Han XL; Gross RW, Global analyses of cellular lipidomes directly from crude extracts of biological samples by esi mass spectrometry: A bridge to lipidomics. Journal of Lipid Research 2003, 44 (6), 1071–1079. [DOI] [PubMed] [Google Scholar]
- 6.Han XL; Gross RW, Shotgun lipidomics: Electrospray ionization mass spectrometric analysis and quantitation of cellular lipidomes directly from crude extracts of biological samples. Mass Spectrometry Reviews 2005, 24 (3), 367–412. [DOI] [PubMed] [Google Scholar]
- 7.Pulfer M; Murphy RC, Electrospray mass spectrometry of phospholipids. Mass Spectrometry Reviews 2003, 22 (5), 332–364. [DOI] [PubMed] [Google Scholar]
- 8.Jones JW; Shaffer SA; Ernst RK; Goodlett DR; Turecek F, Determination of pyrophosphorylated forms of lipid a in gram-negative bacteria using a multivaried mass spectrometric approach. Proceedings of the National Academy of Sciences of the United States of America 2008, 105 (35), 12742–12747. [DOI] [PMC free article] [PubMed] [Google Scholar]
- 9.Fenn JB; Mann M; Meng CK; Wong SF; Whitehouse CM, Electrospray ionization for mass-spectrometry of large biomolecules. Science 1989, 246 (4926), 64–71. [DOI] [PubMed] [Google Scholar]
- 10.Karas M; Hillenkamp F, Laser desorption ionization of proteins with molecular masses exceeding 10000 daltons. Analytical Chemistry 1988, 60 (20), 2299–2301. [DOI] [PubMed] [Google Scholar]
- 11.Tanaka K; Waki H; Ido Y; Akita S; Yoshida Y; Yoshida T; Matsuo T, Protein and polymer analyses up to m/z 100 000 by laser ionization time-of-flight mass spectrometry. Rapid Communications in Mass Spectrometry 1988, 2 (8), 151–153. [Google Scholar]
- 12.Calvano CD; Palmisano F; Zambonin CG, Laser desorption/ionization time-of-flight mass spectrometry of triacylglycerols in oils. Rapid Communications in Mass Spectrometry 2005, 19 (10), 1315–1320. [DOI] [PubMed] [Google Scholar]
- 13.DeVoe DL; Lee CS, Microfluidic technologies for maldi-ms in proteomics. Electrophoresis 2006, 27 (18), 3559–3568. [DOI] [PubMed] [Google Scholar]
- 14.Sikanen T; Tuomikoski S; Ketola RA; Kostiainen R; Franssila S; Kotiaho T, Analytical characterization of microfabricated su-8 emitters for electrospray ionization mass spectrometry. Journal of Mass Spectrometry 2008, 43 (6), 726–735. [DOI] [PubMed] [Google Scholar]
- 15.Harris GA; Galhena AS; Fernandez FM, Ambient sampling/ionization mass spectrometry: Applications and current trends. Analytical Chemistry 2011, 83 (12), 4508–4538. [DOI] [PubMed] [Google Scholar]
- 16.Heron SR; Wilson R; Shaffer SA; Goodlett DR; Cooper JM, Surface acoustic wave nebulization of peptides as a microfluidic interface for mass spectrometry. Analytical Chemistry 2010, 82 (10), 3985–3989. [DOI] [PMC free article] [PubMed] [Google Scholar]
- 17.Alvarez M; Friend J; Yeo LY, Rapid generation of protein aerosols and nanoparticles via surface acoustic wave atomization. Nanotechnology 2008, 19 (45). [DOI] [PubMed] [Google Scholar]
- 18.Franke TA; Wixforth A, Microfluidics for miniaturized laboratories on a chip. Chemphyschem 2008, 9 (15), 2140–2156. [DOI] [PubMed] [Google Scholar]
- 19.Friend JR; Yeo LY; Arifin DR; Mechler A, Evaporative self-assembly assisted synthesis of polymeric nanoparticles by surface acoustic wave atomization. Nanotechnology 2008, 19 (14). [DOI] [PubMed] [Google Scholar]
- 20.Lange K; Rapp BE; Rapp M, Surface acoustic wave biosensors: A review. Analytical and Bioanalytical Chemistry 2008, 391 (5), 1509–1519. [DOI] [PubMed] [Google Scholar]
- 21.Yeo LY; Friend JR, Ultrafast microfluidics using surface acoustic waves. Biomicrofluidics 2009, 3 (1). [DOI] [PMC free article] [PubMed] [Google Scholar]
- 22.Qi AS; Friend JR; Yeo LY; Morton DAV; McIntosh MP; Spiccia L, Miniature inhalation therapy platform using surface acoustic wave microfluidic atomization. Lab Chip 2009, 9 (15), 2184–2193. [DOI] [PubMed] [Google Scholar]
- 23.Ho J; Tan MK; Go DB; Yeo LY; Friend JR; Chang HC, Paper-based microfluidic surface acoustic wave sample delivery and ionization source for rapid and sensitive ambient mass spectrometry. Analytical Chemistry 2011, 83 (9), 3260–3266. [DOI] [PubMed] [Google Scholar]
- 24.Huang Y; Yoon SH; Heron SR; Masselon CD; Edgar JS; Turecek F; Goodlett DR, Surface acoustic wave nebulization produces ions with lower internal energy than electrospray ionization. Journal of the American Society for Mass Spectrometry 2012, 23 (6), 1062–1070. [DOI] [PubMed] [Google Scholar]
- 25.Coats SR; Jones JW; Do CT; Braham PH; Bainbridge BW; To TT; Goodlett DR; Ernst RK; Darveau RP, Human toll-like receptor 4 responses to p-gingivalis are regulated by lipid a 1-and 4’-phosphatase activities. Cellular Microbiology 2009, 11 (11), 1587–1599. [DOI] [PMC free article] [PubMed] [Google Scholar]
- 26.Hornef MW; Wick MJ; Rhen M; Normark S, Bacterial strategies for overcoming host innate and adaptive immune responses. Nature Immunology 2002, 3 (11), 1033–1040. [DOI] [PubMed] [Google Scholar]
- 27.Shaffer SA; Harvey MD; Goodlett DR; Ernst RK, Structural heterogeneity and environmentally regulated remodeling of francisella tularensis subspecies novicida lipid a characterized by tandem mass spectrometry. Journal of the American Society for Mass Spectrometry 2007, 18 (6), 1080–1092. [DOI] [PMC free article] [PubMed] [Google Scholar]
- 28.Ernst RK; Hajjar AM; Tsai JH; Moskowitz SM; Wilson CB; Miller SI, Pseudomonas aeruginosa lipid a diversity and its recognition by toll-like receptor 4. Journal of Endotoxin Research 2003, 9 (6), 395–400. [DOI] [PubMed] [Google Scholar]
- 29.Guo L; Lim KB; Poduje CM; Daniel M; Gunn JS; Hackett M; Miller SI, Lipid a acylation and bacterial resistance against vertebrate antimicrobial peptides. Cell 1998, 95 (2), 189–198. [DOI] [PubMed] [Google Scholar]
- 30.Kannenberg EL; Carlson RW, Lipid a and o-chain modifications cause rhizobium lipopolysaccharides to become hydrophobic during bacteroid development. Molecular Microbiology 2001, 39 (2), 379–391. [DOI] [PubMed] [Google Scholar]
- 31.Knirel YA; Lindner B; Vinogradov EV; Kocharova NA; Senchenkova SN; Shaikhutdinova RZ; Dentovskaya SV; Fursova NK; Bakhteeva IV; Titareva GM; Balakhonov SV; Holst O; Gremyakova TA; Pier GB; Anisimov AP, Temperature-dependent variations and intraspecies diversity of the structure of the lipopolysaccharide of yersinia pestis. Biochemistry 2005, 44 (5), 1731–1743. [DOI] [PubMed] [Google Scholar]
- 32.Ekroos K; Chernushevich IV; Simons K; Shevchenko A, Quantitative profiling of phospholipids by multiple precursor ion scanning on a hybrid quadrupole time-of-flight mass spectrometer. Analytical Chemistry 2002, 74 (5), 941–949. [DOI] [PubMed] [Google Scholar]
- 33.Schwudke D; Oegema J; Burton L; Entchev E; Hannich JT; Ejsing CS; Kurzchalia T; Shevchenko A, Lipid profiling by multiple precursor and neutral loss scanning driven by the data-dependent acquisition. Analytical Chemistry 2006, 78 (2), 585–595. [DOI] [PubMed] [Google Scholar]
- 34.Yang K; Cheng H; Gross RW; Han X, Automated lipid identification and quantification by multidimensional mass spectrometry-based shotgun lipidomics. Analytical Chemistry 2009, 81 (11), 4356–4368. [DOI] [PMC free article] [PubMed] [Google Scholar]
- 35.Ting YS; Shaffer SA; Jones JW; Ng WV; Ernst RK; Goodlett DR, Automated lipid a structure assignment from hierarchical tandem mass spectrometry data. Journal of the American Society for Mass Spectrometry 2011, 22 (5), 856–866. [DOI] [PubMed] [Google Scholar]
- 36.Zhou P; Chandan V; Liu X; Chan K; Altman E; Li J, Microwave-assisted sample preparation for rapid and sensitive analysis of h-pylori lipid a applicable to a single colony. Journal of Lipid Research 2009, 50 (9), 1936–1944. [DOI] [PMC free article] [PubMed] [Google Scholar]
- 37.Bligh EG; Dyer WJ, A rapid method of total lipid extraction and purification. Canadian Journal of Biochemistry and Physiology 1959, 37 (8), 911–917. [DOI] [PubMed] [Google Scholar]
- 38.Johnson RS; Her GR; Grabarek J; Hawiger J; Reinhold VN, Structural characterization of monophosphoryl lipid-a homologs obtained from salmonella-minnesota re595 lipopolysaccharide. Journal of Biological Chemistry 1990, 265 (14), 8108–8116. [PubMed] [Google Scholar]
- 39.Qureshi N; Mascagni P; Ribi E; Takayama K, Monophosphoryl lipid-a obtained from lipopolysaccharides of salmonella-minnesota r595 - purification of the dimethyl derivative by high-performance liquid-chromatography and complete structural determination. Journal of Biological Chemistry 1985, 260 (9), 5271–5278. [PubMed] [Google Scholar]
- 40.Schilling B; McLendon MK; Phillips NJ; Apicella MA; Gibson BW, Characterization of lipid a acylation patterns in francisella tularensis, francisella novicida, and francisella philomiragia using multiple-stage mass spectrometry and matrix-assisted laser desorption/ionization on an intermediate vacuum source linear ion trap. Analytical Chemistry 2007, 79 (3), 1034–1042. [DOI] [PMC free article] [PubMed] [Google Scholar]
- 41.Wang X; Ribeiro AA; Guan Z; McGrath SC; Cotter RJ; Raetz CRH, Structure and biosynthesis of free lipid a molecules that replace lipopolysaccharide in francisella tularensis subsp novicida. Biochemistry 2006, 45 (48), 14427–14440. [DOI] [PMC free article] [PubMed] [Google Scholar]
- 42.Eng JK; Fischer B; Grossmann J; MacCoss MJ, A fast sequest cross correlation algorithm. Journal of Proteome Research 2008, 7 (10), 4598–4602. [DOI] [PubMed] [Google Scholar]
- 43.Eng JK; McCormack AL; Yates JR, An approach to correlate tandem mass-spectral data of peptides with amino-acid-sequences in a protein database. Journal of the American Society for Mass Spectrometry 1994, 5 (11), 976–989. [DOI] [PubMed] [Google Scholar]
- 44.Oursel D; Loutelier-Bourhis C; Orange N; Chevalier S; Norris V; Lange CM, Lipid composition of membranes of escherichia coli by liquid chromatography/tandem mass spectrometry using negative electrospray ionization. Rapid Communications in Mass Spectrometry 2007, 21 (11), 1721–1728. [DOI] [PubMed] [Google Scholar]
Associated Data
This section collects any data citations, data availability statements, or supplementary materials included in this article.