

Abstract
The CRISPR-Cas9 system provides unprecedented genome editing capabilities. However, off-target effects lead to sub-optimal usage and additionally are a bottleneck in the development of therapeutic uses. Herein, we introduce the first machine learning-based approach to off-target prediction, yielding a state-of-the-art model for CRISPR-Cas9 that outperforms all other guide design services. Our approach, Elevation, consists of two interdependent machine learning models—one for scoring individual guide-target pairs, and another which aggregates these guide-target scores into a single, overall summary guide score. Through systematic investigation, we demonstrate that Elevation performs substantially better than competing approaches on both tasks. Additionally, we are the first to systematically evaluate approaches on the guide summary score problem; we show that the most widely-used method performs no better than random at times, whereas Elevation consistently outperformed it, sometimes by an order of magnitude. We also introduce an evaluation method that balances errors between active and inactive guides, thereby encapsulating a range of practical use cases; Elevation is consistently superior to other methods across the entire range. Finally, because of the large scale and computational demands of off-target prediction, we have developed a cloud-based service for quick retrieval. This service provides end-to-end guide design by also incorporating our previously reported on-target model, Azimuth. (https://crispr.ml:please treat this web site as confidential until publication).
Introduction
Although the CRISPR-Cas9 system is routinely used, potentially avoidable off-target effects can complicate or hinder its use. The best way to mitigate off-target effects is to know when and where they occur and then design guides to avoid them while balancing for on-target efficiency.1,2 Such a balance may differ for different tasks. For example, the generation of cellular and animal models, or therapeutic uses of CRISPR-Cas9, will in general be far less tolerant of off-target effects than genome-wide screens wherein redundancy of targeting can be used to average out off-target effects. Nevertheless, reduction of off-target effects is desirable in all applications.
While GUIDE-seq3, HTGTS4, IDLV capture5, Digenome-seq6,7 CIRCLE-seq8, SITE-seq9, BLESS/BLISS10–12 and other laboratory-based assays1 can be used to quantify off-target effects, scaling these assays to all guide RNAs (gRNAs) genome-wide is not currently practically feasible for most research labs owing to cost, labor and availability of general-purpose assays.1 In contrast, as we show herein, machine learning-based predictive modelling can leverage a small number of such data to learn statistical regularities of gRNA-target sequence pairs that cause off-target effects, as well as their aggregate effect on a cell. Such modelling thus enables inexpensive and rapid in silico screening of off-target effects at a genome-wide level for gRNAs never before assayed.1,2,13
There are two main use cases for off-target predictive modelling. The first is to understand how active a given gRNA-off-target region is likely to be, which we refer to as gRNA-target scoring. This is useful if one is concerned about a particular region of the genome, such as accidentally knocking out a tumor-suppressor gene when trying to make an edit to disable an HIV entry receptor. The second use case is to obtain an overall summary score of all off-target region activities for a given gRNA so as to obtain a rank-order of good potential gRNAs. Therefore, one can break down the off-target predictive modelling problem into three main tasks: given a gRNA to evaluate for off-target activity one needs to:
Search and filter genome-wide for potential targets, for example, those regions of the genome matching the gRNA up to n number of nucleotide mismatches to the target site. Note, these sites are not deemed to be active off-targets until after step 2, which uses machine learning to distinguish the targets that are expected to be active from those that are not.
Score each potential target for activity from step i).
Aggregate the scores from step ii) into a single off-target potential with which to assess the gRNA.
A number of solutions have been presented for the first task of search and filter, including Cas-OFFinder14, CRISPOR15, CHOP-CHOP16, e-CRISPR17, CRISPR-DO18, CROP-IT19 and COSMID20, which differ in the algorithms used to search as well as the completeness of the search. Completeness is dictated by options such as maximum number of mismatches, allowed protospacer adjacent motifs (PAMs) and the search algorithm used. For infrastructural efficiencies and ease of integration with our cloud service, we created our own system to perform search and filtering; for the purposes herein, we used the same parameters as in ref.1 The second and third steps, of scoring and aggregation, have been explored considerably less than the search and filter step and are the focus of this work. A list of available gRNA design services that perform one or both of these steps is shown in Table 1. The only existing tools that return aggregation scores are the MIT web server21, CRISPOR15 and CRISPR-DO18, the latter two which re-implement the MIT web server rules. CHOP-CHOP16 counts the number of potential off-targets without scoring them; CROP-IT19 uses a hand-crafted series of rules and has been shown to be substantially outperformed by the MIT web server.15 Additionally, the CFD method1 has been shown to outperform the MIT web server on gRNA-target pair scoring15, but the CFD web server does not perform genome-wide off-target aggregation.
Table 1.
Summary of CRISPR gRNA design services which include off-target scoring
| Shorthand | On-target scoring | Off-target scoring | Off-target aggregator | On-target interface | Off-target interface |
|---|---|---|---|---|---|
| Elevation (this work) & Azimuth1 | new machine-learning based models | new machine-learning based models | Yes, machine-learning based | human exome targets pre-computed; cloud API for re-use in code and Excel; source code | human exome targets pre-computed web site; source code for any target |
| MIT server21 | new hand-crafted rules | new hand-crafted rules | Yes, hand-crafted rules | web site | web site |
| CRISPR-DO18 | re-uses rules from Xu et al.25 | re-uses rules from MIT server21 | Yes, as in MIT server | web site; source code | web site; source code |
| CRISPOR15 | re-uses rules from multiple papers1,25–30 | re-uses rules from MIT server21 | Yes, as in MIT server | web site; source code | web site; source code |
| Broad GPP1 | new machine-learning based models | newly developed rules based on data | Not genome-wide (only relative within-gene scores) | web site; source code | web site; source code |
| E-CRISPR17 | new hand-crafted rules, and rules from ref.18,25,27 | new hand-crafted rules | Yes, hand-crafted rules | web site | web site |
| CHOP-CHOP16 | re-uses rules from Xu et al.25 by default, and ref.1,26,27 | counts # of off-targets but does not score them | No | web site | web site |
Although alternative CRISPR systems that may possess improved specificity (e.g., Cpf122,23) are being developed, these systems are still in their relative infancy and Cas9 from S. pyogenes remains the workhorse endonuclease of choice. Moreover, only Cas9 has enough data to perform modelling at this point in time; hence our focus on Cas9 herein.
For each of gRNA-target scoring and gRNA summary scoring we developed a machine learning approach which substantially improved upon the state-of-the-art for the respective task, as demonstrated through our experiments. Together, we call our end-to-end modelling of off-targets, Elevation, which complements our on-target model, Azimuth. A schematic of our approach is shown in Figure 1.
Figure 1. Schematic of Elevation off-target predictive modelling.
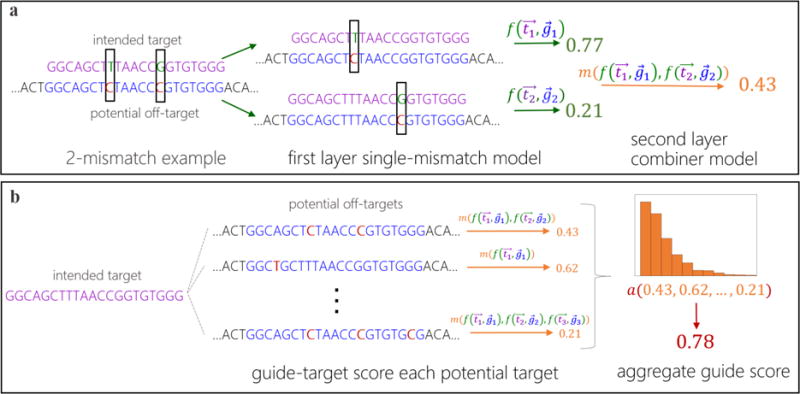
(a) An example of how to score a gRNA-target pair with two mismatches. First the gRNA-target pair is broken down into two single-mismatch pseudo-pairs, each of which is scored with the first layer (single mismatch) model, . Then these scores are combined with the second-layer model, , yielding a single gRNA-target score that accounts for all mismatches. (b) An example of how to aggregate the set of gRNA-target scores for a single gRNA into one summary off-target score for a gRNA. The aggregator model, a(), computes statistics of the input distribution of gRNA-target scores as features and runs them through a model, producing the aggregate score for a gRNA (e.g. 0.78).
For the first task, of gRNA-target scoring, we developed a two-layer regression model wherein the first layer learns to predict the off-target activity for single-mismatch (between the target and the intended target, thus including alternative PAMs) gRNA-target pairs. The second-layer model learns how to combine predictions from the single-mismatch model for gRNA-target pairs with multiple mismatches into a single gRNA-target score—our “combiner” model. For the combinatorial explosion of possible mismatch combinations, the amount of training data for the combiner model is extremely small. Consequently, we used a relatively simple model here—(penalized) linear regression. Note that indels contribute to the off-target problem24 but to a much lesser extent3, hence we have focused our modeling efforts on mismatches.
For the second task, of aggregating the individual target scores for a guide into a single number, we first apply our gRNA-target scoring model to a list of potential targets, and then use our newly developed modelling approach to aggregate them, while taking into account whether each target lies in a gene or not, and allowing these and other features to interact with each other by way of a non-linear modelling approach (boosted regression trees). Details and intuitions for development of the two-layer Elevation-score model and the Elevation-aggregate model are provided in the Methods.
Results
In this section, we first evaluate gRNA-target pair prediction models, including our newly developed Elevation-score. We demonstrate that Elevation-score yields state-of-the-art performance. In the next section we evaluate Elevation-aggregate alongside the two competing summarization approaches—the MIT web server and CFD aggregation, where only the former has an accompanying web service that provides summary scores (CFD provides only within-gene rankings). Again, we find that our approach performs best, sometimes by an order of magnitude.
Individual gRNA-target pair off-target predictive modelling
We started by evaluating our Elevation-score approach using two independent data sets generated from genome-wide unbiased assays—one based on GUIDE-Seq3, and the other aggregated data sets curated by Haeussler et al.15 (after removing the GUIDE-Seq data from it). Elevation-score outperformed all other models—CFD1, the current state-of-the-art, Hsu-Zhang2, and CCTop13—in predicting off-target activity (Figure 2). For a break-down of performance by number of mismatches, please see Supplementary Figure 3.
Figure 2. gRNA-target pair scoring.
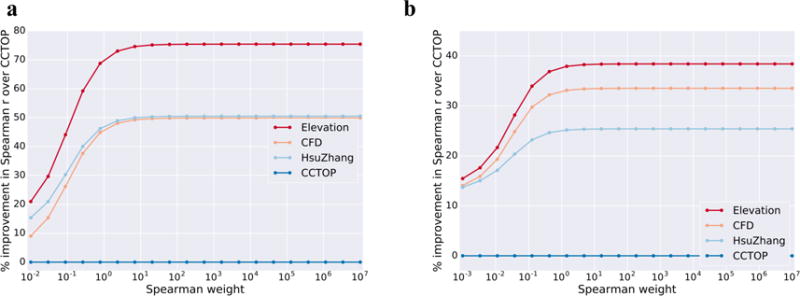
Comparison of Elevation-score performance to other methods, evaluated using a weighted Spearman correlation between predictions and assay measurements. The horizontal axis shows different weights in the weighted Spearman—at the far left the weight is effectively proportional to the rank-normalized GUIDE-Seq counts/cutting frequency, while at the far right the weight is effectively uniform, yielding a traditional Spearman correlation. For ease of visualization, the vertical axis denotes the percent improvement of each model over CCTOP, which by design thus lies constant at zero. (a) CD33 (N=4,853) and GUIDE-Seq (N=294,534) data were used to train, while Haeussler et al (N=10,129) data (after removing the GUIDE-Seq) were used to test. (b) the role of the GUIDE-Seq and Haeussler data are reversed from a. The final Elevation-score model deployed in our cloud service uses the model trained on GUIDE-Seq data. Note that respectively only 0.12% and 0.51% of count values in GUIDE-Seq and Haeussler are non-zero, making the traditional Spearman correlation difficult to interpret. For completeness, however, the right-most points correspond to a correlation of respectively 0.117, 0.100, 0.101 and 0.007 for Elevation, CFD, Hsu-Zhang and CCTOP in a) and 0.059, 0.057, 0.053 and 0.043 in b). The p-values computed for each Elevation correlation were less than floating point error (approximately 1×10⁻¹⁶); these demonstrate that despite the apparent low correlations, a tremendous amount of signal is present. Note that the apparent low correlations likely arise from the massive imbalance of inactive to active gRNAs.
Note that for off-target prediction it is generally more consequential to mistake an active off-target site for an inactive one, rather than the other way around, because only the first type of error can disrupt the cell or confound experimental interpretation, while the second may only require designing another gRNA. Consequently, we chose an evaluation measure which accounts for this asymmetry—the weighted Spearman correlation, where each gRNA-target pair is weighted by an amount which is a (monotonic) function of its measured activity. Because the precise asymmetry is not a priori known and may vary for different applications, we varied the weight continuously between two extremes: from being directly proportional to the measured activity (such that false negatives effectively do not count), to a uniform weighting (i.e., yielding standard Spearman correlation).
For first-layer (single-mismatch) model features we used (i) the position of the mismatch, (ii) the nucleotide identities of the mismatch, (iii) the joint position and identities of the mismatch in a single feature, and (iv) whether the mutation was a transition or transversion. The relative importance of these features is shown in Figure 3. It is interesting to note that using both the joint “position and mismatch nucleotide identity” features—those effectively used by CFD—are aided by additionally decoupling these into additional features of position and nucleotide identity, even though regression trees can in principle (with enough data) recover the joint features from the decoupled ones. Using only the CFD features in our model, or using classification instead of regression, or omitting the second-layer of our model each caused the model to perform worse (Supplementary Figure 1). Feature importances for the second-layer (multiple-mismatch combiner) model show that the total number of mismatches and the sum of the first layer single-mismatch predictions are driving the model (Supplemental Figure 2).
Figure 3. First-layer gRNA-target scoring feature importances.
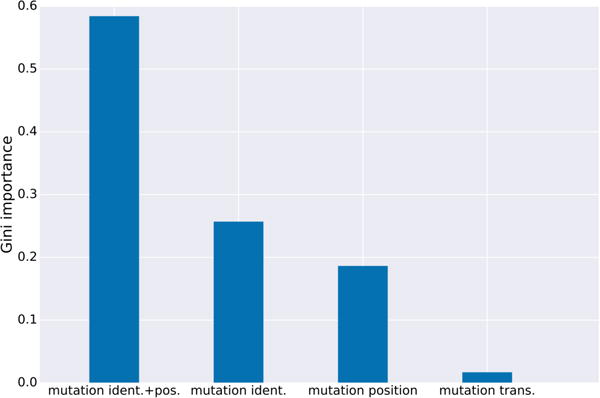
Average importances (Gini importances; see Methods) for type of features in the first-layer single-mismatch model (mutation nucleotide identities and position jointly; mutation identity; mutation position; mutation transversion vs. transition). This model was trained with CD33 single-mismatch data. Feature importances from the second layer model are shown in Supplementary Table 2.
Validation of Elevation-score
Finally, we performed two validation experiments of our final Elevation-score model by assessing its performance on two independent GUIDE-seq data sets—the first using the wild type Cas9 experiments from ref. 31, here referred to as Validation 1 (5 unique gRNAs), and the other newly generated experiments we performed, here referred to as Validation 2 (22 unique gRNAs, Supplementary Table 1, Methods). On the whole, Elevation outperforms the other models, with occasional ties (Figure 4). However, the performance ordering of CFD and HsuZhang changes between the two experiments, so even when one is close in performance to Elevation, it is never consistently so. Breakdown by number of mismatches is provided in Supplementary Figure 4.
Figure 4. Validation of the Elevation gRNA-target scoring model.
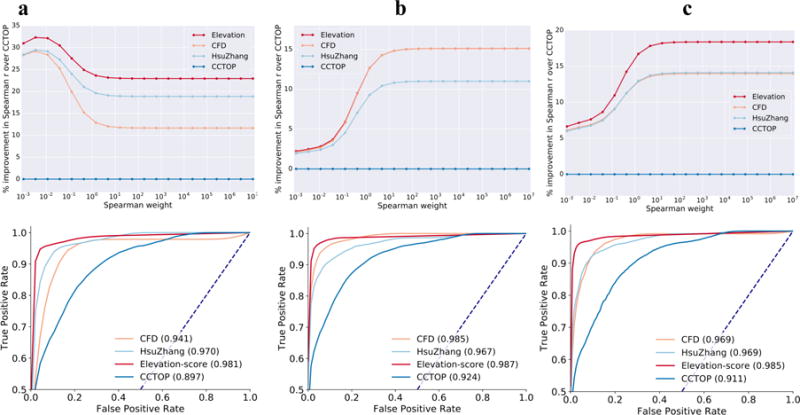
Performance of our final Elevation-score model on two independent validation sets (a) “Validation 1” (N=103,040 guide-target pairs of which 53 are active, arising from 5 sgRNAs), (b) and “Validation 2” (N=381,249 guide-target pairs of which 57 are active, arising from 22 sgRNAs), (c) (N=484,289 guide-target pairs of which 110 are active, arising from 27 sgRNAs). Although we believe our weighted Spearman correlation metric (top row) to be a particularly suitable evaluation metric, it is not necessarily intuitive to understand. Therefore, we also included (bottom row) ROC curve plots for classifier performance such as Haeussler et al. use for this same purpose. Note that random performance on the ROC is the dashed diagonal line and corresponds to AUC=0.50. Their corresponding AUC is written in the legend (higher is better), as these are more intuitive. The ROC/AUC evaluation measure is sub-optimal in that it only uses whether GUIDE-Seq found activity or not, rather than how much (which our Spearman-based metric does make use of). However, one can see that the ROC evaluation roughly tracks our Spearman-based metric. (For ease of visualization, ROC curves and AUCs are averages over 100 random samples of inactive guides equal in number to the number of active guides in each data set. Missing true positive rates at a given false positive rate, owing to the sampling, were linearly interpolated from the two nearest neighbors, within a curve).
As a secondary measure of performance, one could consider how each model ranks only the active off-targets (i.e., those detected by GUIDE-Seq). Supplementary Tables 2, 3 and 4 show such results on the validation data. Elevation again outperforms the competing methods.
Aggregating individual off-target scores into a single gRNA summary score
The end task, of aggregation, requires obtaining a single off-target summary score for a gRNA given all its individual gRNA-target scores. A solution to this task is particularly useful for gRNA design wherein users want to scan numerous gRNAs for overall activity. To evaluate our approach on this task we made use of two data sets with gRNAs targeting non-essential genes in viability screens, the Avana1 and Gecko32 libraries. Because each gRNA is designed to target one non-essential gene in these screens, the cell should be viable if no off-target effects are present. In particular, at least three papers have shown evidence that a cell is more likely to die when sustaining numerous DNA breaks.1,32,33 Additionally, a fourth paper leverages this phenomenon to assess off-target cutting.34 Therefore, there is now substantial evidence that cell viability is determined at least in part by the number of DNA breaks per cell. A second effect on viability could be off-target activity at an essential gene. However, essential genes cover merely 0.2% of the human genome and are therefore not likely to have much effect in our experiments. To further elucidate this point, we evaluate the performance of our model using only gene essentiality as a feature, which performs vastly worse than when we either ignore it altogether, or additionally use the scores from our gRNA-target model as features (Supplemental Figure 6). This then empirically shows that gene essentiality is not adversely affecting our conclusions using the viability data. Hence these viabilty-based experiments serve as bronze standard for the combined task of scoring and aggregation.
Using the viability data we found that Elevation-aggregation was the best summary score model, yielding up to an 8-fold improvement (and was never worse) in Spearman correlation over the best approach for this end-point task, CFD aggregation. Elevation-aggregation yielded an even larger improvement over crispr.mit.edu2, the most widely-used but now no longer supported gRNA design tool (Figure 5). The importance of each aggregation feature is shown in Figure 6.
Figure 5. Joint scoring and aggregation on viability screens.
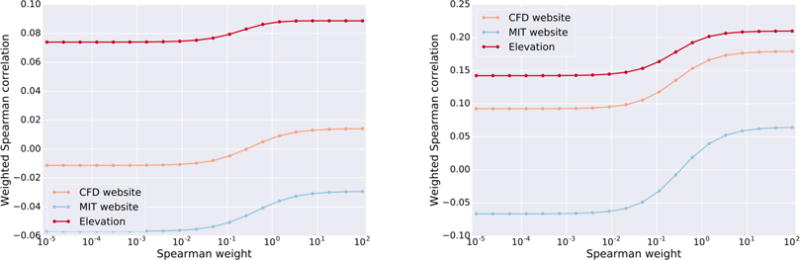
Weighted spearman correlation of Elevation to the crispr.mit.edu server. (a) Avana data (N=4,950) was used to train and Gecko to test (N=4,697), (b) the reverse of a. Note that the MIT website often yields correlation in the wrong direction. The final Elevation model deployed in our cloud service uses the model trained on Avana.
Figure 6. Aggregator feature importances.
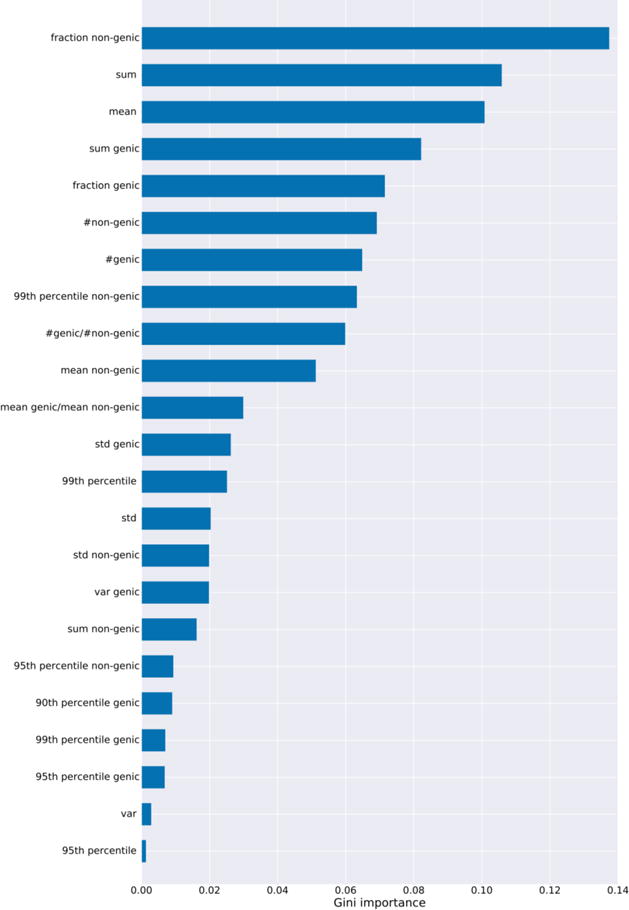
Weights from aggregator model in Elevation which uses Gradient Boosted regression trees. The features were: the mean; median, variance (var), standard deviation (std), 99th, 95th, 90th percentiles, and sum of the Elevation gRNA-target scores for each gRNA. We compute these for each of: all off-targets (no postfix), only genic off-targets (“genic”), and only non-genic targets (“non-genic”), where is-genic is obtained from ENSEMBL.37 Additionally, we compute these further features: fraction of targets that are genic; fraction that are non-genic; ratio of number of genic to non-genic targets; ratio of mean genic to non-genic score. The Gini importance is described in Methods.
Predicting with chromatin accessibility
Several studies have suggested that chromatin accessibility may play a role in the activity of CRISPR/Cas9.19,35,36 To investigate the impact of this feature on off-target activity, we were restricted to use of the Gecko viability data which was performed in 33 cell types, of which three (K562, PANC1, T47D) had matching chromatin accessibility data (DNase I). The other data we had access to were performed in cell types which did not have chromatin accessibility data. Therefore, we augmented our aggregation model to include DNase I features, independently for each of the three Gecko cell types. We included these DNase I features in several ways with the aggregation model (Supplementary Figure 5, Methods). We found an increase in performance in PANC1 for just one of the four models that included DNase I information. In the other two cell types, two different models including DNase I increased prediction over DNase I-agnostic models, but only over half the evaluation regime. Moreover, the same type of DNase I model was never consistently best. Next we used the averaged DNase I data across all 95 available cell types instead of using cell-type-specific DNase I data. We found that this cell-type averaged DNase I information did not increase the model performance in any of the cell types. Because so few of our data sets have matching chromatin data available at this time, and because of the inconclusive results, we decided to forgo including this information in our final deployed model for the time being. Users interested in augmenting our model with DNase I can use our source code to retrain such models, although we believe it would be better to include it into Elevation-score rather than Elevation-aggregate even though we were not able to do so here.
Conclusion
We have introduced the first machine-learning based approach to predictive modelling of off-target effects for CRISPR-Cas9. Through systematic investigation we demonstrated that our newly developed suite of models, Elevation, performs better for each of the two main off-target-related tasks in gRNA design: gRNA-target scoring and aggregation. Additionally, we are the first to systematically evaluate available competing approaches on the task of summary scoring (aggregation), showing that Elevation consistently outperformed competing approaches by a substantial margin. We also considered how to balance errors between active and inactive gRNAs, developing a new metric to do so, based on the weighted Spearman correlation. This type of evaluation encapsulates a range of practical use cases, and enabled us to show that Elevation is consistently superior across the entire range. We recommend that the community should use such metrics in the future when comparing new and existing models for off-target modelling.
As data become available for a richer set of scenarios, including different endonucleases, different organisms and in vitro versus in vivo, epigenetics on more cell types, we will update our models and tools accordingly.
Elevation-score and Elevation-aggregate, which we together we call Elevation, complement our on-target predictive model, Azimuth.1 Together, Azimuth and Elevation, along with our cloud service and web front end, provide an integrated end-to-end guide design tool that enables users to more effectively deploy CRISPR-Cas9 for research screening experiments and that may provide a useful pre-screening tool for identifying potential gRNAs for therapeutic applications—one based on the state-of-the-art machine-learning based methods. In future work we will also more carefully investigate the issue of search and filter.
Methods
Data
To train our first-layer, single-mismatch model, we used CD33 data from Doench et al.1 where all single-mismatch mutations (between the intended target and the potential off-target, thus including alternate PAMs) were introduced into the target DNA for 65 perfect-match gRNAs that were effective at knockout. CD33-negative cells were isolated by flow cytometry so that their log-fold-change prior to CRISPR-Cas9 introduction could be measured by sequencing. After filtering as in Doench et al., we retained 3,826 single-mismatch observations and 1,027 alternate PAM observations for a total of 4,853 gRNA-target training examples of which 2,273 were considered active by Doench et al. These data measure protein knockout efficiency rather than DNA cleavage. We refer to these data as the CD33 data.
To evaluate our second-layer, multiple mismatch model, we used two unbiased/genome-wide multiple mismatch data sets. The first were GUIDE-Seq data3 comprising nine gRNAs assessed for off-target cleavage activity. These gRNAs yielded 354 active off-target sites (i.e., non-zero counts) with up to six mismatches. Non-active sites were obtained from Doench et al. who used Cas-OFFinder14 to identify all 294,534 sites with six or fewer mismatches. The second data comprised off-target data aggregated by Haeussler et al.15, after removing GUIDE-Seq data to make it independent from the previously mentioned data set. These data consisted of 52 active targets among 10,129 non-active potential targets. We set the minimum resulting value to 0.001, the estimated sensitivity of the assay.15 Finally, for both the GUIDE-Seq and Haeussler et al. measured activity, we linearly re-scaled them to lie in [0,1] before applying a Box-Cox transform.38
For our validation of the gRNA-target model (trained on the CD33 and GUIDE-Seq data) we applied the model to two previously unseen data sets assayed with GUIDE-Seq: i) five gRNAs yielding a total of 103,040 potential off-targets of which 53 are active, from ref.31, and (ii) 22 unique gRNAs in a newly-generated data set, yielding a total of 381,249 potential off-targets of which 57 are active (see Supplementary Table 1). The list of potential off-target sites was obtained using dsNickFury as described below. The gRNAs in the newly generated data set were chosen in a manner that was unbiased with respect to favoring any of the predictive models. In particular, we used each of CFD, HsuZhang, CCTOP and Elevation-score to make off-target predictions for gRNAs in the Gecko library32 (which were not used for any of the gRNA-target scoring), excluding any gRNAs which yielded non-viable cells (i.e., assay read-out of less than −1.0). We then converted the predictions within each method to ranks so as to make the predictions comparable in scale across methods, and then averaged the ranks across methods obtaining one estimated activity for each gRNA which was model-agnostic. This yielded an ordering of gRNAs from expected most to least active (an ordering that was not biased to any one method). From that list, we then chose 10 consecutive gRNAs each starting at the top 10%, 20%, and 30% of overall activity. For the 20% set, one gRNA had two perfectly matched sites in the genome so we instead used the next gRNA on the list. Only gRNAs assayed with wild type Cas9 were used from ref. 31; these gRNAs had been selected without any predictive modelling of off-target effects, and hence were unbiased with respect to the methods being compared herein. In particular, G-N19-NGG sites in a few of the commonly assays genomic amplicons/genes had been selected.3,39
To evaluate the aggregation of off-target effects we used two data sets arising from gRNAs targeting non-essential genes in a viability screen. The first, from the Avana library1, used 4,950 gRNAs targeting 880 non-essential genes. The second, from the Gecko library32, used 4,697 gRNAs targeting 837 non-essential genes). Other than for the DNase I experiments we used cell type A375 from Gecko.
DNase I peak file data for 95 human cell types, measuring chromatin accessibility, was downloaded from http://genome.ucsc.edu/cgi-bin/hgTables?hgsid=581299277_DBUyFx88KdBssISoFyqBLBdKNq2M&clade=mammal&org=Human&db=hg38&hgta_group=regulation&hgta_track=wgEncodeRegDnase&hgta_table=0&hgta_regionType=genome&position=chr9%3A133252000-133280861&hgta_outputType=primaryTable&hgta_outFileName=on March 22nd, 2017.
GUIDE-seq
U2OS cells (ATCC) were cultured at 37°C with 5% CO2 in Advanced DMEM supplemented with 10% heat-inactivated fetal bovine serum, 2 mM GlutaMax, and penicillin/streptomycin (all cell culture reagents from Thermo Fisher Scientific). Cell line identity was validated by STR profiling (ATCC) and routine mycoplasma testing was negative for contamination. GUIDE-seq experiments were performed with 22 unique sgRNAs (and the EMX1 site 1 sgRNA as a control) essentially as previously described.3 Briefly, roughly 2×10⁵ human U2OS cells were transfected (SE kit and DN-100 program on a 4D nucleofector; Lonza) with 750 ng nuclease plasmid, 250 ng of gRNA RNA plasmid, and 100 pmol of an end-protected double-stranded oligo (dsODN) GUIDE-seq tag. Approximately 72 hours following nucleofection, genomic DNA was extracted via Agencourt DNAdvance Genomic DNA Isolation (Beckman Coulter). Gene disruption and GUIDE-seq tag-integration efficiencies were evaluated using T7E1 and RFLP assays, respectively, as previously described.31 GUIDE-seq sample libraries (prepared as previously described3) were sequenced on an Illumina MiSeq sequencer, and data was analyzed using an updated version 1.1 of the open-source guide-seq software.40 All data related to GUIDE-seq experiments can be found in Supplementary Table 1. New GUIDE-seq data generated for this study has been deposited with the NCBI Sequence Read Archive (SRA) under accession number SRP117146.
Predictive Modelling for Scoring Individual gRNA-Target Pairs
Here we describe the CFD model1, what assumptions it makes, and then describe our model, Elevation-score, and how it relates conceptually to CFD. The predictive off-target model, CFD, first computes the observed frequency of gRNA-target pair activity for each single-mismatch type in the CD33 data. CFD then combines these single-mismatch frequencies by multiplying them together for gRNA-target pairs with multiple mismatches. For example, if a gRNA-target pair had a A:G mismatch in position 3, a T:C mismatch in position 5 and a PAM of “CG” in the target region, then CFD would take the off-target score of this gRNA to be CFD score = P(active|A: G,3)× P(active|T: C,5)×P(active|CG), where each of the these terms is computed from observed frequencies in the CD33 training data (which contained only single-mismatch, or alternate PAMs, but never both).
CFD as Naïve Bayes
One can interpret the CFD algorithm in terms of a known classification model called Naïve Bayes41 as follows. First, denote Y = 1 to mean a gRNA-target pair was active, and Y = 0 to denote that the pair was not. Next, denote features such as T:C,5 as Xi, where i simply indexes some enumeration of these features (i.e., a one-hot encoding). If that feature (mismatch) occurred, then Xi = 1, and if it did not occur then Xi = 0. Therefore, in the CD33 data (with only single mismatches), a particular gRNA-target pair has only one Xi = 1 and all others have Xi = 0. In this notation one can re-write CFD as follows for one gRNA-target pair:
In contrast, a Naïve Bayes model would compute the probability that a gRNA-target pair is active given the feature values as
which makes only one assumption, namely, that conditioned on a gRNA being active, the features Xi are independent so that P({Xj}|Y = 1) = ∏i P(Xi|Y = 1). Using Bayes’ rule, one can re-write the Naïve Bayes classifier as
If we make two further assumptions, we find that Naïve Bayes classifier exactly matches CFD. The first assumption is that the features are marginally independent, namely that ∏i p(Xi) = p({Xj}), in which case Naïve Bayes simplifies to
The CFD assumption of marginal feature independence seems reasonable and yielded good results. Consequently, we make the same assumption in our Elevation-score model. If we additionally assume that P(Y = 1|Xi = 0) = 1, then CFD and Naïve Bayes become identical. This second CFD assumption (P(Y = 1|Xi = 0) = 1) seems a more difficult one to accept, but with some careful thought (and the fact that CFD performs so well), also seems reasonable as we explain next; hence also make this assumption. The key insight is to ask which properties of the training data one expects to generalize to unseen data sets where the model might be applied. In particular, it seems reasonable to assume that P(Y = 1|Xi = 1) is a quantity that will generalize to other data sets; intuitively the quantity reflects how likely a gRNA is to be active given that we observed a particular kind of mismatch—as such, it is independent of the distribution of the types of mismatch in the training versus test data sets. In contrast, P(Y = 1|Xi = 0) defines how likely a gRNA is to be active given that we did not observe a feature. When computing this quantity, one marginalizes (averages) over all examples in the CD33 data set where Xi = 0, which includes all gRNA-target pairs for which Xj≠i = 1; as such, this probability specifically depends on the distribution of mismatch types in the off-target data set, and their corresponding activities. Therefore, we don’t necessarily expect these quantities, P(Y = 1|Xi = 0) to generalize from our training data (CD33-specific) to general test sets. Now the question remains, how can we therefore make a reasonable approximation? One could try to posit a canonical theoretical or actual data set which will best generalize; however, it is extremely difficult to come up with such a set. Furthermore, in light of how we are going to use our Naïve Bayes probabilities (described next), getting it exactly right is not critical. Hence we make the CFD assumption that P(Y = 1|Xi = 0) = 1.
We have now shown that with two assumptions, the CFD model can be interpreted as a Naïve Bayes classifier. The reason for making this connection is not only to put the CFD in a proper probabilistic framework, including its assumptions, but more importantly, to then generalize this model so as to improve its performance, which we now do in describing our Elevation-score model.
Elevation-score as two-layer stacked regression
We generalized away from CFD in three main ways: (i) we moved from classification to regression, (ii) we augmented the feature space, and (iii) we replace the a priori manner of combining by multiplication to combining using machine learning. We call the model implementing only the first two, Elevation-naïve (Supplementary Figure 1), while we refer to the model resulting from all three as Elevation-score, or final model class. We now explain these in more details.
The first observation in generalizing away from CFD is that it is a classification algorithm, which means it discards the real-valued assay measurements, converting them to be binary active/in-active. Thus, by design CFD is unable to capture the more nuanced information available in the data. In moving from classification to regression, the model has access to more fine-grained information. Although not widely used, there exist generalizations of Naïve Bayes classification to regression42; however, due to the specifics of our problem, they are not convenient to apply. Thus we developed our own approach in which we first convert the CD33 log-fold-change (LFC) values to lie in the range [0,1] so that they can, loosely speaking, be interpreted as probabilities. To do so, we used a kernel density estimator to transform each LFC to the cumulative density of that LFC in the kernel density estimate. We used a Gaussian kernel and choose the bandwidth by 10-fold cross-validation (yielding 0.23).
Recall that Elevation-score is a two-layer stacked regression model where the first layer makes predictions for gRNA-target pairs with only a single mismatch, while the second layer combines these for gRNA-target pairs with multiple mismatches.
To learn each first-layer (single-mismatch) regression model, p(y|{Xj}), we used boosted regression trees (using default settings in scikit-learn) on the CD33 data.43 Since each gRNA-target pair has only a single Xi = 1 in these data, we could just have well used a linear regression model. However, we wanted to include a richer featurization of the gRNA-target pair than just features of the form A:G, 5, resulting in the fact that even for single mismatch data, more than one Xi = 1 could occur (also some features were numeric rather than 0/1). Further, we wanted these features to be able to interact in a non-linear manner. Thus in addition to the CFD features, we also used “decoupled” versions of them—one of the form “A:G”, which was one-hot encoded (described at the end of this section) and the other an integer feature for the position (e.g., 5). We also included whether the mutation was a transversion or a transition. We call the model which uses these improvements and combines each mismatch just as CFD does, by multiplying the values together, Elevation-naïve. As can be seen in Supplementary Figure 1, moving from classification to regression improved the performance of the off-target model, as did augmenting the features. Next we describe how we improve Elevation-naïve to obtain Elevation-score.
Although Elevation-naive improved upon CFD, there were several aspects of the modelling approach which suggested areas for further improvement. The first was that the Naïve Bayes assumption of class-conditional independence may not be fully justified. The second is that our regression model’s predicted values are not calibrated probabilities of gRNA-target activity; hence when we combine them under that assumption (as does Naïve Bayes and CFD), we may suffer in performance. Thus it stands to reason that if we could somehow loosen these assumptions, we might achieve better performance still. One way to do this is to augment the model, here with a second layer, and then to use the limited amount of multiple-mismatch/PAM gRNA-target pair data to learn the newly added parameters. We refer to this second layer of Elevation-score as the combiner because it learns how to combine the predictions from the single-mismatch model in a more nuanced way than simply multiplying them together like Elevation-naïve and CFD, thereby, allowing some of the stated assumptions to be mitigated. Thus where a CFD/Naïve Bayes approach would simply multiply single-mismatch probabilities together, we instead use a data-driven machine learning approach to fine-tune how they should be combined. In particular, we first use our first-layer boosted regression trees model J times to make predictions for each of the J single mismatches (i.e., J features for which Xj = 1), yielding J predictions (one for each feature with Xj = 1, and setting for the remaining K features that have Xk = 0). Therefore, each gRNA-target pair has T = J + K = 21 boosted regression tree predictions (20 for each possible mismatch position, and one for an alternate PAM). The log of these 21 features , along with their sum, their product, and J —the number of mismatches/alternate PAM—are then the input to an L1-regularized linear regression combiner model—the second-layer model. We used each of the GUIDE-Seq data and the Hauessler et al. data to train a model, each time testing on the other data set and using 10-fold cross-validation to set the L1 penalty. Note that Elevation-score’s two-layer model is inherently different from both a two-layer neural network44 and from stacked generalization45 because the data used to train each Elevation-score layer are different (single- vs. multi-mismatch). Also note that owing to the tiny proportion of non-zero values in these data (e.g., 0.5%), we subsampled the zero activity examples to match the number of non-zero values within each data set, only for training.
Finally, because what we ultimately want are predictions of the probability that a gRNA-target pair is active, we also apply one final transformation to the output from the L1-regression model namely, we put them through our calibration model. This model estimates p(active|GUIDE-seq normalized counts) using a logistic-regression model trained on predictions for the CD33 data using Elevation-naive as inputs (this model makes prediction in GUIDE-seq normalized count space) and using the corresponding CD33 binarized observed activities1 (LFC>1) as the target variable. Note that this transformation is monotonic and as such only affects performance of aggregation, not gRNA-target scoring, given that we use a Spearman rank correlation. For the aggregation task, the Spearman correlation is computed only after aggregation of scores for a gRNA, thus any change in scale of the pre-aggregated scores, even if monotonic (such as our calibration model performs) can dramatically influence the quality of the final aggregation. In other words, even a simple linear transformation could change the aggregation scores.
One-hot encoding of categorical variables
A “one-hot” encoding refers to taking a single categorical variable and converting it to more variables each of which can take on the value 0 or 1, with at most one of them being “hot”, or on. For example, with a categorical nucleotide feature which can take on values A/C/T/G, each letter would get converted into a vector of length four, with only one entry equal to on, corresponding to one of the four letters.
Elevation-aggregate
Elevation-score provides only the starting ingredients for choosing a gRNA with least expected off-target activity. To actually rank gRNAs, one needs to coalesce the scores from all gRNA-target pairs for a given gRNA into a single number so that gRNAs can be ranked by this number for off-target activity. Thus we developed Elevation-aggregate, a model based on gradient boosted regression trees, to perform this task. Hyper-parameter settings were chosen by cross-validation using a random search over these parameters and ranges: losses ∈ {least squares; least absolute deviation; Huber}, learning rates ∈ [1e−6, 1] equally-spaced with 100 points, # estimators ∈ [20,50,80,100,200,300,400,500], max depth from 1 to 7, min. # samples to split = [2, 3, 4], splitting criterion ∈ [Friedman mean squared error, mean squared error, mean absolute error]. We evaluated 10 randomly chosen samples from these sets. For Figure 5 and Supplemental Figure 1, we performed 5-fold cross-validation on the training data to select the best model before using it to measure performance on the test set. For the DNase I experiments we were only able to use Gecko data owing to cell-type compatibility and so had to evaluate Gecko itself using cross-validation. Thus, in this setting, we used 20-fold cross-validation to evaluate a model (e.g. dnase1), where within each fold, we performed an inner 5-fold cross-validation to select the best hyper-parameter setting. The input features for the model were computed from the distribution of gRNA-target Elevation-score predictions and comprised: the mean, median, variance, standard deviation, 99th, 95th, 90th percentiles, and sum of off-target scores. We compute these for each of: all off-targets, only genic off-targets, and only non-genic off-targets. Additionally, we compute these further features: sum of genic [non-genic] off-targets divided by total number of off-targets; fraction of targets that are genic; fraction that are non-genic; ratio of number of genic to non-genic targets; ratio of average genic to non-genic score. The final deployed model was trained only on the Avana data, since combining it with Gecko did not increase cross-validation performance.
Incorporation of chromatin accessibility features
To incorporate DNase I peak data into the aggregation model (the only model for which we had training data with corresponding DNase I data), we tried four different approaches: (i) using the DNase I as a “mask” on the values output from the gRNA-target scorer (i.e., taking the element-wise product between the original features and their corresponding DNase I peak values), (ii) adding to our original features, statistics of the DNase I features (same summary statistics as with our original features, but computed only on the DNase I features) as independent features, (iii) using our original aggregation features in addition to those newly added features in i, and (iv) using our original aggregation features in addition to those newly added features in i and ii. The track files used in this experiment were downloaded from UCSC. We acknowledge the ENCODE Consortium46, the UW Encode group for generating these data, and UCSC for processing these data and making them available for download. The data’s GEO accession numbers are GSM736629 and GSM736566 for K562; GSM736517 and GSM736519 for PANC-1; and GSM1024761 and GSM1024762 for T-47D.
Comparison to other approaches
We compared models using the Spearman correlation between predicted and measured off-target activity. Furthermore, as discussed in the main text, we additionally evaluated the weighted-Spearman correlation for various weight settings in order to account for an asymmetrical loss with respect to false-positive-active errors as compared to false-negative-active errors. Specifically, we set the weights as follows. Let {gi} be the values of the normalized GUIDE-Seq or Hauessler data (all lying in [0, 1]). Then we set the weight for each data point to be (such that wi ∈ [0,1]) where v is varied through 10−5 to 100 and is denoted on the horizontal axis of the relevant figures. When v = 10−5, the weights are effectively equal to the GUIDE-Seq/Hauessler measured values (this is the left-hand side of our plots). When v = 100 (right-hand side of our plots), the weights become effectively identical for all gRNAs, yielding a standard Spearman correlation. For each v, we assessed the effective sample size (the sum of the weights) and only considered weights producing effective sample sizes equal to or above 50 so as to remove high-variance estimates which could be misleading.
For implementation of CFD we used Supplementary Table 19 from ref.1. For CCTOP we re-implemented based on the description in their paper. For Hsu-Zhang gRNA-target pair scoring we re-implemented the approach based on the equation in their paper.
To compare Elevation to the aggregation scores of the MIT web server, each gRNA sequence was submitted to the MIT CRISPR Design Tool using their RESTful API provided for single sequences (http://crispr.mit.edu/). Every sequence was queried using sequence type “other region (23-500nt)” and target genome “human (hg19)” to obtain an off-target score. The server failed to produce scores for the following three sequences which we therefore removed from consideration in our comparison: sequence TGACCTGTGACCATGATCACCACAGGGTTG from Avana and sequences CAAGCCTGTGTGCTGCAAGCCTGTCTGCTCTGTGCC and TCTCTGGCCATCATTTCCTGGGAGAGATGGATGGTG from Gecko. All queries were submitted and their results processed between the dates of August 15th-29th 2016, inclusive. No software version number was found in the output or web page.
To compare Elevation to the CFD server (http://portals.broadinstitute.org/gpp/public/analysis-tools/sgrna-design), each gene corresponding to an Avana or Gecko gRNA was submitted to between September 21st-23rd 2016, inclusive, and the relevant gRNA rows retrieved. A score for a gRNA was obtained by adding the values in the two fields “Tier I Match Bin I Matches” and Tier I Match Bin II Matches” as done by Doench et al.1 Although the server returns a field off-target rank, this field cannot be readily compared across gRNAs as it is within-gene only.
Elevation-search
To perform efficient genomic searches for potential off-targets we developed the program dsNickFury which uses seed and extension47 (using two tandem seeds) to find near-match CRISPR-Cas9 targets. In brief, dsNickFury can leverage distributed computing to efficiently catalog every potential CRISPR-Cas9 target in a genome for any CRISPR-Cas9 system with targets that can be abstracted into some maximum length of RNA gRNA followed by a set of potential PAM sequences of fixed length. These potential targets are then organized into a tree data structure based upon two tandem seed sequences (lengths of 8 and 6 nucleotides were used as the first and second seeds here, respectively, but this is a user-specified parameter that affects performance and not results) taken from the gRNA sequences immediately proximal to the PAM site. The first branch layer of the tree structure is comprised of all observed first tandem seeds (most proximal to the PAM) while the second layer contains branches for each second tandem seed. Each first and second seed combination links to a file containing all of the potential CRISPR-Cas9 targets in the genome that have that specific combination of tandem seeds proximal to the PAM site.
Potential off-target matches are defined by a maximum number of mismatches relative to the intended target (set by the user) with a certain number of bases distal to the PAM being ignored if desired. Here, mismatch tolerance was set to 3, with the 3 most distal bases from the PAM being ignored. All PAMs deemed to have non-zero activity in ref. 1 are considered (NAG, NCG, NGA, NGC, NGG, NGT, NTG). This strategy was based upon previous observations that much CRISPR-Cas9 off-target activity risk is determined by the number of mismatches between on- and off-target sequences with bases more distal to the PAM sequence being more mismatch tolerant and contributing less to specificity.3 Potential sites are searched initially based upon their tandem seeds, using a depth-first search of the cached tree structure. Any leaves with fewer mismatches than the maximum allowed have the same check then applied to their extended sequences, ignoring bases distal to the PAM as determined by user-specified parameter. Those sequences that pass the filters are considered as potential off-targets and are scored by Elevation. These sites can be sorted based on their mismatch counts and/or Elevation score and in general can be reported directly to the user by way of a file or by deposition in to a NoSQL database as we have done here. We additionally use the Ensembl database to determine if each off-target is in an annotated gene or not, such that users can obtain an aggregated off-target score across one, the other, or both.
Because most sites can be disqualified based upon their seeds without loading the extended sequence and have already been annotated by both sequence and locus, searches can be conducted using significantly fewer resources than an alignment-based search. This allows for many searches to be conducted in parallel on a distributed computing environment. For results reported herein we pre-computed and stored all human genome-wide results for both on- and off-target predicted activities in a cloud-based database which we make available to the community.
Our system is designed to function on several different CRISPR-Cas9 systems with PAM sites at the 3’ end of the target. Parameters may be set for different lengths of gRNA sequence, PAM sequences with higher activity, and species of origin for the reference genome. Potential targets can be ranked for on-target efficiency and off-target risk. The system is currently using Azimuth for on-target activity prediction, and Elevation for off-target activity prediction for the S. pyogenes CRISPR-Cas9 system.
A summary of the search parameters used for all experiments in this paper as well as the on-line cloud service are as follows: we included all off-targets in the genome with no more than 3 mismatches in the 4-20 of the gRNA, with any number of mismatches in the first three gRNA nucleotides, and considering any PAM deemed to have non-zero probability according to the CFD model (namely, NAG, NCG, NGA, NGC, NGG, NGT, NTG).1 We stopped any searches that yielded more than 40,000 potential off-targets according to these criteria. For those yielding more than 40,000, we set our Elevation gRNA potential (i.e., the final gRNA aggregate value) to be equal to 1,000.
Gini importance as feature importance in regression trees
The Gini importance refers to the decrease in mean-squared error (the criterion used to train each regression tree) when that feature is introduced as a node in the tree. This measure has a close, empirical correspondence with the importance of the feature that would be obtained with a permutation test, and can also be viewed as a relative decrease in entropy provided by splitting on that feature. This measure of importance does not convey whether having that feature makes a gRNA better or worse in the model because such a notion is impossible for regression trees in which the effect of one feature is dependent on the presence/absence of other features (i.e., there are non-linear interactions between the features).
Model interpretability
Our primary goal in this paper was to provide a state-of-the-art tool that the community could use, alongside evidence of it outperforming alternative tools. While any biological insights that can be derived from such analyses is extremely interesting, we would like to caution that the more powerful (and hence complex) a model is, the less interpretable it is. That is not to say that people do not try to assign interpretations to complex models, but these interpretations are by definition not ideal summaries, and should not be over-interpreted. To give some intuition into why, consider first a linear regression model. In a linear regression model, each “feature” (e.g. in our context might be “A in position 2”) contributes to a final regression prediction in a linear, additive manner. Thus, it is fairly trivial to assign some importance to each feature independently. In contrast, with a more complex model which allows for interactions, the importance of each feature depends entirely on what the value for the other features are, and cannot easily be interpreted on its own. Additionally, because of this complexity, it is often the case that a near infinity of models, each with slight perturbations in effective ranking of features, all achieve the same predictive performance. Thus, although we have provided these feature rankings, we have not focused too much on them, because we do not want to encourage their over-interpretation.
Web portal
We pre-computed all on- and off-target scores for the human exome (GRCh38) and made them available at https://crispr.ml. The on-target scores were computed using Azimuth1, with higher scores indicating higher predicted activity for a given guide. Aggregated off-target values were computed using Elevation-aggregation, with higher values indicating less predicted off-target activity. To further drill down in the specific off-targets for a given guide, we also list all of the individual gRNA-off-target scores (i.e., not aggregated), computed using Elevation-score. Again, higher scores indicate less predicted off-target activity (on the website, we invert the scores as described in the paper to achieve this).
Code Availability
All source code and a front-end website for the cloud service will be made available from http://research.microsoft.com/en-us/projects/crispr upon publication.
Supplementary Material
Acknowledgments
We thank Akshaya Annavajhala for Azure cloud support, Carl Kadie for use of his HPC cluster code, Jim Jernigan, Oleg Losinets and the HPC team for cluster support, Mudra Hegde for help with data, Jose Lopez and Martin Aryee for assistance with GUIDE-seq data analysis, Maximilian Haeussler for help accessing data from his paper and Jean-Paul Concordet for feedback on the manuscript. Michael Weinstein is supported by a UCLA Collaboratory Fellowship. This work used computational and storage services associated with the Hoffman2 Shared Cluster provided by UCLA Institute for Digital Research and Education’s Research Technology Group, and made use of an Azure-for-Research grant to UCLA. We thank the UW ENCODE group for their publicly available data.
Footnotes
Author Contributions
JL and NF designed, implemented and evaluated the machine learning and statistical methods (Elevation-score and Elevation-aggregate). MW designed, implemented the Elevation-search infrastructure, also known as dsNickFury. JD provided biological expertise. BPK, JKJ, JL, NF and JD selected validation gRNAs. BPK, AS and JKJ assayed the validation gRNAs for off-target activity. JL, NF, MW, JD designed the web interface. LH and KG created the front end webpage for the cloud service. ME and JC helped run experiments and populated the cloud server. JL, MW, JD, NF, BPK and JKJ wrote the paper.
Competing Financial Interests
JL, LH, ME, JC, NF performed research related to this manuscript while employed by Microsoft. J.K.J. has financial interests in Beacon Genomics, Beam Therapeutics, Editas Medicine, Pairwise Plants, Poseida Therapeutics, and Transposagen Biopharmaceuticals. J.K.J.’s interests were reviewed and are managed by Massachusetts General Hospital and Partners HealthCare in accordance with their conflict of interest policies.
References
- 1.Doench JG, et al. Optimized sgRNA design to maximize activity and minimize off-target effects of CRISPR-Cas9. Nat Biotechnol. 2016:1–12. doi: 10.1038/nbt.3437. [DOI] [PMC free article] [PubMed] [Google Scholar]
- 2.Hsu PD, et al. DNA targeting specificity of RNA-guided Cas9 nucleases. Nat Biotechnol. 2013;31:827–32. doi: 10.1038/nbt.2647. [DOI] [PMC free article] [PubMed] [Google Scholar]
- 3.Tsai SQ, et al. GUIDE-seq enables genome-wide profiling of off-target cleavage by CRISPR-Cas nucleases. Nat Biotechnol. 2015;33:187–197. doi: 10.1038/nbt.3117. [DOI] [PMC free article] [PubMed] [Google Scholar]
- 4.Frock RL, et al. Genome-wide detection of DNA double-stranded breaks induced by engineered nucleases. Nat Biotechnol. 2015;33:179–86. doi: 10.1038/nbt.3101. [DOI] [PMC free article] [PubMed] [Google Scholar]
- 5.Wang X, et al. Unbiased detection of off-target cleavage by CRISPR-Cas9 and TALENs using integrase-defective lentiviral vectors. Nat Biotechnol. 2015;33:175–8. doi: 10.1038/nbt.3127. [DOI] [PubMed] [Google Scholar]
- 6.Kim D, et al. Digenome-seq: genome-wide profiling of CRISPR-Cas9 off-target effects in human cells. Nat Methods. 2015;12:237–43. doi: 10.1038/nmeth.3284. 1 p following 243. [DOI] [PubMed] [Google Scholar]
- 7.Kim D, Kim S, Kim S, Park J, Kim JS. Genome-wide target specificities of CRISPR-Cas9 nucleases revealed by multiplex Digenome-seq. Genome Res. 2016;26:406–15. doi: 10.1101/gr.199588.115. [DOI] [PMC free article] [PubMed] [Google Scholar]
- 8.Tsai SQ, et al. CIRCLE-seq: a highly sensitive in vitro screen for genome-wide CRISPR-Cas9 nuclease off-targets. Nat Methods. 2017;14:607–614. doi: 10.1038/nmeth.4278. [DOI] [PMC free article] [PubMed] [Google Scholar]
- 9.Cameron P, et al. Mapping the genomic landscape of CRISPR–Cas9 cleavage. Nat Methods. 2017;14:600–606. doi: 10.1038/nmeth.4284. [DOI] [PubMed] [Google Scholar]
- 10.Ran FA, et al. In vivo genome editing using Staphylococcus aureus Cas9. Nature. 2015;520:186–191. doi: 10.1038/nature14299. [DOI] [PMC free article] [PubMed] [Google Scholar]
- 11.Yan WX, et al. BLISS is a versatile and quantitative method for genome-wide profiling of DNA double-strand breaks. Nat Commun. 2017;8:15058. doi: 10.1038/ncomms15058. [DOI] [PMC free article] [PubMed] [Google Scholar]
- 12.Crosetto N, et al. Nucleotide-resolution DNA double-strand break mapping by next-generation sequencing. Nat Methods. 2013;10:361–365. doi: 10.1038/nmeth.2408. [DOI] [PMC free article] [PubMed] [Google Scholar]
- 13.Stemmer M, Thumberger T, del Sol Keyer M, Wittbrodt J, Mateo JL. CCTop: An Intuitive, Flexible and Reliable CRISPR/Cas9 Target Prediction Tool. PLoS One. 2015;10:e0124633. doi: 10.1371/journal.pone.0124633. [DOI] [PMC free article] [PubMed] [Google Scholar]
- 14.Bae S, Park J, Kim JS. Cas-OFFinder: A fast and versatile algorithm that searches for potential off-target sites of Cas9 RNA-guided endonucleases. Bioinformatics. 2014;30:1473–1475. doi: 10.1093/bioinformatics/btu048. [DOI] [PMC free article] [PubMed] [Google Scholar]
- 15.Haeussler M, et al. Evaluation of off-target and on-target scoring algorithms and integration into the guide RNA selection tool CRISPOR. Genome Biol. 2016;17:148. doi: 10.1186/s13059-016-1012-2. [DOI] [PMC free article] [PubMed] [Google Scholar]
- 16.Labun K, Montague TG, Gagnon JA, Thyme SB, Valen E. CHOPCHOP v2: a web tool for the next generation of CRISPR genome engineering. Nucleic Acids Res. 2016 doi: 10.1093/nar/gkw398. gkw398. [DOI] [PMC free article] [PubMed] [Google Scholar]
- 17.Heigwer F, Kerr G, Boutros M. E-CRISP: fast CRISPR target site identification. Nat Methods. 2014;11:122–123. doi: 10.1038/nmeth.2812. [DOI] [PubMed] [Google Scholar]
- 18.Ma J, et al. CRISPR-DO for genome-wide CRISPR design and optimization. Bioinformatics. 2016;32:3336–3338. doi: 10.1093/bioinformatics/btw476. [DOI] [PMC free article] [PubMed] [Google Scholar]
- 19.Singh R, Kuscu C, Quinlan A, Qi Y, Adli M. Cas9-chromatin binding information enables more accurate CRISPR off-target prediction. Nucleic Acids Res. 2015;43:e118. doi: 10.1093/nar/gkv575. [DOI] [PMC free article] [PubMed] [Google Scholar]
- 20.Cradick TJ, Qiu P, Lee CM, Fine EJ, Bao G. COSMID: A Web-based Tool for Identifying and Validating CRISPR/Cas Off-target Sites. Mol Ther - Nucleic Acids. 2014;3:e214. doi: 10.1038/mtna.2014.64. [DOI] [PMC free article] [PubMed] [Google Scholar]
- 21.Hsu PD, et al. DNA targeting specificity of RNA-guided Cas9 nucleases. Nat Biotechnol. 2013;31:827–32. doi: 10.1038/nbt.2647. [DOI] [PMC free article] [PubMed] [Google Scholar]
- 22.Kim D, et al. Genome-wide analysis reveals specificities of Cpf1 endonucleases in human cells. Nat Biotechnol. 2016;34:863–8. doi: 10.1038/nbt.3609. [DOI] [PubMed] [Google Scholar]
- 23.Kleinstiver BP, et al. Genome-wide specificities of CRISPR-Cas Cpf1 nucleases in human cells. Nat Biotechnol. 2016;34:869–74. doi: 10.1038/nbt.3620. [DOI] [PMC free article] [PubMed] [Google Scholar]
- 24.Lin Y, et al. CRISPR/Cas9 systems have off-target activity with insertions or deletions between target DNA and guide RNA sequences. Nucleic Acids Res. 2014;42:7473–7485. doi: 10.1093/nar/gku402. [DOI] [PMC free article] [PubMed] [Google Scholar]
- 25.Xu H, et al. Sequence determinants of improved CRISPR sgRNA design. Genome Res. 2015 doi: 10.1101/gr.191452.115. [DOI] [PMC free article] [PubMed] [Google Scholar]
- 26.Chari R, Mali P, Moosburner M, Church GM. Unraveling CRISPR-Cas9 genome engineering parameters via a library-on-library approach. Nat Methods. 2015;12:823–6. doi: 10.1038/nmeth.3473. [DOI] [PMC free article] [PubMed] [Google Scholar]
- 27.Doench JG, et al. Rational design of highly active sgRNAs for CRISPR-Cas9-mediated gene inactivation. Nat Biotechnol. 2014 doi: 10.1038/nbt.3026. [DOI] [PMC free article] [PubMed] [Google Scholar]
- 28.Wang T, Wei JJ, Sabatini DM, Lander ES. Genetic screens in human cells using the CRISPR-Cas9 system. Science. 2014;343:80–4. doi: 10.1126/science.1246981. [DOI] [PMC free article] [PubMed] [Google Scholar]
- 29.Moreno-Mateos MA, et al. CRISPRscan: designing highly efficient sgRNAs for CRISPR-Cas9 targeting in vivo. Nat Methods. 2015;12:982–8. doi: 10.1038/nmeth.3543. [DOI] [PMC free article] [PubMed] [Google Scholar]
- 30.Housden BE, et al. Identification of potential drug targets for tuberous sclerosis complex by synthetic screens combining CRISPR-based knockouts with RNAi. Sci Signal. 2015;8:rs9. doi: 10.1126/scisignal.aab3729. [DOI] [PMC free article] [PubMed] [Google Scholar]
- 31.Kleinstiver BP, et al. High-fidelity CRISPR–Cas9 nucleases with no detectable genome-wide off-target effects. Nature. 2016;529:490–495. doi: 10.1038/nature16526. [DOI] [PMC free article] [PubMed] [Google Scholar]
- 32.Aguirre AJ, et al. Genomic Copy Number Dictates a Gene-Independent Cell Response to CRISPR/Cas9 Targeting. Cancer Discov. 2016;6:914–929. doi: 10.1158/2159-8290.CD-16-0154. [DOI] [PMC free article] [PubMed] [Google Scholar]
- 33.Munoz DM, et al. CRISPR Screens Provide a Comprehensive Assessment of Cancer Vulnerabilities but Generate False-Positive Hits for Highly Amplified Genomic Regions. Cancer Discov. 2016;6:900–913. doi: 10.1158/2159-8290.CD-16-0178. [DOI] [PubMed] [Google Scholar]
- 34.Morgens DW, et al. Genome-scale measurement of off-target activity using Cas9 toxicity in high-throughput screens. Nat Commun. 2017 doi: 10.1038/ncomms15178. [DOI] [PMC free article] [PubMed] [Google Scholar]
- 35.Lee CM, Davis TH, Bao G. Examination of CRISPR/Cas9 design tools and the effect of target site accessibility on Cas9 activity. Exp Physiol. 2017 doi: 10.1113/EP086043. [DOI] [PMC free article] [PubMed] [Google Scholar]
- 36.Horlbeck MA, et al. Nucleosomes impede cas9 access to DNA in vivo and in vitro. Elife. 2016 doi: 10.7554/eLife.12677. [DOI] [PMC free article] [PubMed] [Google Scholar]
- 37.Yates A, et al. Ensembl 2016. Nucleic Acids Res. 2016;44:D710–D716. doi: 10.1093/nar/gkv1157. [DOI] [PMC free article] [PubMed] [Google Scholar]
- 38.Box GEP, C DR. An analysis of transformations. Journal of the Royal Statistical Society Series B (Methodological [Google Scholar]
- 39.Reyon D, et al. FLASH assembly of TALENs for high-throughput genome editing. Nat Biotechnol. 2012 doi: 10.1038/nbt.2170. [DOI] [PMC free article] [PubMed] [Google Scholar]
- 40.Tsai SQ, Topkar VV, Joung JK, Aryee MJ. Open-source guideseq software for analysis of GUIDE-seq data. Nat Biotechnol. 2016;34:483. doi: 10.1038/nbt.3534. [DOI] [PubMed] [Google Scholar]
- 41.Russell SJ, Norvig P. Artificial Intelligence - A Modern Approach (3 internat ed) 2010 [Google Scholar]
- 42.Frank E, Trigg L, Holmes G, Witten IH. Naive Bayes for Regression. Mach Learn. 2000;41:5–25. [Google Scholar]
- 43.Freund Y, Schapire RE. Proceedings of the Second European Conference on Computational Learning Theory 23-37. Springer-Verlag; 1995. A Decision-theoretic Generalization of On-line Learning and an Application to Boosting. [Google Scholar]
- 44.Bishop M. Pattern recognition and Machine Learning ~ [Google Scholar]
- 45.Wolpert DH. Stacked generalization. Neural Networks. 1992;5:241–259. [Google Scholar]
- 46.Hoffman MM, et al. Integrative annotation of chromatin elements from ENCODE data. Nucleic Acids Res. 2013;41:827–41. doi: 10.1093/nar/gks1284. [DOI] [PMC free article] [PubMed] [Google Scholar]
- 47.Baeza-Yates RA, Perleberg CH. Fast and practical approximate string matching. Inf Process Lett. 1996;59:21–27. [Google Scholar]
Associated Data
This section collects any data citations, data availability statements, or supplementary materials included in this article.