Abstract
Blood contains a poorly characterized pool of labile iron called non-transferrin-bound iron (NTBI). In patients with iron-overload diseases such as hemochromatosis, NTBI accumulates in the liver, heart, and other organs. This material is probably nonproteinaceous and low molecular mass (LMM). However, the number, concentration, mass, and chemical composition of NTBI remain unknown despite decades of effort. Here, solutions of plasma from humans, pigs, horses, and mice were passed through a 10 kDa cutoff membrane, affording flow-through solutions (FTSs) containing ~ 1 μM iron. FTSs were subjected to size-exclusion liquid chromatography at pH 8.5, 6.5, and 4.5. Iron was detected by an online inductively-coupled-plasma mass spectrometer. LC-ICP-MS chromatograms of FTSs exhibited 2–6 iron-containing species with apparent masses between 400–2500 Da. Approximate concentrations in plasma were 10−8–10−7 M. Not every FTS sample contained every LMM iron species, indicating individual variations. The most reproducible iron species had apparent masses of 400 and 500 Da. Chromatograms of FTSs from established hemochromatosis patients exhibited no significant differences relative to controls. Peak positions and intensities depended on column pH. Some FTS iron adsorbed onto the column, especially at higher pH. Column-absorbing-iron coordinated apo-transferrin whereas the more tightly coordinated iron species did not. Ferric citrate standards exhibited LMM iron peaks that were similar to but not the same as those obtained in FTSs. The results indicate that the LMM iron species in healthy blood plasma is not primarily ferric citrate; however, this may be one of many contributing complexes.
Introduction
Ferrous ions enter the body via enterocytes lining the duodenum,1–4 and they pass into the blood through the membrane-bound protein ferroportin.5,6 Multicopper oxidases hephaestin and/or ceruloplasmin oxidize FeII ions in the blood,7 and the resulting FeIII species bind metal-free transferrin (abbreviated apo-Tf). Transferrin is an 80 kDa glycoprotein present in the blood at concentrations of 25–50 μM.8 Iron-bound transferrin (called holo-Tf) distributes iron to other cells in the body by binding receptors on cellular surfaces followed by import into the cell by endocytosis.
Blood plasma contains other iron-containing proteins besides transferrin; these include ferritin, haptoglobin, albumin, and hemopexin. Ferritin is a 450 kDa complex with a hollow core that binds ferric oxyhydroxide nanoparticles. Most ferritins are located within cells and function to store iron. The physiological role of extracellular blood-borne ferritins is less well defined but expression and loading levels are correlated to disease.9,10 Haptoglobin and hemopexin diminish stress caused by hemolysis.11 Haptoglobin coordinates free hemoglobin to generate a 150 kDa haptoglobin:hemoglobin complex that is absorbed by the liver.12–15 Hemopexin (63 kDa) binds free heme in the blood as a detoxification mechanism.16 With a concentration of ca. 600 μM, albumin (67 kDa) is the most prevalent protein in the blood; it coordinates iron weakly.17–20
Plasma iron is highly dynamic and turns-over every few hours.1 The generation and utilization of plasma iron during erythrocyte recycling dominates plasma iron dynamics. In healthy individuals, nutrient iron import represents a minor perturbation of this process.1 Nutrient iron import is regulated by hepcidin.21 This peptide hormone is produced by the liver under high-iron conditions. Hepcidin binds ferroportin which promotes degradation of this membrane-bound iron exporter. This blocks nutrient iron import into the blood. Individuals with the iron-overload disease hereditary hemochromatosis generate insufficient hepcidin such that excessive nutrient iron flows into the blood.22
Tf also serves as an iron buffer in the blood. In healthy individuals, only ca. 30% is holo-Tf. The remaining apo-Tf provides a receptacle for nutrient iron as the iron enters the blood after a meal. Once all apo-Tf is saturated, further iron enters the blood as a poorly characterized toxic complex (or group of complexes) called non-transferrin-bound iron, abbreviated NTBI.22–26 The name NTBI is confusing because the iron bound to ferritin, albumin, haptoglobin, and hemopexin is, in one sense, NTBI. However, in this paper, we will use the term more restrictively as particular LMM (defined as ≤ 10 kDa) iron complexes found in plasma and sera.
NTBI is not composed of all LMM iron complexes in the blood but only those that are absorbed by the liver rapidly and quantitatively.27,28 NTBI is imported by Zip14 zinc receptors on the plasma membrane of hepatocytes.29 Livers of untreated hemochromatosis patients accumulate massive amounts of NTBI-derived iron which can lead to cirrhosis. NTBI is absorbed by the heart and other organs.27,30,31 Iron loading into the heart is less extreme than into the liver, but more damaging. This is why heart disease is the leading cause of death in hemochromatosis.32 These are the particular LMM iron complexes in the blood that we define as NTBI. Sadly, the chemical identity of this damaging material is unknown.
The concentration of NTBI is reportedly low or even undetectable in healthy individuals. This is probably because NTBI binds apo-Tf tightly and/or because NTBI is absorbed near-quantitatively by the liver. The concentration of NTBI in the plasma of healthy mammals ranges from 0.1–1.5 μM. In contrast, the NTBI concentration in the plasma of HFE(−/−) mice and hemochromatosis humans ranges from 3.7–10 μM.18,23,25,31,33,34 (Mutations in the HFE gene are the most common cause of hereditary hemochromatosis.)
NTBI is commonly defined operationally as the iron in blood plasma that can be chelated under established assay conditions. One problem with such assays is that they destroy NTBI during detection, making it impossible to identify the material. Also, different assays using different chelators or reaction conditions generate different results.33 Stronger chelators may remove iron from sites that are not truly NTBI such as those on proteins. For example, ultrafiltrates in which all proteins have been removed from sera of β-thalassemia (another iron-overload disease) patients contain 0.5 μM iron.19 However, when NTA, a common chelator for NTBI assays, is added before ultrafiltration (i.e. to solutions containing holo-Tf and other iron-containing proteins) the resulting ultrafiltrates contain 5 μM iron. NTA probably removes iron bound to proteins in sera. The additional 4.5 μM iron that coordinates to NTA in sera is probably not NTBI according to our definition but it generally is counted as such by these assays. Due to the ambiguities caused by defining NTBI operationally, little is known regarding the number of NTBI species, their concentrations, or other chemical properties.
Although the chemical composition of NTBI is unknown, ferric citrate leads the list of NTBI candidates, so much so that the two names are used synonymously. Citrate is present in blood plasma at concentrations of ca. 100 μM,19,35,36 and equilibrium calculations indicate that ferric citrate complexes are quite stable under these conditions.36–38 Complicating the analysis is the formation of different complexes of citrate and ferric ions depending on the iron:citrate ratio and pH. A 1:100 ratio (the approximate physiological ratio found in plasma) favors dimers (though not exclusively), a 1:10 ratio favors oligomers, and a 1:10,000 ratio favors monomers.19,38 Hepatocytes and T lymphocytes import oligomeric ferric citrate species faster than other iron-citrate species39 suggesting that they possess a specific carrier for importing oligomeric ferric citrate. Other cell types also import ferric citrate, in these cases using DMT1 and ZIP14 carriers.26,40,41,42
The objective of this study was to detect and speciate LMM iron-containing species in flow-through solutions (FLSs) from mammalian plasma, and then evaluate whether any detected species might be the long-sought-after NTBI. To do this, we employed a liquid chromatography system located in a refrigerated anaerobic glove box interfaced with an online inductively coupled plasma mass spectrometer. We have used this LC-ICP-MS system previously to detect LMM iron complexes in mitochondria43 and brain.44
LC-based studies aimed at detecting NTBI have been carried out previously. Simpson et al. passed mouse serum through a Sephadex G200 column and detected iron in a chromatography peak associated with masses < 10 kDa.45 However, they did not resolve the peak into individual molecular species. Hider et al. employed LC-ICP-MS to evaluate iron in sera.20 In the high molecular mass (HMM) region, they detected iron-bound ferritin and Tf. (Iron-bound albumin was also detected when standards were run.) The LMM region exhibited a weak iron peak but they were also unable to resolve it into its molecular components. Grootveld et al.46 used HPLC to detect LMM peaks in plasma from hemochromatosis patients and controls, but again they did not resolve the observed peak into molecular components. Our group has also used LC-ICP-MS to investigate iron in mouse plasma,47 but in that study we focused on proteins in the HMM region, not on the LMM region where low-intensity unresolved features were observed.
Here we resolve LMM iron-containing species in plasma and sera by employing a size-exclusion LC column designed for LMM peptides. We also employed other strategies (like performing the LC in a refrigerated anaerobic glove box and rigorously cleaning the columns) to improve reproducibility and minimize artifacts. That being said, LMM iron complexes are notoriously difficult to isolate, characterize, and identify because ligand dissociation/re-association rates can be very rapid (this is why such complexes are labile and susceptible to chelation). Iron complexes are particularly difficult to study because they are also redox active, and FeIII vs. FeII ions coordinate ligands with different affinities. Moreover, aqueous FeIII ions are highly insoluble and tend to aggregate, albeit at kinetically slow rates. Finally, the concentration of LMM iron in blood is very low, and these species would be undetectable without the extreme sensitivity of ICP-MS. Fortunately, we were able to negotiate through these difficulties and obtain new insights into the nature of NTBI in blood plasma and sera.
Experimental Procedures
Standards
Ferric citrate standards were prepared by method C as described,19 except that the iron standard was not purchased commercially. Rather, an FeCl3 stock was generated by dissolving FeCl3 hexahydrate (Sigma Aldrich) in high purity water (HPW; defined as water that has been deionized, filtered (>18 MΩ-cm), and distilled). To this solution was added concentrated trace-metal-grade concentrated nitric acid (Fisher-Sci, abb. TMGNA), achieving a final concentration of 1.14 mM iron and 2% (v/v) acid.
A 100 mM stock citric acid solution was prepared from citric acid (Sigma Aldrich) in HPW, with pH unadjusted. The citrate stock and HPW contained insignificant concentrations (ca. 30 nM) of contaminating iron.
Ferric citrate standards were prepared by mixing different volumes of the iron and citrate stock solutions in 100 mM MOPS pH 7.4 and HPW to achieve final iron concentrations of either 1 μM (for standards) or 50 μM (for spiking experiments). Iron:citrate molar ratios ranged from 1:10 to 1:100. The final MOPS concentration was 20 mM. Solutions were prepared fresh and then typically aged in the dark for 24 hrs (though some were aged for 30 min) in the glovebox before use.
Standards used for LMM calibration curve included: Blue Dextran (Sigma, 2 MDa, 0.1 mg mL−1); Ni-BPS (1531 Da, 200 μM) made from nickel sulfate hexahydrate (Sigma) and bathophenanthrolinedisulfonic acid (Acros Organic); AMP (Acros Organic, 347 Da, 200 μM), ATP (Sigma, 507 Da, 200 μM); cyanocobalamin (Fisher, 1,355 Da, 50 μM); bovine insulin (Fisher, 5,777 Da, 50 μM); and cytochrome c (equine heart, Sigma, 12,384 Da, 20 μM). Standards used for high molecular mass calibration curve included: carbonic anhydrase (bovine erythrocyte, Sigma, 29 kDa, 100 μM); human haptoglobin (Milipore, 200 kDa, 12.5 μM); ferritin (equine spleen, Sigma, 400 kDa, 50 μM); apo-transferrin (human, Athens Research & Technology, 80 kDa, 12.5 μM); and cytochrome c (Acros Organic, 200 μM). Solutions of all LMM standards were prepared in HPW. All HMM standards were prepared in 20 mM MOPS pH 7.4, 100 mM NaCl using HPW. All concentrations indicated are final.
Blood Acquisition and Fractionation
Experiments involving human blood were approved by the IRB administration committee at Texas A&M University (IRB-2017-0020). Experiments involving nonhuman mammals were similarly approved by the Animal Use Protocol committee (IACUC 2015-0034). Blood for plasma was collected using a 6 mL lithium heparin BD Vacutainer blood collection tube. Blood for sera was collected using either a 10 mL glass BD Vacutainer tube or a 1 L polyethylene centrifuge bottle. Plasma blood samples were kept on ice for 15 min–2 hr until processing and serum blood was set on ice for 30 min and then left to coagulate for 35 min at room temperature until processing. Serum was prepared by incubating blood samples on ice for 15 min to 2 hr and then incubating samples at RT for 5 min. Plasma/sera samples were then fractionated by centrifugation (Sorval Evolution RC centrifuge). Samples were spun using a GSA or SLC-6000 rotor with custom-built plastic inserts, each of which held 2 vacutainer tubes, at 2,000 RCF and 4°C for 10 min. Spun vacutainers were carefully transferred to a chilled (8°C) anaerobic (< 5 ppm O2) glove box (Mbraun Labmaster 120). Samples were transferred to 2.5 mL Eppendorf tubes, removed from the glove box, and either used immediately (fresh) or frozen with liquid N2 and stored at −80°C.
Pig blood was collected from healthy female Yorkshire pigs. Horse blood was collected from healthy horses. Mouse blood was pooled from 3–5 mice. Human blood was collected by staff at the Gulf Coast Regional Blood Centers in College Station TX and Conroe TX. Human blood was processed without freezing within 1–2 hr post-collection.
Plasma and Serum Processing
Some fresh or frozen-and-thawed plasma or serum samples were filtered through new 0.45 μm cellulose acetate syringe tip filters (VWR) to generate what we will refer to as high-molecular-mass (HMM) samples. Other samples were filtered using a pressurized (75 psi Ar) Amicon stir-cell concentrator (Model 8003) fitted with a 10 kDa regenerated cellulose membrane (YM-10, Millipore). The solution that flowed through the membrane will be referred to as flow-through solution (FTS). Membranes were conditioned by soaking them overnight. Two mL of HPW were passed through the membrane in the assembled filtration system prior to applying the sample. The Amicon filtration step took ca. 2 hr. The initial flow-through liquid (about half of the total volume collected) was discarded. The retained half was collected in 2.5 mL The Amicon system was cleaned by soaking all components except the base, the head, and the membrane in 10% bleach for 10 min followed by analytical rinsing with tap water and HPW after each use. The Amicon sample output tube was rinsed with 10% TMGNA for 20 min and rinsed with HPW after each use.
Experimental Protocols per figure
Figures 1 and 2
Figure 1.
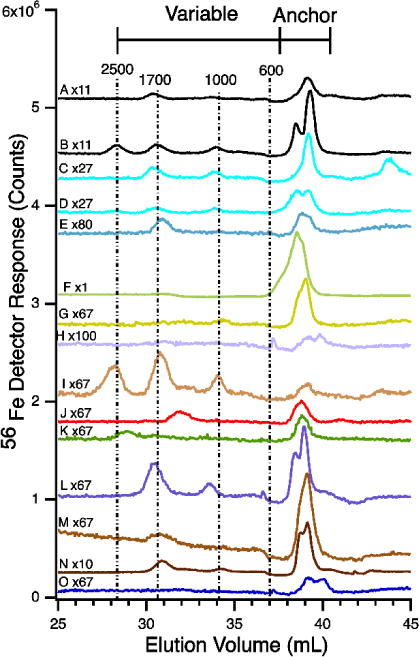
56Fe-detected chromatograms of flow-through solutions of A, Pig 1, before feeding; B, Pig 1, after feeding; C, Pig 2 before feeding; D, Pig 2 after feeding; E, Horse 1; F, Horse 2; G, Mouse 1; H, Horse 3; I, Mouse 2; J, Human hemochromatosis patient 1; K, Human hemochromatosis patient 2; L, Human hemochromatosis patient 3; M, Human hemochromatosis patient 4; N, Human Control 1 after eating a steak; O, Human Control 1 after fasting 24 hrs. The mobile phase of the column was 20 mM ammonium bicarbonate pH 8.5. Human samples were run fresh; others were frozen and rethawed. Intensities were multiplied by various factors relative to trace F, as indicated. The same color indicates the same sample.
Figure 2.
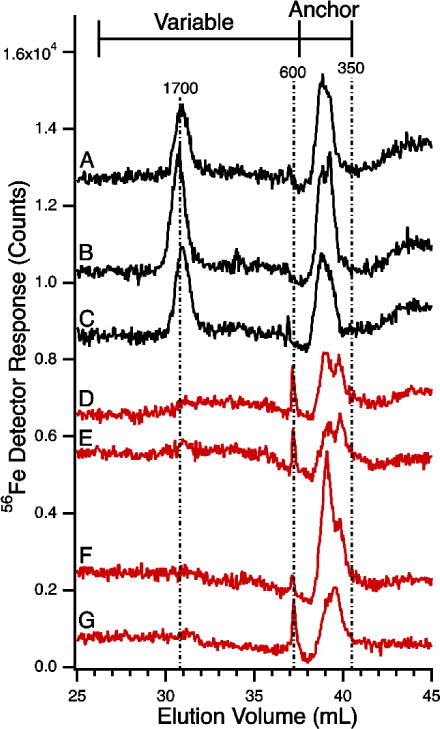
Stability of LMM iron species in plasma and serum. 56Fe-detected LC-ICP-MS chromatograms of flow-through solutions from horse plasma and serum were run using conditions of Figure 1. Black lines are Horse 1, red lines are Horse 2. A, fresh plasma; B, frozen plasma; C, frozen serum; D, fresh plasma; E, frozen plasma; F, same as E but after incubating in a refrigerated glove box for 1 day and then refiltering through the 10 kDa cutoff membrane. G, same as F but after incubating for 9 days. Column conditions as in Figure 1.
Plasma or sera FTSs (300 μL) were injected onto the Superdex peptide column using 20 mM ammonium bicarbonate pH 8.5 mobile phase.
Figure 3
Figure 3.
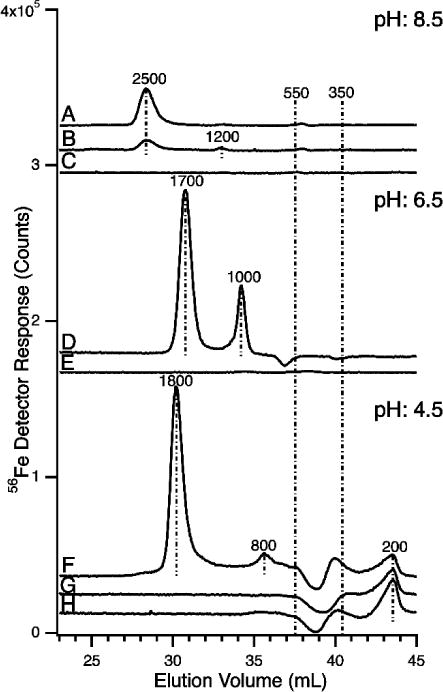
LC-ICP-MS traces of ferric citrate standards chromatographed at pH 8.5 (A–C), 6.5 (D–E), and 4.5 (F–G). A, D, and F were prepared using 1 μM FeCl3, 1:100 iron:citrate ratio, and aged for 24 hr; B, same as A except aged 30 min; C, E, and H, 100 μM citric acid in 20 mM MOPS pH 7.4 with no iron added; G, 1 μM FeCl3 with no citrate added. Each injection was 300 μL.
Ferric citrate solution and controls (300 μL) were injected and run under different mobile phases. The ferric citrate solution contained 1 μM iron with an iron:citrate molar ratio of 1:100. Controls of 100 μM citric acid in 20 mM MOPS pH 7.4 and 1 μM FeCl3 in 20 mM MOPS pH 7.4 were also run. Mobile phases used were: 20 mM ammonium bicarbonate pH 8.5, 20 mM ammonium acetate pH 6.5, and 20 mM sodium acetate pH 4.5.
Figure 4
Figure 4.
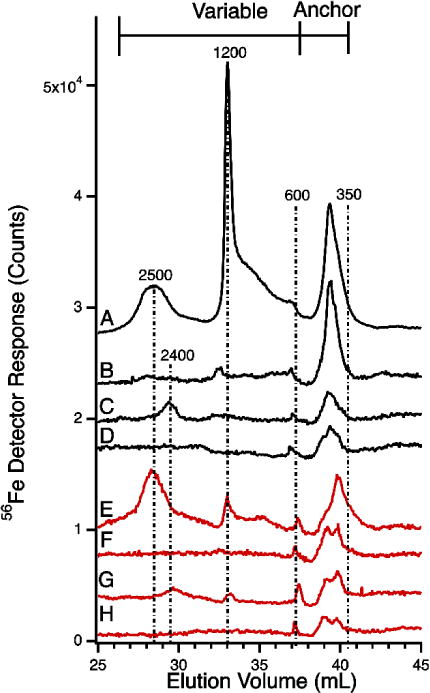
56Fe-detected chromatograms of flow-through solutions of pig serum (black) and horse plasma (red) before and after spiking. A, after spiking with 4 μM FeCl3 (24 hr incubation); B, after spiking with 1 μM FeCl3 (7 hr incubation); C, after spiking with 1 μM FeIII citrate (1:100, 30 min incubation); D, before spiking; E, after spiking with 4 μM FeCl3 (24 hr incubation); F, after spiking with 1 μM FeCl3 (7 hr incubation); G, after spiking with 1 μM FeIII citrate (1:100, 24 hr incubation); H, before spiking. Column conditions as in Figure 1.
The ferric citrate standard used for the spike contained 50 μM iron, 5 mM citrate, and 1.25 M MOPS at pH 7.4. Seven μL of this solution was added to 343 μL of FTS. The spiked solution was incubated in the dark for either 30 min or 24 hrs before injection onto the column (same column conditions as in Figure 1). The FeCl3 solution used for the spike contained 50 μM FeCl3 and was prepared in 2% acid. A solution of 100 mM MOPS pH 7.4 was also prepared. To 350 μL of FTS was added 40 μL (or 10 μL) of the FeCl3 stock and 120 μL (or 30 μL) of the MOPS solution. The final solution of 510 μL (or 390 μL) contained 3.9 μM (or 1.3 μM) FeCl3 and 23.5 mM (or 7.7mM) MOPS. The spiked FTS was incubated in the dark for 24 hr, and then injected onto the column as in Figure 1.
Figure 5
Figure 5.
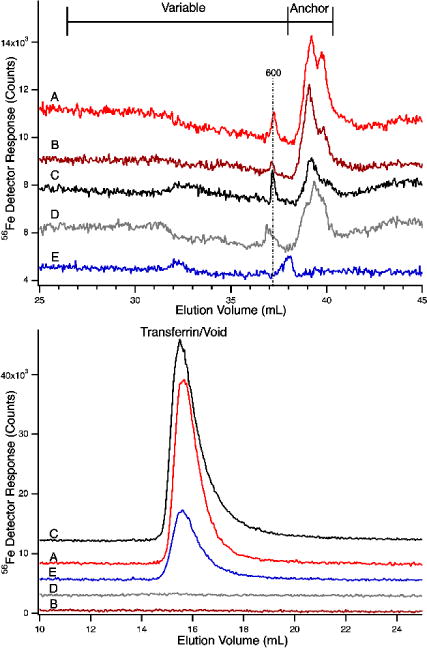
56Fe-detected chromatograms of flow-through solutions from horse plasma (red) or pig serum (black) before and after spiking with 4 μM apo-Tf. Upper panel, the LMM region; lower panel, HMM region (the void volume was at ca. 14 mL). A, FTS spiked with apo-Tf; B, FTS before spike; C, FTS spiked with apo-Tf; D, FTS before spike; E, apo-Tf alone (blue). Column conditions were as in Figure 1. Color coding on the top panel matches that on the bottom panel.
A 50 μM apo-transferrin solution was prepared in 20 mM MOPS pH 7.4, and 100 mM NaCl. To 460 μL of FTS was added 40 μL of the apo-transferrin solution, and the resulting solution (containing 4 μM transferrin) was incubated 30 min in the glove box and injected onto the column as described in Figure 1.
Figure 6
Figure 6.
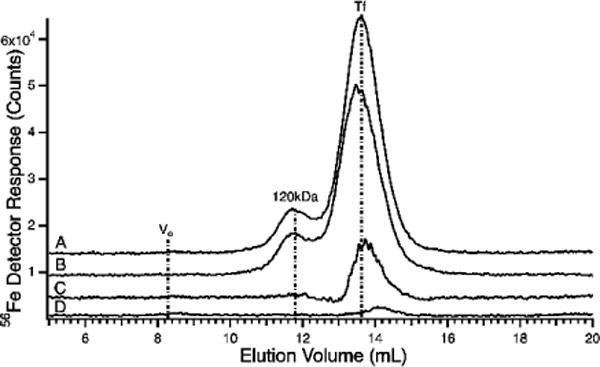
56Fe-detected chromatograms of pig serum flow-through solutions spiked with 4 μM apo-Tf using the HMM column using 20 mM ammonium bicarbonate pH 8.5 mobile phase. A, pig serum FTS spiked with apo-Tf; B, 4 μM apo-Tf alone; C, difference between traces A and B; D, pig serum FTS alone.
FTS spikes were prepared as in Figure 5. 150 μL of spiked FTS were injected onto the Superdex 200 column in which the mobile phase was 20 mM ammonium bicarbonate pH 8.5.
Figure 7
Figure 7.
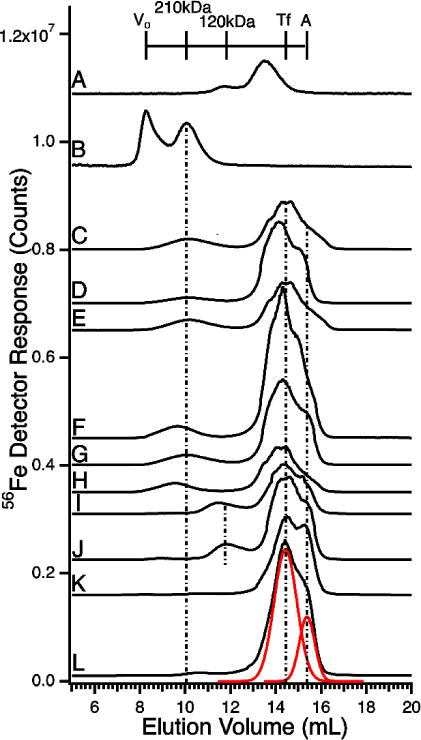
LC-ICP-MS(56Fe) Chromatograms of plasma from humans, horses, and mice. A, transferrin standard; B, ferritin standard; C, Human Control (steak); D, Human Control (fasting); E, hemochromatosis patient 1; F, hemochromatosis patient 2; G, hemochromatosis patient 3; H, hemochromatosis patient 4; I) Horse 1; J, Horse 2; K, Mouse 1; L, Mouse 2. An offset artifact near the top of some peaks, due to switching detector sensitivity, was electronically removed. The transferrin standard in A eluted slightly earlier than transferrin in other samples due to matrix effects of the plasma. Red lines in L are simulations of Tf and albumin peaks. Column conditions were as in Figure 6.
Plasma solutions were treated as in Figure 6.
Figure 8
Figure 8.
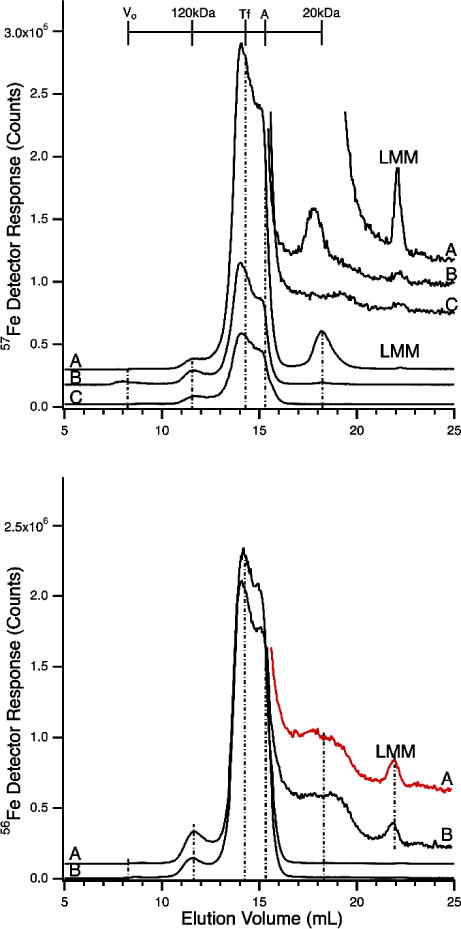
LC-ICP-MS(56Fe, 57Fe) chromatograms of horse plasma (and serum) before and after spiking with 57FeIII citrate and 57FeCl3. Top panel, 57Fe detection: A, plasma spiked with 4 μM 57FeIII citrate (1:100 ratio); B, plasma spiked with 4 μM 57FeCl3 C, plasma before spike. Dilution factors due to spiking were applied to traces A (1.1) and B (1.7) such that intensities of all traces can be compared. Samples were incubated in the glovebox for 30 min after spiking. Expected elution volumes for ferritin (Vo), the haptoglobin:hemoglobin complex, transferrin, albumin, an unassigned 20 kDa iron-containing protein and LMM complexes are indicated. Inset show details of the LMM region. Bottom panel, 56Fe detection: A, plasma before spike; B, serum before spike. Column conditions were as in Figure 6.
Serum and some plasma samples were injected directly onto the Superdex 200 column (as in Figure 6). Other plasma samples were spiked with either 4 μM (final concentration) 57FeIIICl3 or 57FeIII citrate. 57Fe oxide powder (Isoflex USA) was treated with a minimal volume of aqua regia to dissolve the powder. Once dissolved, the solution was diluted with HPW to a final concentration of 80 mM making an 57FeCl3 acid stock. To this acid stock a 3 molar excess of sodium citrate (Sigma-Aldrich) was added until a pH of 5 was reached and then diluted to volume with HPW. For the 57FeIIICl3 spike, a 40 μM 57FeCl3 solution was prepared by serial dilution of a 40 mM 57FeCl3 acidified stock (diluted from an 80 mM acid stock with HPW) using 50 mM MOPS pH 7.4. To a 315 μL plasma solution was added 35 μL of the 57FeCl3 stock (affording a 4 μM ferric chloride spike). The resulting 350 μL sample was injected onto the column after 30 min incubation time. For the 57FeIII citrate spike, a 40 μM 57FeIII citrate (iron:citrate 1:3 molar ratio) solution was prepared by diluting a 40 mM 57Fe citrate pH 4.5 solution using 50 mM MOPS pH 7.4. To 315 uL of plasma solution was added 35 uL of the resulting 57Fe citrate solution, affording a 4 μM ferric citrate spike. The resulting 350 μL sample was injected onto the column after a 30 min incubation time. Plasma solutions were injected as in Figure 6.
Figure 9
Figure 9.
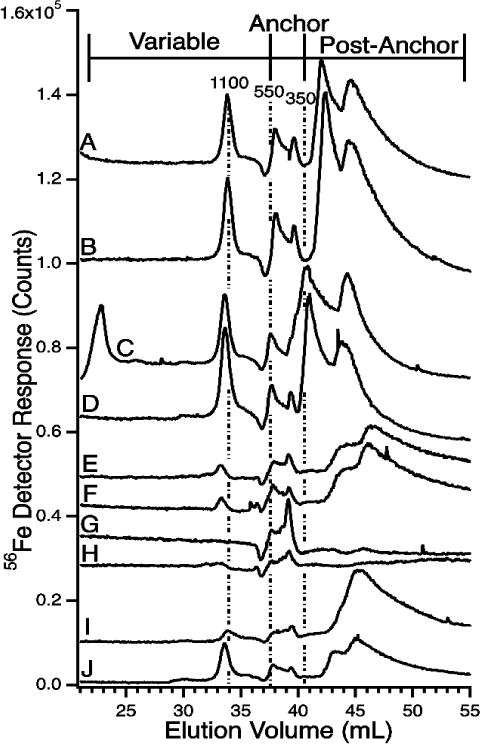
LC-ICP-MS(56Fe) Chromatograms of flow-through solutions using the LMM column and 20 mM ammonium acetate pH 6.5 mobile phase. The same samples were used to generate traces in Figure 1. All sample were frozen and thawed unless indicated otherwise. Trace labels are as follows A, Horse 1 (fresh); B, Horse 1; C, Horse 2; D, Horse 3; E, Human control 1 (fasting); F, Human control 1 (steak); G, Human hemochromatosis patient 1; H, Human hemochromatosis patient 2; I, Human hemochromatosis patient 3; J, Human hemochromatosis patient 4. The minor negative detector response at 37 mL is an artifact associated with low pH mobile phase.
FTSs were treated as in Figure 1, but with a mobile phase of 20 mM ammonium acetate pH 6.5.
Figure 10
Figure 10.
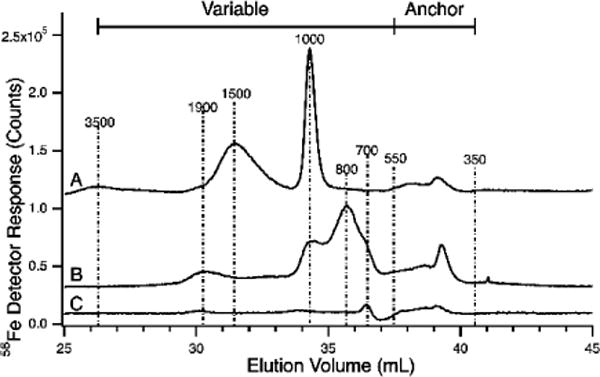
LC-ICP-MS(56Fe) Chromatograms of pig serum flow-through solutions in which the mobile phase was 20 mM ammonium acetate pH 6.5. A, after ferric citrate spike (4 μM, 1:100 ratio; B, after FeCl3 spike (4 μM); C, before spikes. The minor negative detector response at 37 mL is an artifact associated with low pH mobile phase.
FeCl3 spikes were performed similar to that of Figure 4, namely by adding 40 μL of a 40 μM FeCl3 solution to the FTS. Ferric citrate spikes were performed as in Figure 4, except that 28 μL of a 50 μM ferric citrate standard was added to 322 μL of FTS. The resulting 250 μL solution was incubated for 24 hr and then injected onto the column prepared as in Figure 3.
Figure 11
Figure 11.
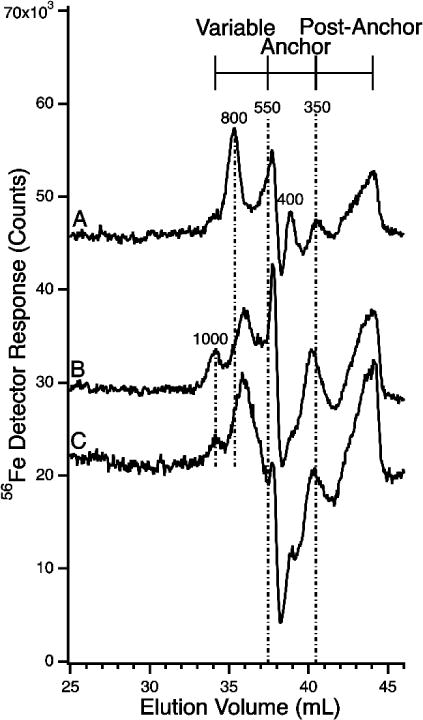
LC-ICP-MS(56Fe) Chromatograms of horse flow-through solutions using the LMM column with 25 mM MOPS pH 4.5 mobile phase. All sample were frozen and thawed. A, Horse 1; B, Horse 2; C, Horse 3.
FTSs were treated as in Figure 1, but with a mobile phase of 20 mM sodium acetate pH 4.5.
Figure 13
Figure 13.
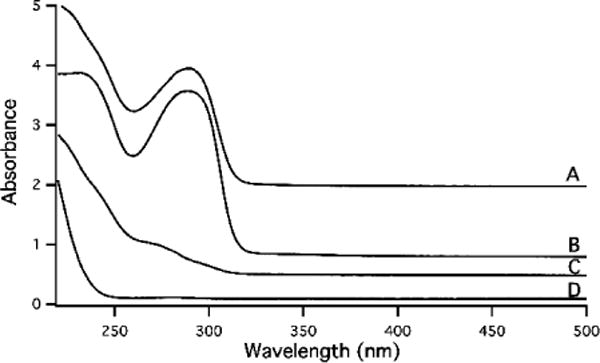
Electronic Absorption Spectra of plasma flow-through solution and ferric citrate standard at 1:100 iron to citrate ratio. A, Human hemochromatosis patient 4; B, Human control (fasting); C, Horse 6, D, ferric citrate solution, prepared using 1 μM FeCl3 and 100 μM citric acid in 20 mM MOPS pH 7.4 Samples were aged 24 hr prior to collecting the spectrum. Pathlength of the quartz cuvette was 4 mm; plotted absorbance values have been normalized to that which would have been observed using a 1 cm pathlength. Spectra were offset for visualization.
Human hemochromatosis FTS and a 1 μM ferric citrate solution (iron:citrate 1:100; prepared fresh, incubated 24 hrs) were separately transferred into in a 4 mm pathlength quartz cuvette. Spectra were collected on a Hitachi U-3310 spectrophotometer with a Headon PMT using UV Solutions 2.2 software. Spectra were collected with a wavelength range of 191–800 nm using a 2 mm slit width, 300 nm min−1 scan speed, and a 0.5 nm sampling interval. The lamp change mode was 340 nm.
Size-Exclusion Chromatography Analysis
An Agilent 1260 Bioinert quaternary pump (G5611A) HPLC system with manual injector (G5628A), fraction collector (G5664A), and UV-VIS diode array (G4212B) were kept in an 8°C chilled, N2-atmosphere glove box. Liquid chromatography parameters were as follows: either 20 mM ammonium bicarbonate (Sigma-Aldrich) pH 8.5, 20 mM ammonium acetate (Sigma-Aldrich) pH 6.5, or 20mM sodium acetate pH 4.5 (Sigma-Aldrich) were used as the mobile phase. All solutions were degassed using a Schlenk-line in which the ultra-high purity argon inert gas had been passed through a deoxygenation catalyst. A flow rate of 0.350 ml min−1 was used for all column types. Chemstation for LC 3D System (vB.04.03) software was used for data analysis.
The LC was interfaced with an on-line inductively coupled plasma mass spectrometer (ICP-MS; Agilent 7700x, Tokyo Japan) as described.43 The ICP-MS parameters used were: RF power, 1550 W; Ar flow rate, 15 L/min; carrier gas flow rate, 1.05 L/min; collision cell He flow rate, 4.1 ml/min; sample skimmer cones, Ni, Ni. The elements detected were: 31P, 34S, 45Sc, 48Ti, 55Mn, 56Fe, 57Fe, 59Co, 60Ni, 63Cu, 65Cu, 66Zn, 68Zn, 89Y, and 95Mo. The ICP-MS was tuned daily and a second time per day if the instrument was used continuously for longer than 12 hrs. A stock tuning solution (Agilent, 5188–6564) containing 10 ppm of Ce, Co, Li, Tl, and Y with 2% nitric acid (v/v) was used to prepare a 1 ppb tuning solution that was diluted with HPW and acidified to 2% TMGNA. The tuning counts were adjusted to the manufactures recommendations in both no-gas and helium collision mode. ICP-MS Masshunter Workstation Software for ICP-MS (v.B.01.01) was used for data analysis.
PEEK sample loops were incubated with 3 loop-volumes of 10% TMGNA in high purity water for 3 hrs on the bench top and then rinsed with 3 loop-volumes of high purity water. The sample loop was installed into the injector and rinsed with 3 loop-volumes of mobile phase prior to injecting the sample. LMM analysis was performed by injecting 300 μL of solution onto two Superdex Peptide 10/300 GL (GE Healthcare) column connected in series. Sample analysis time was for 2 hrs and 38 min. HMM analysis was performed by injecting 150 μL of solution onto a Superdex 200 10/300 GL (GE Healthcare) column; sample analysis time was 80 min.
The columns were cleaned at the end of each working day as described.43 The chelator cocktail used for cleaning was made up with HPW and contained 10 mM ascorbic acid (Acros Organics), 1 mM citric acid (Sigma-Aldrich), and the following chelators at 5 μM final concentration: EDTA (Sigma-Aldrich), EGTA (Sigma-Aldrich), 1, 10-phenanthroline (Acros Organics), 2,2′-bipyridine (Alfa Aesar), bathocuprosulfonate (Sigma-Aldrich), and deferoxamine mesylat (Calbiochem). The chelator cocktail was degassed before use on the Schlenk line. The chelator cocktail were passed through the column at a flow rate of 0.150 ml min−1. A gradient was performed for the cleaning cycle with the columns being flushed with HPW for 10 min, then a 20 min gradient from the current mobile phase to the chelator cocktail. 60 mL of the chelator cocktail was passed through the column, after which a 30 min gradient to the desired mobile phase was performed. The system was left on the desired mobile phase at the same flow rate until the system was used.
During analysis, the column was equilibrated at a flow rate of 0.350 ml min−1 for 1 hr. Post-equilibration, the baseline of the ICP-MS detection response was monitored 30 min prior to analysis. In the event of spurious peaks or column contamination, the column was allowed to equilibrate for the duration of a sample analysis. When the baseline became flat again the sample was reinjected.
A ghost column was used to determine the relative abundance of material that was retained or absorbed from the SEC columns. The ghost column consisted of a piece of PEEK tubing connecting the injection port and the diode array. This tubing replaced the originally installed column. Sample or standards were injected onto the ghost column and the elemental detection response of the injected material was recorded by ICP-MS. This method gave single peaks of all detected isotopes of interest, affording a quantitative representation of the detection response for the sample of interest. Peak areas were determined using peak fitting software supplied by Agilent. The ghost column analyte areas were compared to the total area of the sample which had been run on the SEC column to determine the extent of iron adsorption to or from the column. HMM peaks were deconvoluted into component peaks with the peak fitting software FitYK.48
Molecular Mass Assignment
The apparent molecular mass associated with each chromatographic peak was calculated using a standard curve. Nine known species were used to generate the LMM calibration curve and five known species were used to generate the HMM calibration curve. Concentrations and masses used are described above. The elution volume (Ve) of each species was determined using either the ICP-MS or the UV-VIS diode array. The void volume (Vo) of the size-exclusion columns was determined to be 15.4 mL for the Superdex Peptide columns and 8.48 mL for the Superdex 200 column using blue dextran. The calibration curve was generated by plotting the logarithm of the molecular weight vs. Ve/Vo. A best-fit linear regression analysis was generated from the data points.43 The best fit linear regression for the LMM calibration curve was calculated to be: Logarithm of Mass (in Da) = −1.1233⋅(Ve/Vo) + 5.5239, with R2 of 0.8524. The HMM calibration curve was calculated to be: Logarithm of Mass (in Da) = −1.1002⋅(Ve/Vo) + 6.6186, with R2 of 0.9889. Mass determinations for the standards used for the calibration curve gave an error between 3–30% for LMM calculations and 1–20% for HMM calculations for the expected masses. All metal containing species used in calibration were detected by ICP-MS while those lacking metals were detected by UV-VIS.
Elemental Concentrations
50 μL of plasma or 100 μL of LMM FTS were aliquoted into a 15 mL plastic screw-top polypropylene tube (BD Falcon) along with a sufficient TMGNA to afford a final concentration of 2% (v/v) of acid and sufficient HPW to afford a total volume of 5 mL. Samples were generated in triplicate. A laboratory reagent blank and laboratory control sample were generated in duplicate with every 25 samples made. Either HPW or an atomic absorption standard were used at the same sample volume and under matrix-matched conditions to that of the samples for the validation controls. Tubes were sealed by wrapping electrical tape around the cap. Samples were incubated in an oven for 14–16 hrs at 75°C and then chilled for 1 hr at 4°C. Samples were diluted to a final volume of 5 mL for plasma and 3 mL for LMM FTS post-chilling using HPW. Calibration curves were generated from an atomic absorption standard (Inorganic Venture, Christiansburg Virginia, USA) containing P, S, Cu, Mn, Zn, Fe, 57Fe, Co, Mo, Ti and prepared to a final TMGNA concentration of 2%(v/v) and diluted using HPW. Elemental analysis was performed on the ICP-MS using He collision mode. Elements detected were: 31P, 45Sc, 48Ti, 55Mn, 56Fe, 57Fe, 59Co, 60Ni, 63Cu, 66Zn, 89Y, and 95Mo. An online-addition of internal standard (Inorganic Venture, IV-IPMS-71D), measuring Y and Sc, were used to account for instrument drift. The detection response for each element was normalized to the Sc internal standard counts to adjust for instrument drift, sample introduction variability, and matrix effects. Y detection response was used to diagnose unusual instrument behaviour and help in troubleshooting.
Results
LMM iron-containing species in healthy blood plasma
The average iron concentrations of plasma samples (n = 10) and corresponding FTSs (n = 11) were 21 ± 7 μM, and 1.1 ± 0.2 μM, respectively. Thus, ca. 5% of the iron in healthy plasma was due to LMM iron complexes. The LC-ICP-MS chromatograms of 14 FTSs from the plasma of pigs, horses, mice, and humans exhibited iron-detected peaks in the LMM region (Figure 1). In these runs, the mobile phase of the LMM column was buffered at pH 8.5.
We distinguished two regions in these chromatograms, called variable and anchor. The variable region spanned apparent masses between 600–2500 Da whereas the anchor region included apparent masses between 350–550 Da. These and other mass estimates based on elution volumes are apparent because they were determined by calibration against the elution time of various standards (see Experimental Procedures). We estimate ± 30% uncertainties for these masses.
As the name implies, the peaks in the anchor region were more reproducible than those in the variable region. Two partially resolved iron-containing species were routinely observed in the anchor region, to be called Fe400 and Fe500 where the numbers refer to approximate masses in Da. These two species are best represented in traces B, D, L, N, and O of Figure 1. Four iron-containing peaks were observed (collectively) in the variable region – including Fe2500, Fe1700, Fe1000, and Fe600. Of these, Fe2500, Fe1700, and Fe1000 were most reproducible; Fe600 was not present in Figure 1 traces but was observed in traces of other figures (e.g. Figure 2).
We examined fresh vs. frozen-and-thawed FTSs from plasma of two horses to evaluate the stability of the detected LMM iron-containing species. No significant differences were observed (Figure 2, traces A vs. B, and traces D vs. E). There were greater differences between the chromatograms of the two horses (Fe1700 was reproducibly intense in the traces from Horse 1 but absent in traces from Horse 2). Anchor peaks were observed in traces from both animals. Traces of sera were indistinguishable from those of plasma (Figure 2, B vs. C). We also re-ran samples after incubating them in the glove box for 1 (Figure 2F) and 9 (Figure 2G) days. Minor differences were evident, relative to the original trace (Figure 2E).
LC-ICP-MS traces of ferric citrate at pH 8.5
Given the likelihood that NTBI was ferric citrate, we wondered whether solutions of this complex would afford the same suite of signals as observed for FTSs from plasma/sera. We prepared various solutions of ferric citrate and applied them to our LC column after 24 hrs of “aging”. We used the same conditions as had been used to run plasma FTSs. Allowing ferric citrate solutions to “age” is important because the kinetics of ferric ions coordinating to citrate is slow.19,49 Larger oligomers of ferric citrate reportedly develop with aging.19 Consistent with this, the intensity of a peak at 2500 Da increased after a ferric citrate solution was incubated for 24 hrs rather than for 30 min (Figure 3, traces A vs. B).
The molar ratio of iron to citrate also affects which ferric citrate complex(es) is/are generated.19 Consistent with this, we observed different peaks (at pH 8.5), ranging from 1200–4100 Da, depending on the ratio used (the 4100 Da peak was observed with the 1:10 ratio). Peaks associated with ferric citrate shifted toward lower masses as the iron:citrate molar ratio changed from 1:10 → 1:100 → 1:1000 → 1:10,000 (see Figure S1 for ratios other than 1:100). Silva et al. reported a similar phenomenon.37 A control trace of 100 μM citric acid alone was devoid of iron intensity (Figure 3C). No ferric citrate-associated peaks were observed at 400 or 500 Da regardless of ratio. This suggests that these anchor peaks do not correspond to ferric citrate. On the other hand, at the physiological ratio of 1:100, a 2500 Da peak is observed in both ferric citrate and occasionally in plasma FLSs. Thus, our results are mixed, providing a modicum of evidence that the LMM iron in plasma is ferric citrate, but also providing strong evidence that blood plasma contains LMM iron species other than ferric citrate.
Iron absorption onto column
The combined peak intensities of the ferric citrate traces also varied with iron:citrate molar ratio. The 1:100 solution exhibited strong combined intensity (Figure 3A), whereas the 1:10 solution exhibited less intense features (Figure S1). When 1 μM FeCl3 was analyzed without any citrate, chromatograms were devoid of iron intensity, similar to Figure 3C. These results imply that some iron was absorbed onto the column. A greater percentage of ferric ions was absorbed using solutions containing less citrate. Consistent with this, Evans et al.19 reported that at iron:citrate ratios of 1:1 and 1:10, the predominant species in solution is ferric hydroxide which is highly insoluble and liable to adhere to chromatography columns. To some extent, citrate coordination protects ferric ions from being absorbed.
The concentration of iron-containing complexes that we detected in plasma FTSs corresponded to as little as ~ 30 nM. This prompted us to evaluate the extent of recovery of ferric citrate standards on the column. Recovery was low, indicating iron absorbed onto the column. However, the observed peak elution volumes for the various iron:citrate ratios were reproducible. Others have reported similar iron absorption on Superdex peptide columns.50 The absorption of iron by the column was noticeable because the total amount of iron in our samples was low. A similar extent of absorption was insignificant for studies involving iron complexes at higher concentrations.43,44
Spiking FTSs with ferric citrate
If the peaks in the anchor region of FTSs were due to ferric citrate, then adding additional ferric citrate (at the 1:100 ratio expected for plasma) should increase the intensities of the same peaks. On the other hand, if the anchor peaks were not due to ferric citrate, then spiking FTSs with ferric citrate would yield peaks of the same apparent masses as observed for ferric citrate solutions (e.g. at 2500 and 1200 Da).
To examine this, we added 1 μM ferric citrate standard (1:100) to horse and pig FTSs and incubated them for different times. FTS samples which were incubated at room temp or 8°C showed no significant chromatographic differences. Regardless of incubation time, the intensities of the anchor peaks were unaffected and new peaks developed at 2400 and 1200 Da (Figure 4, C and G) relative to the pre-spiked FTS (Figure 4, D and H). These peaks may have arisen from ferric citrate, but the intensities are very low, precluding any such assignment. This experiment also suggests that the anchor peaks are not due to ferric citrate.
The developed peaks in the spiking experiment were far less intense than expected for spiking FTSs with 1 μM ferric citrate (the same concentration used to generate Figure 3A). We speculate that exposure of ferric citrate to the FTS prompted the partial dissociation of the complex followed by adsorption of some ferric ions onto the column. Our calculations suggest that much of the added ferric citrate was absorbed onto the column; only a modest portion generated the newly developed peaks. This implies that ferric citrate is not particularly stable in plasma FTSs.
Spiking FTSs with FeCl3
We next probed the coordinating ability of FTSs by spiking them with 1 or 4 μM FeCl3. The 1 μM spike incubated for 7 hr (Figure 4, B and F) showed little change in the variable region relative to the controls (Figure 4, D and H). There was an increase in the anchor region peaks for trace B but not for trace F. The 4 μM spike (Figure 4, A and E) generated variable-region peaks at 2500 and 1200 Da relative to controls. These traces also exhibited an unresolved iron-absorption between 1200 and 600 Da.
Peak intensities in the anchor region increased in the 4 μM FeCl3 spikes relative to the 1 μM spikes. However, intensities were still significantly less than expected given the concentration of added iron. Again, we conclude that much of the added ferric ions bound to the column. The low-intensity 1200 and 2500 peaks that developed in the FeCl3 spike may have arisen from the formation of a slight amount of ferric citrate (using the endogenous citrate ions in FTSs), but the observed peak intensity ratio was not expected if this were the case. Peaks in the anchor region probably arose from other iron complexes.
Spiking FTSs with apo-Tf
We next wondered whether the LMM iron complexes in the anchor region would bind apo-Tf or whether these complexes coexist with apo-Tf. To examine this, we spiked plasma FTSs with 4 μM apo-Tf, passed the solution through the LMM column, and collected chromatograms in the LMM and void regions (Figure 5, upper and lower panels, respectively). As expected, apo-Tf alone did not exhibit significant peaks in the LMM region (Figure 5E), but it did exhibit a holo-Tf peak in the void due to residual binding of endogenous iron. The plasma FTSs without apo-Tf exhibited LMM features in the anchor region but not in the void (Figure 5, B and D). Anchor peak intensities were essentially unchanged in the traces of the spiked FTSs (Figure 5, A and C) whereas intense holo-Tf peaks were observed in the HMM region. Our results indicate that apo-Tf coordinates iron in the FTSs but not the iron species associated with the anchor region. The LMM iron complexes associated with the anchor region coexist with the transferrin system. Since LMM peaks in the variable region were not observed in this particular experiment, it remains possible that apo-Tf binds iron associated with variable region peaks.
A similar experiment was performed using the HMM column in which proteins are resolved. Again, there was an increase in the intensity of the holo-Tf peak when apo-Tf was added to FTS (Figure 6C). This indicates that the added apo-Tf coordinated some iron in the FTS. The experiment of Figure 5 indicates that this is not the iron associated with the observed LMM iron-containing anchor species. Apo-Tf probably bound iron that would have otherwise been absorbed by the column.
LC-ICP-MS traces of HMM species in plasma
The HMM column resolves holo-Tf and other iron-containing proteins in plasma, including ferritin, haptoglobin (complexed with hemoglobin), albumin, and hemopexin (bound with heme). The HMM region of plasma was dominated by holo-Tf and a neighboring partially-resolved species assigned to iron-bound albumin (Figure 7, C–L). Minor variable-intensity peaks eluting between 9–11 mL may have arisen from the haptoglobin:hemoglobin complex and/or from ferritin (Figure 7B). The species around 12 mL elution volume, evident in some traces, probably arose from a high-mass form of transferrin (Figure 7A) peak at 120 kDa.
Plasma traces after spiking with 57ferric citrate and 57FeCl3
We evaluated whether 57Fe citrate and/or 57FeCl3 could bind these iron-related proteins by performing two spiking experiments. In one experiment, we added 4 μM 57FeIII citrate (1:100 molar ratio) to fresh horse plasma and incubated for 30 min. The sample exhibited a far more intense 57Fe-bound transferrin/albumin peak than the control (Figure 8, top panel, A vs. C). It also exhibited more intense 57Fe peaks in the LMM region and a peak corresponding to a mass of ca. 20 kDa (Figure 8, top panel inset, A vs. C). We have not assigned the 20 kDa species but assume that it is proteinaceous. The corresponding 56Fe-detection traces were essentially unchanged by the spike (Figure 8, lower panel). This confirms that most of the added 57FeIII citrate bound to apo-Tf and albumin. Some of that iron became associated with the unknown 20 kDa protein, and a small portion remained as LMM species. These results show that there is no specific or dedicated ferric citrate binding site on apo-Tf. The iron from ferric citrate can bind to many proteins.
The other 57Fe spiking experiment was performed by incubating fresh plasma with 4 μM 57FeCl3 for 30 min, followed by passage down the column. The resulting 57Fe trace was intermediate in intensity between the control and the 57FeIII citrate spike (Figure 8, upper panel, B). This demonstrates that 57FeCl3 can also bind to apo-Tf and albumin (but curiously not to the 20 kDa protein). The kinetics of binding to these proteins may be slower than that involving ferric citrate.19 Some 57FeIII ions from 57FeCl3 may have precipitated from solution and absorbed onto the column whereas less 57FeIII citrate did this (consistent with the stronger LMM peak in the ferric citrate spike vs. in the ferric chloride spike; see Figure 8, upper panel, inset).
LC-ICP-MS traces of FTSs buffered at pH 6.5
We lowered the pH of the LMM column mobile phase to 6.5 to reduce the amount of iron that absorbed onto the column.51 FTSs that were run down the pH 6.5 column did not exhibit peaks at 2500 Da or 1700 Da (Figure 9), in contrast to those obtained at pH 8.5. Peak intensities in the anchor regions were similar to those of samples run at pH 8.5. Some traces exhibited a feature at 1100 Da as well as broad incompletely resolved peaks at < 300 Da. We refer to these latter iron species as “post-anchor”. We conjecture that post-anchor species are related to hexaqua coordinated iron. Post-anchor iron may absorb onto the column when buffered to pH 8.5. This form of iron may also bind apo-Tf. We also examined fresh vs. frozen-and-thawed FTSs from plasma to evaluate the stability of the detected LMM iron-containing species at pH 6.5. No significant differences were observed (Figure 9, traces A vs. B).
LC-ICP-MS traces of ferric citrate when the column mobile phase was buffered at pH 6.5
We wondered whether ferric citrate would run differently at pH 6.5 than at 8.5. To examine this, we passed 1 μM ferric citrate solutions (using different iron:citrate ratios) through the column buffered at pH 6.5. At the physiological 1:100 ratio, dominant peaks were evident at 1700 and 1000 Da (Figure 3D) - somewhat different than those observed at pH 8.5. Similar to the situation at pH 8.5, more iron from the ferric citrate solution bound to the column at iron:citrate ratios of 1:10 than at ratios of 1:100, 1:1000 or 1:10,000. A control of 100 μM citric acid alone was also devoid of iron intensity (Figure 3E), indicating that free ligand was not generating artifact species in standards. A similar trace was observed for an FeCl3 control.
Ferric citrate at 1:100 ratio was also run through a “ghost” column (i.e. peek tubing) to assess sample recovery. There was some iron absorption on the column from ferric citrate at pH 6.5, but much less than at pH 8.5. At pH 6.5 we were able to achieve near full recovery of the ferric citrate standard off the column, but only at physiological relevant concentrations. More ferric ions must dissociate from citrate at lower citrate concentrations, promoting the absorption of iron onto the column. This suggests that the post-anchor iron in FTSs (which represents a significant fraction of total LMM iron in plasma) is not ferric citrate.
Addition of ferric citrate, FeCl3, and apo-Tf to Plasma FTSs (column mobile phase at pH 6.5)
We again investigated whether FTS peak intensities are enhanced when solutions are spiked with ferric citrate or FeCl3. Plasma FTSs were spiked with 4 μM ferric citrate (1:100 ratio) and run down the column equilibrated at pH 6.5. The LMM trace was dominated by peaks at 3500, 1500, and 1000 Da (Figure 10A). The 1000 Da peak was similar to that seen in traces of ferric citrate solutions (Figure 3D), while the broad 1500 Da peak migrated differently than the 1700 Da peak in ferric citrate solutions. Neither peak was observed in the control FTSs (Figure 10C). These results again suggest that ferric citrate is not the dominant LMM iron complex in plasma.
We also spiked FTSs with 4 μM FeCl3 and ran the resulting solution down the column buffered at pH 6.5. The resulting trace exhibited peaks at 1900, 1000, 800, and 400 Da (Figure 10B). The species at 1000 Da is similar to the major peak observed in the previous spike. The species at 400 Da comigrated with anchor region species.
LC-ICP-MS traces of FTSs and ferric citrate solutions when column was buffered at pH 4.5
We ran plasma FTSs down the LMM column buffered at pH 4.5 to more completely explore the effect of pH on the observed peaks. Peaks were observed at 1000, 800, 700, 550, 400, and 350 Da, albeit with some sample variation (Figure 11). There was also broad but reproducible absorption in the post-anchor region. The decline in detector response at ca. 38 mL elution volume (causing a depression in baseline) was associated with the low pH of the mobile phase. The effect was particular to iron, as similar depressions were not observed in traces of other metals (from the same runs). A similar depression was observed in traces of ferric citrate solutions (Figure 3F). In these traces, intense peaks were observed at 1800 and 800 Da, with the 1800 peak dominating at 1:100 ratios. The 800 Da peak comigrated with a peak of the same approximate mass in the plasma FTSs, but the dominating 1800 Da peak in ferric citrate traces was absent in FTSs. A control of 100 μM citric acid alone was devoid of iron intensity (Figure 3H), indicating that free ligand was not generating artifact species in standards. A similar trace was observed for FeCl3 control (Figure 3G). For the ferric citrate standard traces, there was no iron absorption in the post-anchor region. This again suggests that the post-anchor iron evident in the FTS traces is not ferric citrate. The absence of Fe1800 in FTSs also suggests that lack of ferric citrate.
Discussion
In this study, we have resolved, for the first time, a half-dozen LMM iron-containing species obtained from blood plasma and sera. The apparent masses of the species ranged from < 300 Da to ca. 2500 Da. Two species with masses of ca. 400 and 500 Da were reliably present in samples, regardless of column pH, and are referred to as anchors. The presence of the other species, with masses ranging from 600–2500 Da, was more variable.
We have not studied the cause of the individual variation of peak intensities systematically, but factors such as the health of the animal may contribute. There were no noticeable differences in samples that were run fresh vs. after freezing-and-thawing, or with changes in temperature or incubation time.
We attempted to minimize variations caused by instrumentation. We operated the column in a refrigerated anaerobic glove box to avoid oxidizing soluble FeII to FeIII and to slow-down ligand exchange processes. Aqueous FeIII ions are far less soluble than aqueous FeII ions at neutral pH and are easily absorbed onto the column. We cleaned the column daily after use with a chelator cocktail, and occasionally ran blank buffer samples to make sure that species of interest for this study were not observed. If significant peaks or rolling baselines were observed, the column was cleaned again until baselines were flat.
The variability of peaks did not seem to be strongly affected by nutrient status, though a more systematic study is needed to establish this. The trace from a healthy human volunteer who ate a 10 oz. steak within an hour of giving blood (Figures 1N and 9F) was nearly identical to that from the same person after fasting 24 hrs (Figures 1O and 9E).
Neither were differences evident in humans with hemochromatosis relative to healthy controls. We had expected that traces from such patients would have exhibited either more intense LMM iron peaks or additional peaks that would have either been absent in controls or present at lower intensities. The four patients whose plasma was examined routinely donated blood as a means of controlling their condition, and we suspect that doing so was effective in maintaining low NTBI levels. Perhaps the blood of individuals who have not been treated for the disease would contain additional species or higher concentrations of the observed LMM iron species. However, we were unable to identify such individuals within the timeframe of the study.
The iron concentration in FTSs was ca. 1 μM but the collective iron concentration associated with the LMM iron complexes was in the hundreds of nM; a significant portion, also in the hundreds of nM, absorbed on the column, especially at higher pH. These low-concentration iron-containing species would not have been detectable if not for the high sensitivity of our LC-ICP-MS system. The proportion of iron in the FLS that absorbed on the column depended on the pH of the mobile phase buffer of the column, with less absorption at pH 6.5 and 4.5 than at pH 8.5.
Ferric citrate leads the list of NTBI candidates but the peaks observed in FTS traces were not obviously the same as in traces of ferric citrate (run under identical conditions and at the physiologically relevant 1:100 molar ratio). The observed iron species in plasma FTSs and ferric citrate solutions are summarized in Figure 12.
Figure 12.
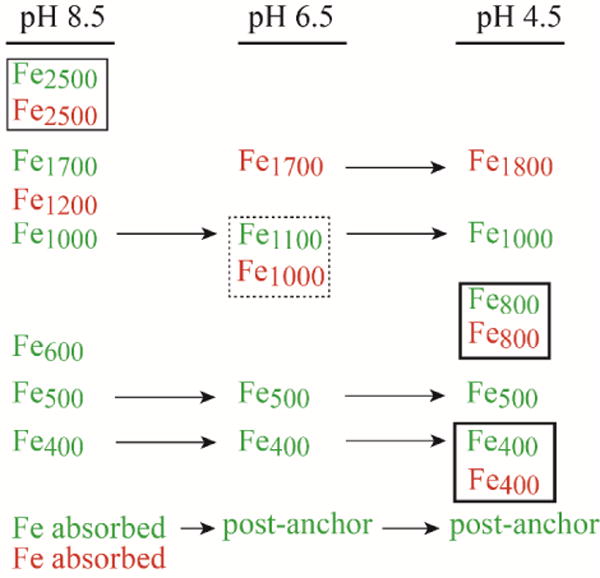
Summary of LMM iron species observed in plasma flow-through solutions (green) and ferric citrate solutions (red) obtaining with different column mobile phase pH. Species that comigrate are placed in boxes. Species that are observed at more than one pH are designated with arrows.
Within the variable region, the peaks corresponded to masses of 2500, 1700, 1000, and 600 Da were observed when the column was buffered at pH 8.5. Of these, Fe1700 was the most commonly observed. Under the same conditions, ferric citrate was present as Fe2500 (major) and Fe1200 (minor). A significant portion of FTS iron and ferric citrate absorbed onto the column under these conditions.
When the column was buffered at pH 6.5, the most common peak (besides the anchors) in the FTS was Fe1100. Also observed were broad peaks in the very low mass “post-anchor” region. Much of this iron absorbed onto the column at pH 8.5. In contrast, the dominant ferric citrate species under these conditions were Fe1700 (major) and Fe1000 (minor); no post-anchor iron was observed.
When the column was buffered at pH 4.5, Fe1800 was the dominant peak in ferric citrate traces, with minor peaks similar to Fe800 and perhaps Fe400. FTSs at pH 4.5 did not exhibit the Fe1800 peak and had a balanced intensity distribution of ca. 4 peaks that including Fe800 and Fe400 among others. Significant levels of post-anchor iron were also observed. Less ferric citrate iron was absorbed onto the column at the lower pHs, and we conclude that this column-absorbing/post-anchor form of iron in FTS is probably not ferric citrate. We estimate that this form of iron represents at least half of the iron in the FTS.
Considered collectively, our results do not support the view that ferric citrate is the dominant or even a major LMM iron species in healthy blood plasma or sera
We cannot exclude the possibility that a small proportion of FTS consists of ferric citrate or the possibility that citrate ions are one of many ligands of other LMM iron complexes in FTS. In any event, our results paint a very different picture of the LMM iron in blood plasma – one in which ferric citrate plays a minor role if any.
The conclusion that NTBI is ferric citrate is largely due to a heavily cited study by Grootveld et al.46 Similar to our study, those authors used HPLC to speciation NTBI from FTSs of plasma and sera, and they investigated plasma from hemochromatosis patients. Unlike our study, they also examined plasma and FTSs using NMR spectroscopy.
By NMR, Grootveld et al. found that plasma of such patients contained more citrate than healthy controls (ca. 400 vs. 100 μM). They discovered that the free citrate concentrations increased ~ 2-fold when a chelator was added to blood plasma. The authors concluded that the iron in the FTS must be bound to citrate, and that the free citrate concentration increased because the chelator removed iron from the ferric citrate in plasma. However, even if the chelator removed all of the iron in plasma (measured to be 1–10 μM), the free citrate level would have only increased by a few percent. Thus, their conclusion does not follow from their results. The observed 2-fold increase in the NMR citrate signal intensity upon chelator treatment must have been due to other causes.
Grootveld et al. also observed a gradual decline in the free citrate NMR signals when 100–500 μM FeCl3 was added to plasma. They reasonably concluded that the added ferric ions coordinated to free citrate, causing paramagnetic broadening. However, the concentration of iron added was 100–500 times higher than that present in plasma (and about 100 times higher than used in our study). Their observation, although real, is not physiologically relevant.
The same authors also determined the HPLC elution volume of ferric citrate and discovered a co-migrating peak in plasma and sera FTSs that increased in intensity when samples were spiked with FeCl3. They concluded that this comigrating peak arose from ferric citrate. Our first concern is that they monitored the absorbance at 340 nm, not by measuring iron directly as we did in our ICP-MS-detected traces. Thus, the peak may or may not have originated from an iron-containing species. Also, they used a reversed-phase LC column in which ferric citrate eluted in the void volume. Other LMM metal complexes might have also eluted in the void and contributed to the same peak. Changing pH, solvent composition, and ionic strength altered the retention times of other detected peaks but not the elution time of the peak attributed to ferric citrate. Grootweld et al. regarded this as confirming evidence that the peak arose from ferric citrate. However, if ferric citrate eluted in the void volume, changing properties that affected retention times on the column would probably not affect void peaks.
Grootveld et al. reported that ferric citrate and plasma FTSs had overlapping UV-vis spectra, and they used this result to conclude that ferric citrate was the dominant chromophore in FTS. However, the presented spectra were featureless and lacked distinction. Prompted by this, we collected spectra of FTS and ferric citrate (at physiological concentrations and at a 1:100 molar ratio). Spectra of FTSs exhibited more structure than that of ferric citrate (Figure 13, A–C). From these spectra we cannot exclude the possibility that FTS contains some ferric citrate but neither do they provide any positive evidence that it does. If FTS contains ferric citrate, it is clearly not the dominant chromophore.
We were also concerned was that the HPLC chromatograms of plasma and ultrafiltrate (what we call FTS) presented by Grootveld et al. were nearly identical (in Ref 46, see Figures 4B1 and 4B2 for the plasma traces and Figure 5 for the ultrafiltrate trace). This seems unlikely given the far greater compositional complexity of plasma vs. FTSs. Finally, the authors didn’t explain (or even comment) why their HPLC traces extended so dramatically below baseline. We had a similar qualitative problem (for iron at pH 4.5 only) but in their case, the extent to which traces extended below baseline was > 5-times the ferric citrate peak intensity. In our worst trace, the negative “peak” intensity was equal to that of the above-baseline signals.
We conclude that the Grootveld et al.46 study provides no compelling evidence for the presence of ferric citrate in blood plasma or sera under normal physiological conditions, or in blood from patients with hemochromatosis. Their major conclusion - that plasma NTBI is ferric citrate – simply does not follow from the data presented. Given the problems associated with their experiments, we are surprised that the paper has been cited hundreds of times over the past 30 years without any previous mention of any of these problems.
Other support for the notion that NTBI = ferric citrate comes from thermodynamic calculations which indicate that multiple ferric citrate species should be extremely stable under the conditions in the plasma.36,37 We have no reason to doubt the veracity of these results, but we reiterate the cautionary comment of Evans et al.19 that thermodynamics is not the only factor that dictates what reaction chemistry is observed. Reaction kinetics can be important, and the kinetics of forming ferric citrate is surprisingly slow.19 Given that the iron in the plasma turns-over ever few hours (1), the slow kinetics of ferric citrate formation rather than the thermodynamic stability of the resulting complex may prevent this complex from dominating the LMM iron species in the blood.
The coexistence of the LMM anchor species with apo-Tf contrasts with the view that NTBI in plasma binds extraordinarily tightly to apo-Tf. Assuming the dissociation reaction {holo-Tf ⇄ apo-Tf + NTBI}, the ratio [apo-Tf]/[holo-Tf] ≈ 0.6/0.4, and [NTBI] = 0.1 μM, Kd would be ~ 0.15 μM, which is much weaker than reported.36,52–55 (quantitative comparisons may be difficult because different equilibrium expressions were assumed in the cited papers). In any event, our results show that there are LMM iron complexes in the plasma that can coexist with apo-Tf. Watt and co-workers have found that the binding of phosphate to ferric citrate prevents binding to apo-Tf,56 and further studies are underway to evaluate whether this could be related to coexistence.
We initially assumed that the LMM iron species detected here originated directly from nutrient iron absorption, but the possibility that they originate from erythrocyte recycling also seems reasonable. Circulating erythrocytes have a 120-day lifespan after which they are degraded by macrophages in the liver (Kuppfer cells) and in the spleen (red pulp macrophages). Heme oxygenase in these macrophages breaks down heme and releases iron (in an unknown form) into the blood where it migrates to the bone marrow for erythropoiesis. Relative to nutrient iron import, erythrocyte recycling involves far more iron with far higher flux rates,5 and it (rather than nutrient iron import) may control the LMM iron-containing species that we have observed. Conceivably, these macrophages may release the detected LMM iron species, which are then delivered to the bone marrow to generate new erythrocytes. In this case, the LMM iron species detected here may not be NTBI as we define it in the Introduction, but rather LMM species involved in erythrocyte recycling. Further studies are underway to understand the origin of the detected LMM iron species and to detect the “real” NTBI that is generated exclusively under iron overload conditions.
Conclusions
One major conclusion of this study is that blood plasma and sera from humans, horses, pigs and mice contain 2–6 low-molecular-mass iron complexes with approximate masses between 400–2500 Da. These complexes are present at very low concentrations (10−7–10−8 M) and they are quite labile. The same complexes are present in healthy individuals and those with hemochromatosis (who are undergoing regular treatment). These complexes migrate differently than ferric citrate by gel filtration chromatography, conflicting with the popular and seemingly established notion that ferric citrate is the dominant low-molecular mass iron containing complex in blood. These results are significant because a pool of low-molecular mass iron called NTBI (non-transferrin bound iron) causes damage to the heart and liver in individuals with iron-overload diseases. Some fraction of the low-molecular mass iron pool is absorbed by the chromatography column, depending on pH. This fraction binds readily to apo-transferrin and other iron-binding proteins in the blood such as albumin. Other low-molecular-mass iron complexes do not bind apo-transferrin but coexist with it in the blood. The observed low-molecular-mass iron complexes may originate from nutrient iron or from erythrocyte recycling. We are uncertain if the observed iron complexes are NTBI (defined as the iron species that damage organs), but if they are, NTBI is not predominately ferric citrate.
Supplementary Material
Acknowledgments
This work was supported by the National Institutes of Health (R35 GM127021), the Robert A. Welch Foundation (A1170), and a grant from the Texas A&M University Strategic Transformative Research program. The latter two grants exclusively funded animal- and human-related aspects. The content is solely the responsibility of the authors and does not necessarily represent the official views of the National Institutes of Health. We thank Dr. Susan Rossman from the Gulf Coast Regional Blood Center (Houston Texas) and all of the volunteers who donated blood for this study. We also thank Robert C. Hider (Kings College, London) and Wesley Harris (University of Missouri) for helpful critical discussions.
Footnotes
Conflicts of interest
There are no conflicts to declare.
Electronic Supplementary Information (ESI) available: This includes Figure S1 showing LC-ICP-MS traces of FeIII citrate run at different iron:citrate ratios and different mobile phase pH. See DOI: 10.1039/x0xx00000x
Notes and references
- 1.Ganz T. Systemic iron homeostasis. Physiological Reviews. 2013;93:1721–1741. doi: 10.1152/physrev.00008.2013. [DOI] [PubMed] [Google Scholar]
- 2.Gulec S, Anderson GJ, Collins JF. Mechanistic and regulatory aspects of intestinal iron absorption. Am J Physiology - Gastrointestinal and Liver Physiology. 2014;307:G397–G409. doi: 10.1152/ajpgi.00348.2013. [DOI] [PMC free article] [PubMed] [Google Scholar]
- 3.Knutson MD. Iron transport proteins: gateways of cellular and systemic iron homeostasis. J Biol Chem. 2017;292:12735–12743. doi: 10.1074/jbc.R117.786632. [DOI] [PMC free article] [PubMed] [Google Scholar]
- 4.Muckenthaler MU, Rivella S, Hentze MW, Galy B. A red carpet for iron metabolism. Cell. 2017;168:344–361. doi: 10.1016/j.cell.2016.12.034. [DOI] [PMC free article] [PubMed] [Google Scholar]
- 5.Drakesmith H, Nemeth E, Ganz T. Ironing out Ferroportin. Cell Metabolism. 2015;22:777–787. doi: 10.1016/j.cmet.2015.09.006. [DOI] [PMC free article] [PubMed] [Google Scholar]
- 6.Mitchell CJ, Shawki A, Ganz T, Nemeth E, Mackenzie B. Functional properties of human ferroportin, a cellular iron exporter reactive also with cobalt and zinc. Am J Physiology – Cell Physiology. 2014;306:C450–C459. doi: 10.1152/ajpcell.00348.2013. [DOI] [PMC free article] [PubMed] [Google Scholar]
- 7.Fuqua BK, Lu Y, Darshan D, Frazer DM, Wilkins SJ, Wolkow N, Bell AG, Hsu J, Yu CC, Chen H, Dunaief JL, Anderson GJ, Vulpe CD. The multicopper ferroxidase hephaestin enhances intestinal iron absorption in mice. PLOS One. 2014;9:e98792. doi: 10.1371/journal.pone.0098792. [DOI] [PMC free article] [PubMed] [Google Scholar]
- 8.Gimenez E, Benavente F, Barbosa J, Sanz-Nebot V. Towards a reliable molecular mass determination of intact glycoproteins by matrix-assisted laser desorption/ionization time-of-flight mass spectrometry. Rapid Commun Mass Spectrom. 2007;21:2555–2563. doi: 10.1002/rcm.3109. [DOI] [PubMed] [Google Scholar]
- 9.Meyron-Holtz EG, Moshe-Belizowski S, Cohen LA. A possible role for secreted ferritin in tissue iron distribution. J Neural Transm. 2011;118:337–347. doi: 10.1007/s00702-011-0582-0. [DOI] [PubMed] [Google Scholar]
- 10.Wang W, Knovich MA, Coffman LG, Torti FM, Torti SV. Serum ferritin: past, present, and future. Biochim Biophys Acta. 2010;1800:760–769. doi: 10.1016/j.bbagen.2010.03.011. [DOI] [PMC free article] [PubMed] [Google Scholar]
- 11.Tolosano E, Fagoonee S, Hirsch E, Berger FG, Baumann H, Silengo L, Altruda F. Enhanced splenomegaly and severe liver inflammation in haptoglobin/hemopexin double-null mice after acute hemolysis. Blood. 2002;100:4201–4208. doi: 10.1182/blood-2002-04-1270. [DOI] [PubMed] [Google Scholar]
- 12.Kino K, Tsunoo H, Higa Y, Takami M, Hamaguchi H, Nakajima H. Hemoglobin-Haptoglobin receptor in rat-liver plasma membrane. J Biol Chem. 1980;255:9616–9620. [PubMed] [Google Scholar]
- 13.Kristiansen M, Graversen JH, Jacobsen C, Sonne O, Hoffman HJ, Law SKA, Moestrup SK. Identification of the haemoglobin scavenger receptor. Nature. 2001;409:196–201. doi: 10.1038/35051594. [DOI] [PubMed] [Google Scholar]
- 14.Wejman JC, Hovsepian D, Wall JS, Hainfeld JF, Greer J. Structure of haptoglobin and the haptoglobin-hemoglobin complex by electron microscopy. J Mol Biol. 1984;174:319–341. doi: 10.1016/0022-2836(84)90341-3. [DOI] [PubMed] [Google Scholar]
- 15.Langlois MR, Delanghe JR. Biological and clinical significance of haptoglobin polymorphism in humans. Clin Chem. 1996;42:1589–1600. [PubMed] [Google Scholar]
- 16.Takahashi N, Takahashi Y, Putnam FW. Structure of human hemopexin O-glycosyl and N-glycosyl sites and unusual clustering of tryptophan residues. Proc Natl Acad Sci USA. 1984;81:2021–2025. doi: 10.1073/pnas.81.7.2021. [DOI] [PMC free article] [PubMed] [Google Scholar]
- 17.Carter DC, Ho JX. Structure of serum albumin. Adv Protein Chem. 1994;45:153–203. doi: 10.1016/s0065-3233(08)60640-3. [DOI] [PubMed] [Google Scholar]
- 18.He XM, Carter DC. Atomic structure and chemistry of human serum albumin. Nature. 1992;358:209–215. doi: 10.1038/358209a0. [DOI] [PubMed] [Google Scholar]
- 19.Evans RW, Rafique R, Zarea A, Rapisarda C, Cammack R, Evans PJ, Porter JB, Hider RC. Nature of non-transferrin-bound iron: studies on iron citrate complexes and thalassemic sera. J Biol Inorg Chem. 2008;13:57–74. doi: 10.1007/s00775-007-0297-8. [DOI] [PubMed] [Google Scholar]
- 20.Hider RC, Silva AMN, Podinovskaia M, Ma YM. Monitoring the efficiency of iron chelation therapy: the potential of nontransferrin-bound iron. Annals of the New York Academy of Sciences. 2010;1202:94–99. doi: 10.1111/j.1749-6632.2010.05573.x. [DOI] [PubMed] [Google Scholar]
- 21.Nicolas G, Viatte L, Bennoun M, Beaumont C, Kahn A, Vaulont S. Hepcidin, a new iron regulatory peptide. Blood Cells Molecules and Diseases. 2002;29:327–335. doi: 10.1006/bcmd.2002.0573. [DOI] [PubMed] [Google Scholar]
- 22.Pietrangelo A. Hereditary Hemochromatosis: pathogenesis, diagnosis, and treatment. Gastroenterology. 2010;139:393–408. doi: 10.1053/j.gastro.2010.06.013. [DOI] [PubMed] [Google Scholar]
- 23.Chua ACG, Olynyk JK, Leedman PJ, Trinder D. Nontransferrin-bound iron uptake by hepatocytes is increased in the Hfe knockout mouse model of hereditary hemochromatosis. Blood. 2004;104:1519–1525. doi: 10.1182/blood-2003-11-3872. [DOI] [PubMed] [Google Scholar]
- 24.Hershko C, Peto TEA. Non-transferrin plasma iron. Br J Haematol. 1987;66:149–151. doi: 10.1111/j.1365-2141.1987.tb01291.x. [DOI] [PubMed] [Google Scholar]
- 25.Gosriwatana I, Loreal O, Lu S, Brissot P, Porter J, Hider RC. Quantification of non-transferrin-bound iron in the presence of unsaturated transferrin. Anal Biochem. 1999;273:212–220. doi: 10.1006/abio.1999.4216. [DOI] [PubMed] [Google Scholar]
- 26.Brissot P, Ropert M, Le Lan C, Loreal O. Non-transferrin bound iron: A key role in iron overload and iron toxicity. Biochim Biophys ACTA. 2012;1820:403–410. doi: 10.1016/j.bbagen.2011.07.014. [DOI] [PubMed] [Google Scholar]
- 27.Brissot P, Wright TL, Ma WL, Weisiger RA. Efficient clearance of non-transferrin-bound iron by rat liver: implications for hepatic iron loading in iron overload states. J Clin Invest. 1985;76:1463–1470. doi: 10.1172/JCI112125. [DOI] [PMC free article] [PubMed] [Google Scholar]
- 28.Yanatori I, Richardson DR, Imada K, Kishi F. Iron export through the transporter ferroportin 1 is modulated by the iron chaperone PCBP2. J Biol Chem. 2016;291:17303–17318. doi: 10.1074/jbc.M116.721936. [DOI] [PMC free article] [PubMed] [Google Scholar]
- 29.Pinilla-Tenas JJ, Sparkman BK, Shawki A, Illing AC, Mitchell CJ, Zhao NN, Liuzzi JP, Cousins RJ, Knutson MD, Mackenzie B. Zip14 is a complex broad-scope metal-ion transporter whose functional properties support roles in the cellular uptake of zinc and nontransferrin-bound iron. Am J Cell Physiology. 2011;301:C862–C871. doi: 10.1152/ajpcell.00479.2010. [DOI] [PMC free article] [PubMed] [Google Scholar]
- 30.Brewer CJ, Wood RI, Wood JC. mRNA regulation of cardiac iron transporters and ferritin subunits. Expt Hematology. 2014;42:1059–1067. doi: 10.1016/j.exphem.2014.09.002. [DOI] [PMC free article] [PubMed] [Google Scholar]
- 31.Gutteridge JMC, Rowley DA, Griffiths E, Halliwell B. Low-molecular-weight iron complexes and oxygen radical reactions in idiopathic hemochromatosis. Clin Sci. 1985;68:463–467. doi: 10.1042/cs0680463. [DOI] [PubMed] [Google Scholar]
- 32.Huang FW, Pinkus JL, Pinkus GS, Fleming MD, Andrews NC. A mouse model of juvenile hemochromatosis. J Clinical Investigation. 2005;115:2187–2191. doi: 10.1172/JCI25049. [DOI] [PMC free article] [PubMed] [Google Scholar]
- 33.de Swart L, Hendriks JCM, van der Vorm LN, Cabantchik ZI, Evans PJ, Hod EA, Brittenham GM, Furman Y, Wojczyk B, Janssen MCH, Porter JB, Mattijssen VEJ, Biemond BJ, MacKenzie MA, Origa R, Galanello R, Hider RC, Swinkels DW. Second international round robin for the quantification of serum non-transferrin bound iron and liable plasma iron in patients with iron-overload disorders. Haematologica. 2016;10:38–45. doi: 10.3324/haematol.2015.133983. [DOI] [PMC free article] [PubMed] [Google Scholar]
- 34.Porter JB, Abeysinghe RD, Marshall L, Hider RC, Singh S. Kinetics of removal and reappearance of non-transferrin-bound plasma iron with deferoxamine. Blood. 1996;88:705–713. [PubMed] [Google Scholar]
- 35.Konigsberger LC, Konigsberger E, May PM, Hefter GT. Complexation of iron(III) and iron(II) by citrate. Implications for iron speciation in blood plasma. J Inorg Biochem. 2000;78:175–184. doi: 10.1016/s0162-0134(99)00222-6. [DOI] [PubMed] [Google Scholar]
- 36.May PM, Linder PW, Williams DR. Computer simulation of metal ion equilibria in biofluids: models for the low-molecular-weight complex distribution of calcium(II), magnesium(II), manganese(II), iron(III), copper(II), zinc(II) and lead(II) ions in human blood plasma. J Chem Soc – Dalton trans. 1977;6:588–595. [Google Scholar]
- 37.Lawen A, Lane DJR. Mammalian iron homeostasis in health and disease: uptake, storage, transport, and molecular mechanisms of action. Antioxidants and Redox Signaling. 2013;18:2473–2507. doi: 10.1089/ars.2011.4271. [DOI] [PubMed] [Google Scholar]
- 38.Silva AMN, Kong XL, Parkin MC, Cammack R, Hider RC. Iron(III) citrate speciation in aqueous solution. Dalton Transactions. 2009:8626–8625. doi: 10.1039/b910970f. [DOI] [PubMed] [Google Scholar]
- 39.Arezes J, Costa M, Vieira I, Dias V, Kong XL, Fernandes R, Vos M, Carlsson A, Rikers Y, Porto G, Ragnel M, Hider RC, Pinto JP. Non-transferrin-bound iron (NTBI) uptake by T lymphocytes: Evidence for the selective acquisition of oligomeric ferric citrate species. PLOS One. 2013;8:e79870. doi: 10.1371/journal.pone.0079870. [DOI] [PMC free article] [PubMed] [Google Scholar]
- 40.Cruz E, Melo G, Lacerda R, Almeida S, Porto G. The CD8+ Tlymphocyte profile as a modifier of iron overload in HFE hemochromatosis: an update of clinical and immunological data from 70 C282Y homozygous subjects. Blood Cells Mol Dis. 2006;37:33–39. doi: 10.1016/j.bcmd.2006.04.004. [DOI] [PubMed] [Google Scholar]
- 41.Cardoso EM, Hagen K, de Sousa M, Hultcrantz R. Hepatic damage in C282Y homozygotes relates to low numbers of CD8+ cells in the liver lobuli. Eur J Clin Invest. 2001;31:45–53. doi: 10.1046/j.1365-2362.2001.00744.x. [DOI] [PubMed] [Google Scholar]
- 42.Graham RM, Chua AC, Herbison CE, Olynyk JK, Trinder D. Liver iron transport. World J Gastroenterol. 2007;13:4725–4736. doi: 10.3748/wjg.v13.i35.4725. [DOI] [PMC free article] [PubMed] [Google Scholar]
- 43.McCormick SP, Moore MJ, Lindahl PA. Detection of labile low-molecular-mass transition metal complexes in mitochondria. Biochemistry. 2015;54:3442–3453. doi: 10.1021/bi5015437. [DOI] [PMC free article] [PubMed] [Google Scholar]
- 44.McCormick SP, Chakrabarti M, Cockrell AL, Park J, Lindahl LS, Lindahl PA. Low-molecular-mass metal complexes in the mouse brain. Metallomics. 2013;5:232–241. doi: 10.1039/c3mt00009e. [DOI] [PMC free article] [PubMed] [Google Scholar]
- 45.Simpson RJ, Cooper CE, Raja KB, Halliwell B, Evans PJ, Aruoma OI, Singh S, Konijn AM. Non-transferrin-bound iron species in the serum of hypotransferrinaemic mice. Biochim et Biophys Acta. 1992;1156:19–26. doi: 10.1016/0304-4165(92)90090-h. [DOI] [PubMed] [Google Scholar]
- 46.Grootveld M, Bell JD, Halliwell B, Aruoma OI, Bomford A, Sadler PJ. Non-transferrin-bound iron in plasma or serum from patients with idiopathic hemochromatosis. Characterization by high-performance liquid chromatography and nuclear magnetic resonance Chem spectroscopy. J Biol Chem. 1989;15:4417–4422. [PubMed] [Google Scholar]
- 47.Chakrabarti M, Barlas MN, McCormick SP, Lindahl LS, Lindahl PA. Kinetics of iron import into developing mouse organs determined by a pup-swapping method. J Biol Chem. 2015;290:520–528. doi: 10.1074/jbc.M114.606731. [DOI] [PMC free article] [PubMed] [Google Scholar]
- 48.Wojdyr M. Fityk: a general-purpose peak fitting program. J Appl Crytallogr. 2010;43:1126–1128. [Google Scholar]
- 49.Bates GW, Billups C, Saltman P. The kinetics and mechanism of iron(III) exchange between chelates and transferrin. J Biol Chem. 1967;242:2810–2815. [PubMed] [Google Scholar]
- 50.Flis P, Ouerdane L, Grillet L, Curie C, Mari S, Lobinski R. Inventory of metal complexes circulating in plant fluids: a reliable method based on HPLC coupled with dual element and high-resolution molecular mass spectrometric detection. New Phytologist. 2016;211:1129–1141. doi: 10.1111/nph.13964. [DOI] [PubMed] [Google Scholar]
- 51.Imamura T, Kawamoto H. Preparation of iron(III) sugar complexes. J Fac Fish Anim Husb Hiroshima U. 1974;13:181–188. [Google Scholar]
- 52.Bou-Abdallah F, Terpstra TR. The thermodynamics and binding properties of the transferrins as studied by isothermal calorimetry. Biochim Biophys ACTA. 2012;1820:318–325. doi: 10.1016/j.bbagen.2011.07.013. [DOI] [PubMed] [Google Scholar]
- 53.Martin RB, Savory J, Brown S, Bertholf RL, Wills MR. Transferrin binding to Al3+ and Fe3+ Clin Chem. 1987;33:405–407. [PubMed] [Google Scholar]
- 54.Aisen P, Leibman A, Zweier J. Stoichiometric and site characteristics of binding of iron to human transferrin. J Biol Chem. 1978;253:1930–1937. [PubMed] [Google Scholar]
- 55.Harris WR. In: Iron chemistry in Molecular and cellular iron transport. Templeton DM, editor. Marcel Dekker Inc; New York: 2002. pp. 1–40. [Google Scholar]
- 56.Matias S, Belnap DW, Smith MT, Stewart MG, Torres IF, Gross AJ, Watt RK. Citrate and albumin facilitate transferrin iron loading in the presence of phosphate. J Inorg Biochem. 2017;168:107–113. doi: 10.1016/j.jinorgbio.2016.12.010. [DOI] [PubMed] [Google Scholar]
Associated Data
This section collects any data citations, data availability statements, or supplementary materials included in this article.


