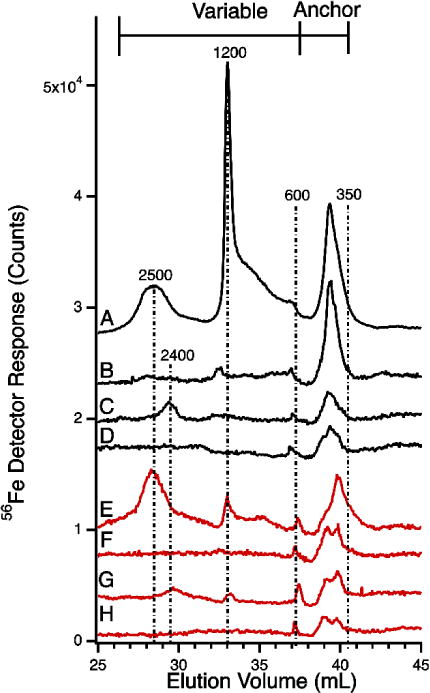
Figure 4.

56Fe-detected chromatograms of flow-through solutions of pig serum (black) and horse plasma (red) before and after spiking. A, after spiking with 4 μM FeCl3 (24 hr incubation); B, after spiking with 1 μM FeCl3 (7 hr incubation); C, after spiking with 1 μM FeIII citrate (1:100, 30 min incubation); D, before spiking; E, after spiking with 4 μM FeCl3 (24 hr incubation); F, after spiking with 1 μM FeCl3 (7 hr incubation); G, after spiking with 1 μM FeIII citrate (1:100, 24 hr incubation); H, before spiking. Column conditions as in Figure 1.
