

Abstract
Processes regulating population connectivity are complex, ranging from extrinsic environmental factors to intrinsic individual based features, and are a major force shaping the persistence of fish species and population responses to harvesting and environmental change. Here we developed an integrated assessment of demographic and genetic connectivity of European flounder Platichthys flesus in the northeast Atlantic (from the Norwegian to the Portuguese coast) and Baltic Sea. Specifically, we used a Bayesian infinite mixture model to infer the most likely number of natal sources of individuals based on otolith near core chemical composition. Simultaneously, we characterised genetic connectivity via microsatellite DNA markers, and evaluated how the combined use of natural tags informed individual movement and long-term population exchange rates. Individual markers provided different insights on movement, with otolith chemistry delineating Norwegian and Baltic Sea sources, whilst genetic markers showed a latitudinal pattern which distinguished southern peripheral populations along the Iberian coast. Overall, the integrated use of natural tags resulted in outcomes that were not readily anticipated by individual movement or gene flow markers alone. Our ecological and evolutionary approach provided a synergistic view on connectivity, which will be paramount to align biological and management units and safeguard species’ biocomplexity.
Introduction
Connectivity plays a key role in shaping fish species persistence and responses to harvesting and environmental change1,2. The processes driving population homogenization or differentiation are complex and range from extrinsic oceanographic and environmental factors, to intrinsic individual-based or species’ specific features (e.g. larval duration, swimming ability, behaviour, life history strategy)3. In tandem, selective pressures and adaptation to gradients of environmental conditions influence population dynamics and connectivity over ecological and evolutionary time scales4,5.
Understanding population structure is paramount to conservation and fisheries decision making, particularly for species with large transboundary distribution ranges, or whose life histories include spatially segregated life stages or migratory behaviour. Marine fish populations range from broad and homogeneous to complex and interconnected units6–8. Yet, disparities between actual biologically discrete populations and management units are still common9–11, and this mismatch severely impacts resource sustainability, and hinders socio-economic and biodiversity goals12,13.
A variety of techniques can be used to infer connectivity and population structure, including indirect estimates via abundance-distribution data or life history parameters, or direct quantifications via artificial or natural tags (e.g. phenotypic, genetic, parasitic markers, otolith chemistry)14. In particular, otolith chemistry is an exceptional marker of fish movement and key to delineating fish populations and management boundaries2,15,16, as otoliths are metabolically inert, grow continuously and their chemical composition is in part influenced by physical and chemical properties of the surrounding environment17. Overall, these biogenic carbonate structures are chronological recorders of the environment fish experience throughout their lifetime, but also reflect genetic and physiological influences on element incorporation18–20, which partly explains their success in discriminating populations within the more homogeneous marine environment21.
The application of otolith chemistry as natural tags for connectivity studies generally relies on first establishing baseline references from source groups (e.g. individuals in spawning or nursery areas). Then individuals of unknown origin collected from mixed populations are retrospectively assigned to characterized source groups via a priori statistical classification approaches (e.g. classification, maximum likelihood analysis)2,15,22. However, the inherent assumption that all potential source sites are characterized is hardly met, and likely unattainable due to sampling limitations or knowledge gaps in species ecology and distribution. This leads to biased assignments as these methods do not allow for unsampled sources beyond the characterized baseline. Therefore, there is growing recognition that frameworks that incorporate uncertainty and resolve the challenge of unknown sources in mixed populations are key to connectivity assessments23–25. In particular, Neubauer et al.26 developed and validated an unconditional Bayesian mixture model, incorporating the main requirements and assumptions employed in otolith chemistry studies, that allows for unknown (infinite) groups and estimates the most likely number of sources represented in a mixed sample.
Concurrently, the use of genetic markers, particularly allele frequency of microsatellite DNA and single-nucleotide polymorphism assays, have long been based on Bayesian methods and are pivotal in assessments of population structure, connectivity and dispersal in marine fish27,28. Overall, dispersal and reproductive movements play a key role in shaping genetic diversity, with many marine fish stocks being amalgamations of multiple geographic components29. Genetic heterogeneity implies limits in connectivity and reproductive movements, with spawning site fidelity over individual life time and over many generations increasing the potential for genetic variability among populations7,30. Overall, if we lack a clear understanding on genetic structure, life history diversity and the boundaries of biological populations, fisheries management initiatives will fail to protect discrete units or species’ biocomplexity, namely spawning habitats and potential local adaptations10,29.
Recently, there has been an increase in the application of multi-marker approaches to address population structure and connectivity in fish11,31,32. The rationale is that natural markers are generated by different biological processes and operate over different spatial and temporal resolutions. In particular, otolith chemistry provides demographic information over an individual’s life time whilst genetic markers resolve connectivity and population structure over generational or evolutionary time scales, depending on the rate of variation at given loci33–35. These complementary approaches encompass distinct ecological and evolutionary time scales and allow us to unravel individual or stochastic movements as well as to estimate long term population exchange rate and adaptation. In addition, combining them may allow us to overcome the potential limitations of single marker approaches. For example, the lack of spatial variation in otolith chemical composition may not necessarily imply that fish have a common source and may just reflect similar extrinsic and intrinsic factors. In these circumstances, genetic markers may potentially reveal population structuring. Nevertheless, the use of a single framework to truly integrate continuous (i.e. otolith chemistry) and categorical (i.e. genetic markers) data types is still rare36, and we should continue to strive to harness the full power of complementary and synergistic interdisciplinary approaches37,38.
Many commercially important fish species have large transboundary distributions throughout the northeast Atlantic, where waning recruitment and decreased spawning stock biomass have led to precautionary or emergency management measures39. Yet, for most marine species we lack baseline information on connectivity, relative importance of spawning grounds, or population structure and genetic differentiation on which to base management initiatives12. Here we use a Bayesian infinite mixture model to characterize population structure of a flatfish species, European flounder Platichthys flesus (L.), throughout the northeast Atlantic (Fig. 1) using the chemical composition of otolith near core regions (representing marine early life stages), whilst simultaneously characterizing the genetic connectivity of these populations. Specifically, we i) assessed the spatial separation of early life history stages, estimating the most likely number of source groups (natal origins) to the mixed populations based on otolith chemical composition and using a Bayesian infinite mixture model26; ii) examined the genetic differentiation of these populations using microsatellite DNA markers; and iii) evaluated the combined use of these two marker types with distinct ecological and evolutionary resolutions to support biologically defined management initiatives.
Figure 1.

Sampling areas of Platichthys flesus in the northeast Atlantic. Sampling areas and abbreviations are: NO – Norwegian coast, BAS – Baltic Swedish coast, BAP – Baltic Polish coast, NS – North Sea, BB – Bay of Biscay, GS – Galician shelf, PT – Portuguese coast. Map was generated using QGIS Version 2.16.279 and made with Natural Earth. Free vector and raster map data @ naturalearthdata.com. Countries vectorial layer version 3.1.0.
Results
The numbers of otolith (Noto = 102) and genetic samples (Ngen = 318) as well as the number of individuals used in the combined analysis (Ncombi = 99) per collection location are shown in Table 1.
Table 1.
Number of individuals of Platichthys flesus per sampled location in the northeast Atlantic Ocean and the Baltic Sea used for otolith chemistry (Noto), genetic diversity (Ngen) and combined marker (Ncombi) analyses.
| Location | Noto | Ngen | Ncombi |
|---|---|---|---|
| Norwegian coast (NO) | 10 | 28 | 10 |
| Baltic Swedish coast (BAS) | 13 | 42 | 13 |
| Baltic Polish coast (BAP) | 18 | 50 | 18 |
| North Sea (NS) | 17 | 50 | 17 |
| Bay of Biscay (BB) | 13 | 20 | 13 |
| Galician shelf (GS) | 13 | 61 | 12 |
| Portuguese coast (PT) | 18 | 67 | 16 |
Otolith chemistry
Spatial patterns were evident in the MDS based on otolith near core chemical composition, namely individuals collected in the Baltic Sea (Swedish and Polish coast) and the Norwegian coast were clearly segregated from each other and from the remaining samples. Otolith composition in fish from the remaining collection locations covering the North Sea, Bay of Biscay and the Atlantic Iberian Peninsula overlapped in multidimensional space, though with some evidence that individuals from the Bay of Biscay separated more from the remaining locations (Fig. 2).
Figure 2.
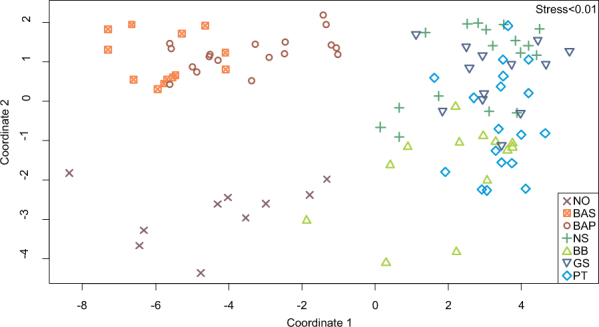
Multidimensional Scaling (MDS) plot based on otolith near core chemical composition of Platichthys flesus collected in seven areas along the northeast Atlantic Ocean and the Baltic Sea. Sampling areas and abbreviations are: NO – Norwegian coast, BAS – Baltic Swedish coast, BAP – Baltic Polish coast, NS – North Sea, BB – Bay of Biscay, GS – Galician shelf, PT – Portuguese coast.
Using the unconditional Bayesian mixture model approach on otolith near core chemical composition, two main clusters were identified (Fig. 3). The first cluster was comprised of individuals collected in the Baltic Sea (Swedish and Polish coasts) and the Norwegian coast, and the second of individuals from the remaining collection locations, though one individual from the Swedish coast was included. Within the first cluster, fish collected in the Norwegian coast waters were grouped together and were indicative of a single source area. For individuals collected from the Baltic Sea, there was some differentiation in the chemical composition of otolith near cores between the Polish and the Swedish coasts, although a few Polish samples were interspersed with Swedish samples. In general, otolith near core chemical composition showed no evidence of structuring from the North Sea to the Atlantic Iberian Peninsula as individuals from these areas were mixed within the second main cluster (Fig. 3).
Figure 3.

Circular tree of posterior co-assignment probabilities with individuals (abbreviations on tree leaves) grouped into potential sources from the infinite mixture model (unmixR) based on the near core chemical composition of Platichthys flesus. Most probable number of clusters K = 2. Sampling areas and abbreviations are: NO – Norwegian coast, BAS – Baltic Swedish coast, BAP – Baltic Polish coast, NS – North Sea, BB – Bay of Biscay, GS – Galician shelf, PT – Portuguese coast.
Microsatellite markers
Signs of null alleles were detected but only for limited situations across loci and populations. Significant null allele signature is related to heterozygote deficit and therefore to deviations from Hardy–Weinberg equilibrium (HWE). Deviations from HWE were only randomly significant in limited cases (Table 2). Thus, all loci were used in the analyses. Parameters of genetic diversity of P. flesus including the mean number of alleles per locus, expected heterozygosity (He) and mean allelic richness (AR) are summarized in Table 2. The within population genetic diversity was similar over the whole data set (0.52 < He < 0.61; 4.78 < AR < 5.59). Pairwise comparisons of genetic differentiation between populations (FST values) were significant with the exception of the Polish coast samples versus North Sea samples and the two most southern locations (Galician shelf and Portuguese coast), with the highest differentiation attained between the Swedish and the Portuguese coasts. (Table 3).
Table 2.
Measures of genetic diversity for 12 microsatellites of Platichthys flesus sampled in seven locations in the northeast Atlantic and the Baltic Sea.
| Location | NPlaf_08 | NPlaf_27 | NPlaf_35 | NPlaf_23 | NPlaf_15 | NPlaf_51 | NPlaf_33 | NPlaf_25 | NPlaf_24 | NPlaf_14 | NPlaf_30 | NPlaf_28 | Multilocus | |
|---|---|---|---|---|---|---|---|---|---|---|---|---|---|---|
| Norwegian coast | NA | 3 | 10 | 4 | 5 | 4 | 6 | 13 | 4 | 5 | 3 | 2 | 9 | 5.670 |
| (N = 28) | H o | 0.464 | 0.750 | 0.607 | 0.321* | 0.429 | 0.464* | 0.750 | 0.679 | 0.750 | 0.250 | 0.250 | 0.678 | 0.533 |
| H e | 0.447 | 0.775 | 0.590 | 0.465 | 0.372 | 0.693 | 0.823 | 0.647 | 0.682 | 0.312 | 0.223 | 0.695 | 0.561 | |
| F IS | −0.040 | 0.034 | −0.029 | 0.314 | 0.155 | 0.334 | 0.090 | −0.049 | −0.101 | 0.203 | −0.125 | 0.025 | — | |
| AR | 2.991 | 8.867 | 3.871 | 4.571 | 3.896 | 5.479 | 10.841 | 3.679 | 4.579 | 2.970 | 1.999 | 7.585 | 5.110 | |
| Baltic Swedish coast | NA | 4 | 13 | 5 | 4 | 4 | 7 | 11 | 4 | 5 | 3 | 1 | 6 | 5.580 |
| (N = 42) | H o | 0.214 | 0.816*** | 0.684** | 0.317 | 0.512 | 0.685 | 0.795 | 0.619 | 0.625 | 0.381 | — | 0.615 | 0.522 |
| H e | 0.258 | 0.757 | 0.679 | 0.325 | 0.476 | 0.675 | 0.722 | 0.535 | 0.638 | 0.492 | — | 0.663 | 0.518 | |
| F IS | 0.171 | −0.079 | −0.008 | 0.024 | −0.077 | −0.015 | −0.102 | −0.159 | 0.021 | 0.228 | — | 0.073 | — | |
| AR | 3.287 | 9.627 | 4.912 | 3.862 | 3.978 | 5.861 | 8.537 | 3.976 | 3.949 | 2.989 | 1 | 5.327 | 4.780 | |
| Baltic Polish coast | NA | 6 | 10 | 6 | 5 | 5 | 6 | 19 | 4 | 8 | 3 | 4 | 9 | 7.080 |
| (N = 50) | H o | 0.460** | 0.673*** | 0.720 | 0.580 | 0.367 | 0.740 | 0.920 | 0.580 | 0.660 | 0.200 | 0.280 | 0.640 | 0.568 |
| H e | 0.521 | 0.819 | 0.707 | 0.534 | 0.468 | 0.711 | 0.872 | 0.699 | 0.647 | 0.246 | 0.250 | 0.674 | 0.595 | |
| F IS | 0.118 | 0.179 | −0.019 | −0.088 | 0.217 | −0.041 | −0.056 | 0.172 | −0.121 | 0.188 | −0.120 | 0.051 | — | |
| AR | 4.374 | 8.409 | 4.753 | 3.674 | 4.347 | 4.912 | 13.777 | 3.948 | 5.950 | 2.378 | 2.994 | 7.193 | 5.560 | |
| North Sea | NA | 4 | 10 | 4 | 6 | 5 | 7 | 21 | 6 | 6 | 5 | 4 | 9 | 7.250 |
| (N = 50) | H o | 0.340 | 0.660 | 0.563 | 0.540 | 0.560 | 0.560 | 0.755 | 0.667* | 0.638 | 0.271 | 0.480 | 0.739 | 0.564 |
| H e | 0.397 | 0.818 | 0.649 | 0.509 | 0.615 | 0.645 | 0.846 | 0.676 | 0.649 | 0.364 | 0.395 | 0.778 | 0.612 | |
| F IS | 0.146 | 0.196 | 0.136 | −0.016 | 0.090 | 0.133 | 0.108 | 0.014 | 0.016 | 0.259 | −0.218 | 0.051 | — | |
| AR | 3.361 | 8.022 | 3.396 | 3.998 | 4.613 | 5.217 | 13.051 | 4.789 | 4.841 | 3.576 | 3.623 | 7.684 | 5.510 | |
| Bay of Biscay | NA | 4 | 8 | 5 | 3 | 4 | 5 | 15 | 4 | 6 | 3 | 3 | 7 | 5.580 |
| (N = 20) | H o | 0.600 | 0.842 | 0.700 | 0.300 | 0.600 | 0.600 | 0.789 | 0.600 | 0.684 | 0.400 | 0.400 | 0.421*** | 0.578 |
| H e | 0.491 | 0.832 | 0.723 | 0.349 | 0.481 | 0.690 | 0.888 | 0.643 | 0.574 | 0.396 | 0.343 | 0.777 | 0.599 | |
| F IS | −0.229 | −0.012 | 0.033 | 0.143 | −0.256 | 0.133 | 0.133 | 0.069 | −0.197 | −0.010 | −0.169 | 0.465 | — | |
| AR | 3.949 | 8.000 | 4.999 | 3.000 | 3.950 | 4.900 | 15.000 | 4.000 | 6.000 | 2.950 | 2.999 | 7.000 | 5.560 | |
| Galician shelf | NA | 4 | 11 | 5 | 6 | 4 | 6 | 14 | 6 | 13 | 5 | 5 | 8 | 7.250 |
| (N = 61) | H o | 0.377 | 0.517*** | 0.720*** | 0.589 | 0.343 | 0.596 | 0.775 | 0.379 | 0.537 | 0.298*** | 0.241*** | 0.384*** | 0.480 |
| H e | 0.415 | 0.817 | 0.552 | 0.603 | 0.408 | 0.682 | 0.798 | 0.385 | 0.632 | 0.399 | 0.314 | 0.720 | 0.561 | |
| F IS | 0.092 | 0.371 | −0.308 | 0.023 | 0.161 | 0.128 | 0.030 | 0.015 | 0.152 | 0.255 | 0.233 | 0.468 | — | |
| AR | 3.343 | 9.146 | 3.617 | 4.647 | 3.787 | 5.590 | 10.326 | 4.422 | 8.134 | 3.822 | 3.575 | 6.609 | 5.590 | |
| Portuguese coast | NA | 5 | 11 | 5 | 5 | 4 | 6 | 16 | 5 | 8 | 2 | 2 | 8 | 6.420 |
| (N = 67) | 0.552 | 0.734 | 0.719 | 0.567 | 0.373 | 0.600 | 0.778* | 0.439 | 0.454 | 0.242 | 0.409 | 0.642 | 0.542 | |
| H o | 0.495 | 0.773 | 0.724 | 0.628 | 0.344 | 0.673 | 0.725 | 0.463 | 0.436 | 0.259 | 0.328 | 0.733 | 0.549 | |
| F IS | −0.116 | 0.050 | 0.008 | 0.098 | −0.084 | 0.109 | −0.073 | 0.052 | −0.042 | 0.065 | −0.250 | 0.126 | — | |
| AR | 4.110 | 8.029 | 4.506 | 4.403 | 3.237 | 5.391 | 8.728 | 4.028 | 5.438 | 1.999 | 2.000 | 6.410 | 4.860 | |
| All | NA | 7 | 19 | 7 | 11 | 5 | 10 | 28 | 7 | 15 | 7 | 12 | 17 |
Number of alleles per locus (NA), observed heterozygosity (Ho) with significance of its departure from the Hardy–Weinberg Equilibrium (*p < 0.05; **p < 0.01; ***p < 0.001), unbiased expected heterozygosity (He), fixation index (FIS) and mean allelic richness (AR), N = sample size.
Table 3.
Pairwise comparisons of FST values between populations of Platichthys flesus collected in the northeast Atlantic and the Baltic Sea (*p < 0.05; ***p < 0.001, NS – not significant).
| NO | BAS | BAP | NS | BB | GS | PT | |
|---|---|---|---|---|---|---|---|
| BAS | 0.071*** | — | |||||
| BAP | 0.037*** | 0.068*** | — | ||||
| NS | 0.042*** | 0.038*** | 0.010NS | — | |||
| BB | 0.029* | 0.032*** | 0.039*** | 0.020* | — | ||
| GS | 0.074*** | 0.068*** | 0.067*** | 0.037*** | 0.040*** | — | |
| PT | 0.082*** | 0.091*** | 0.088*** | 0.059*** | 0.041*** | 0.036NS | — |
Bonferroni correction was used to adjust p-value significance. Sampling areas and abbreviations are: NO – Norwegian coast, BAS – Baltic Swedish coast, BAP – Baltic Polish coast, NS – North Sea, BB – Bay of Biscay, GS – Galician shelf, PT – Portuguese coast.
We found a significant isolation by distance (IBD) pattern for P. flesus in the northeast Atlantic (r = 0.7391, p < 0.01), and results of PCoA reflected a North-South cline along the first axis, while the second axis clearly separated the two locations within the Baltic Sea (Swedish and Polish coasts). Considering both axes of the PCoA, samples from the Norwegian coast were clustered near the Polish coast and the North Sea (Fig. 4). Furthermore, assignment results of the Bayesian clustering performed in STRUCTURE indicated K = 2 as the most probable number of clusters (Fig. 5). Specifically, individuals from the peripheral and southernmost collection locations (Galician shelf and Portuguese coast) were mostly assigned to the same cluster whilst the remaining locations were included in the other cluster, though high admixture rates were observed in the Norwegian coast and the Bay of Biscay. The latter is a transition area composed of individuals with affinities to both clusters, and although increased admixture in Norway could suggest a third cluster, STRUCTURE results did not support this. Overall, FST, PCoA and STRUCTURE were indicative of two main regional clusters formed by the southernmost locations (Galician shelf and Portuguese coast) and the more central locations (Bay of Biscay, North Sea and Polish coast), yet they also highlighted increased differentiation of individuals from Norway and the Swedish Coast.
Figure 4.
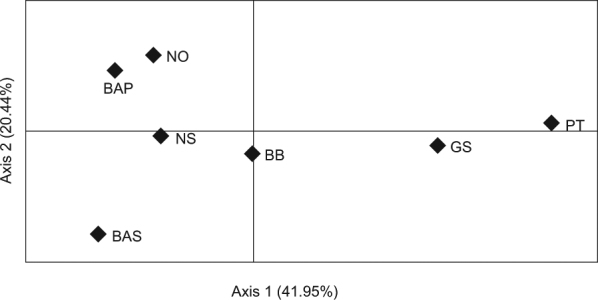
Principal coordinates analysis plot (PCoA) based on 12 microsatellite DNA markers of Platichthys flesus along the northeast Atlantic Ocean and the Baltic Sea. Percentage of variation explained by each axis is shown, and sampling areas and abbreviations are: NO – Norwegian coast, BAS – Baltic Swedish coast, BAP – Baltic Polish coast, NS – North Sea, BB – Bay of Biscay, GS – Galician shelf, PT – Portuguese coast.
Figure 5.

Individual assignment probability based on Bayesian clustering method from STRUCTURE using 12 microsatellite DNA markers. Each bar represents an individual of Platichthys flesus with its probability of membership to one of the hypothetical clusters (K = 2). Sampling areas and abbreviations are: NO – Norwegian coast, BAS – Baltic Swedish coast, BAP – Baltic Polish coast, NS – North Sea, BB – Bay of Biscay, GS – Galician shelf, PT – Portuguese coast.
Chemical and genetic marker integration
The combination of results from individual otolith and genetic markers increased the spatial differentiation among locations. The three-dimensional graphical approach highlighted how genetic data contributed to the separation of the central and southern populations of the northeast Atlantic whilst otolith chemical data were more important for disentangling the genetically homogeneous northern locations (Fig. 6). The clear separation between both locations in the Baltic Sea and the Norwegian coast was supported by otolith chemical composition since genetic microsatellite markers were unable to differentiate among these northern locations. Contrastingly, central and southern locations, which otolith chemistry had been unable to separate, were more segregated in the combined approach because of the genetic differentiation of the most southern locations (Galician shelf and Portuguese coast). Overall, integrated marker results suggest the existence of four main groups, namely the Norwegian coast, the Baltic Sea, the North Sea together with the Bay of Biscay, and the Galician shelf together with the Portuguese coast.
Figure 6.
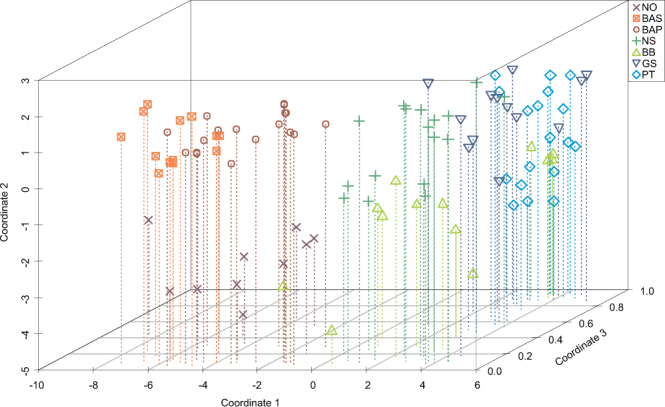
Three-dimensional scatterplot combining the MDS matrix scores from individual otolith data (Coordinates 1 and 2) and the probability of each individual of Platichthys flesus belonging to one of the hypothetical clusters in STRUCTURE (Coordinate 3). Sampling areas and abbreviations are: NO – Norwegian coast, BAS – Baltic Swedish coast, BAP – Baltic Polish coast, NS – North Sea, BB – Bay of Biscay, GS – Galician shelf, PT – Portuguese coast.
Discussion
The application of different statistical approaches that tackle uncertainty and incomplete baseline data is required to resolve connectivity patterns of commercially exploited marine fish species with large contiguous geographical distributions. Here we applied an infinite Bayesian mixture model to otolith chemical data of P. flesus collected throughout the northeast Atlantic. Furthermore, we added information from microsatellite DNA markers to otolith chemical data, thus combining two different natural markers with distinct ecological and evolutionary perspectives to increase the likelihood of accurately depicting this species’ population connectivity11,13,40.
The infinite mixture model successfully differentiated source groups within our otolith near core chemical data, and in general there was an alignment between these results and the MDS used to visualize data. One of the advantages of the infinite mixture model is that the most probable number of sources is inferred by the algorithm whereas in MDS the identification or separation of groups can be subjective. A clear separation of early life history stages among populations from the Norwegian coast and the Baltic Sea was evident. Individuals from the remaining locations had otolith near core chemical signatures that were not sufficiently differentiated to separate source groups. Identifying the number of sources contributing to a mixed population is a difficult task at best, and in reality likely dependent on the dimensionality of the data and how source groups are segregated in multivariate space26,41. Our results represent a first attempt toward this end but in future studies the number of samples to best evaluate population structure of this species using otolith chemistry should be increased. In particular, as in infinite mixture models the number of individual samples needs to increase exponentially with an increasing number of anticipated group signatures26.
Regarding otolith chemistry of P. flesus, no latitudinal gradient was detected from the North Sea to the Iberian Peninsula. Otolith near core chemical composition of individuals collected along the Norwegian coast and the Baltic Sea were clearly differentiated. Although otolith chemistry has been shown to be influenced by physiology and genetics18,19,21, environmental factors are still considered the main drivers of variation for certain elements (e.g. Sr, Ba, δ18O)42,43. In addition to water chemical composition, temperature and salinity may play an important role in the differentiation of the chemical composition of the individuals collected in the two locations within the Baltic Sea and in the northernmost collection site (Norwegian coast). The Baltic Sea is a large brackish water body characterized by strong vertical and horizontal salinity gradients. These gradients are clearly reflected in dissolved inorganic carbon (δ13CDIC) and water δ18O, with more depleted values in low salinity areas44 and thus in otoliths43,45. Furthermore, otolith chemical studies in the Baltic have shown increased Mn:Ca values due to hypoxia46,47. These physico-chemical properties partly contributed to the differentiation of source areas of individuals collected in the Baltic Sea. Similarly, the distinctive otolith chemical composition of individuals from the Norwegian coast is potentially related to lower temperature of this area compared with the remaining collection locations, and varying salinity due to estuarine-like conditions that result from the intricate system of fjords48.
Spawning of P. flesus occurs offshore, and this likely contributed to our inability to differentiate otolith near core compositions of individuals collected from the North Sea to the Iberian Peninsula as the physico-chemical properties of the marine environments in these regions are homogeneous in comparison to near- and inshore environments (e.g. estuaries)49,50. Most of the studies attempting to resolve population structure in marine fish species have overlooked the effects of physiology and genetics which can contribute to variations in otolith chemistry and to the success in identifying collection locations in marine environments19,21. One key aspect to continue to pursue is identifying other elemental and isotopic markers that may enable the differentiation of locations in marine environments using otolith chemistry. Nevertheless, the possibility of a single source seeding the area from the North Sea to Portuguese waters is highly unlikely and the results of microsatellite DNA markers indicated population structuring in this area. Pelagic larval duration of P. flesus (25–35 days51) allows potential large scale dispersal of early life stages and mixing of contributing sources, yet oceanographic and topographic features may conduce to higher retention rates of early life stages (e.g. Skagerrak Strait, Iberian upwelling system). Overall, connectivity in marine fish cannot be readily predicted from early life history traits and dispersal potential as multiple biophysical processes are involved in shaping connectivity patterns52.
Complementary to the otolith chemical markers, microsatellite DNA markers highlighted a genetic split between the Bay of Biscay and the Iberian Peninsula, and in general genetic differentiation followed a latitudinal gradient. Calvès, et al.53 already showed genetic differentiation between P. flesus populations from the Mondego estuary (Portugal) and estuaries along the English Channel. In fact, the Portuguese coast is acknowledged as the southern limit of distribution of P. flesus54, and there is likely a combination of adaptive processes to increased temperature and reduced gene flow taking place here due to its peripheral geographic location55. Regarding the Norwegian coast, though otolith chemistry suggests this was a well separated source group, additional genetic markers and samples are necessary to substantiate potential genetic divergence of this population. A further spatially saturated sampling design will aid in disentangling the location of the genetic split towards the Iberian populations, and could simultaneously contribute to better understanding the genetic structure of P. flesus populations at its northern distribution limit. On the other hand, it is well documented that P. flesus has distinct pelagic and demersal spawning behaviours in the Baltic Sea, and this likely explains the genetic differentiation observed between the two geographically close populations56,57.
The combined analysis of otolith chemical and genetic markers on the same individuals increases the likelihood of correctly characterizing population connectivity, as they reflect ecological and evolutionary processes16,38,58. An integrated approach should provide more robust conclusions regarding population identity, and this was manifest in our results, as markers provided complementary perspectives on P. flesus population structure. Both markers showed differentiation among northern and Baltic populations. However, otolith chemistry was more successful in identifying different source groups in these northern areas, whilst only microsatellite DNA markers detected population structuring towards the southern limit of P. flesus distribution. Considering the different nature of demographic and genetic markers, reconciling contrasting connectivity patterns can be highly informative16,32,59, whilst disregarding information from one of them can lead to misconceptions in fish population connectivity. Therefore, synthesizing data from a suite of markers and compiling congruent information at different spatio-temporal scales is the best practice to provide robust information to define and support actions and decisions in fisheries and conservation10,12,13.
Despite the increased recognition of the importance of conducting multidisciplinary population assessments based on the consensus and complementarity of multiple markers37, we have yet to establish a common statistical approach that can adequately resolve the limitations associated with the different nature of the data obtained from distinct markers. Specifically, one of the main hurdles to overcome is combining the categorical data from genetic markers with the continuous data from most other markers (e.g. otolith chemistry, morphometrics)13. On the other hand, Bayesian approaches dealing with probabilities are able to define realistic models that incorporate uncertainty at various levels26,36,60, and handle scenarios with unknown sources to a mixed population26, as seen here with the infinite mixture model. To date, studies have combined the information resulting from independent analysis of different datasets31, synthesized multiple marker information in quantitative or qualitative indices32, and developed approaches that allow integration in specific contexts or add information in a priori classification-based methods11. To our knowledge, only one study has taken full advantage of the available information by effectively integrating otolith chemistry and genetic markers to determine the proportion of groups of origin in a mixed population of Atlantic cod36. Adapting Bayesian infinite mixture models to adequately accommodate different data types will contribute towards integration of multiple marker data, and represent a breakthrough in ascertaining the biological boundaries among populations or the sources contributing to mixed populations.
Characterizing the biocomplexity of fish species that span large spatial ranges is critical to avoid mismatches between management and biological units. Here, we showed how the complementary use of two markers with distinct ecological and evolutionary resolutions can enhance our perspective of population connectivity. Results highlighted how single marker approaches may lead to the misinterpretation of a species’ population structure. Overall, disregarding demographic and genetic connectivity in management decisions will have significant ecological and economic consequences, particularly in the current context of general over exploitation of fisheries resources.
Materials and Methods
Sample collection and preparation
European flounder Platichthys flesus (L.) has a complex life cycle with adults spawning at sea whilst juveniles use nearshore to inshore environments with large-scale movements between the different habitats15. A total of 318 individuals of P. flesus [mean (and standard deviation) of fish total length: 292 (56) mm] were obtained between 2012 and 2014 directly from commercial fishers and research surveys at locations throughout the northeast Atlantic Ocean, including the Baltic Sea (Fig. 1). Collection locations covered the species distribution range and included the Norwegian coast, Swedish coast, Polish coast, North Sea, Bay of Biscay, Galician shelf, and the Portuguese coast, where the species southern limit of distribution occurs54. Individual fin tissue clips (ca. 1 cm2) were removed and stored in 100% ethanol for genetic analysis (N of individuals analysed for genetic markers = 318, Table 1). Sagittal otoliths were extracted, washed and cleaned of adhering tissues and stored dry in microcentrifuge tubes until further processing. Whole otoliths were immersed in ultrapure water and aged using a binocular stereoscope to ensure all fish used for otolith chemical analysis were spawned in the same year and limit the potential effect of temporal variation on otolith chemical composition61,62. Only otoliths of individuals matching the 2009 cohort/birth year (ages 3 to 5) were selected (N of individuals analysed for otolith markers = 102, Table 1). No live animals were used in this study and no specific permissions were needed for the sampling as the species is commercially harvested (not endangered nor protected) and specimens were caught in areas where fishing is allowed.
Otolith chemistry analysis
Otolith preparation and chemical analysis followed Tanner, et al.50. Briefly, for elemental analysis eye side (right) otoliths were ground to the midplane using lapping paper (30 µm and 3 µm) until the core was exposed. In a class-100 clean room, otoliths were immersed in ultrapure water, sonicated for 3 min, triple rinsed with ultrapure water, and then mounted on new glass slides in random sets of 30 using double sided tape. All glass and plasticware used for otolith processing were previously decontaminated in a 10% nitric acid (HNO3) wash for 24 h, rinsed with ultrapure water and dried in a laminar flow positive pressure fume hood.
Otolith elemental ratios were quantified by measuring 25Mg, 48Ca, 55Mn, 88Sr, and 138Ba on a Thermo Finnigan Element2 single collector inductively coupled plasma mass spectrometer (ICP-MS) coupled to a New Wave 193 nm excimer laser ablation system. 450 µm long rasters with a 30 µm beam diameter were ablated in the near core region, corresponding to the marine larval life history stage. Ablated material was transported via a He gas stream to the dual-inlet quartz spray chamber and mixed with a 2% HNO3 aerosol from a self-aspirating PFA 20 μl min−1 nebulizer. Resulting analyte was transported to the ICP-MS via an Ar carrier gas. Instrumental blanks (2% HNO3) were run at the beginning and end of each set of 10 otoliths. Blank correction of all measured raw values was done by calculating a blank value for each sample by linear interpolation of the measured blanks. A dissolved otolith certified reference material (CRM)63 at Ca concentration of 40 μg g−1 was used to correct for instrument mass bias. Instrument precision was assessed by running another CRM64, dissolved and diluted to a Ca concentration of 40 μg g−1. External precision (relative standard deviation) for this CRM (n = 46) was as follows: Mg:Ca = 0.59%, Mn:Ca = 14.30%, Sr:Ca = 0.51%, and Ba:Ca = 1.29%. All otolith elemental concentration data were converted to element:Ca ratios.
For stable isotope analysis of δ13C and δ18O, blind side (left) otoliths were ground to the midplane using lapping paper (30 µm and 3 µm) until the core region began to be exposed. A computer-controlled micromill (ESI New Wave Research Micromill) was used to extract otolith material from the near core area using the same sized rasters as for elemental analysis (drilling depth 100 µm) until c. 50 µg of otolith material was obtained taking into account the circular structure of otoliths. Thus, otolith material for isotopic analysis represents the same time period as that targeted in the right otolith for elemental analysis. Samples were analyzed on a Thermo Scientific MAT 253 isotope ratio mass spectrometer (IRMS) with dual inlet coupled to a Kiel IV device for automated sample preparation following standard methods65. Isotopic values were reported relative to Vienna Pee Dee belemnite (VPDB) and expressed in standard δ notation. Long term analytical uncertainties for δ13C and δ18O based on repeat measurements of NBS-19 certified reference material are 0.04‰ and 0.06‰, respectively.
Otolith chemistry data analysis
As there is no prior information regarding potential spawning grounds and larval distributions for P. flesus throughout the northeast Atlantic, only unconstrained statistical methods were used when assessing near core chemical composition. When sources in mixed samples are uncertain, identifying the origin of individuals becomes a difficult statistical problem as any classification will be biased a priori by the exclusion of potential sources26. We used multidimensional scaling (MDS) analysis to visualize data in reduced space and examine the occurrence of potential groupings, using Vegan package in R. Second, we adapted the unconditional Bayesian mixture model approach (PopR package, https://github.com/Philipp-Neubauer/PopR) from Neubauer, et al.26. This approach implements a Dirichlet process mixture that allows unknown (infinite) sources and estimates the most likely number of sources represented in a mixed sample. However, the core functions of PopR are implemented in Julia, which brings gains in computation time but opens up a number of issues. In particular, Julia is a recent programming language and is still being actively developed rendering its functionality and synchronization with R unstable. Thus, to address these issues, the unmixR package was developed translating and updating all of PopR’s Julia components to C++, making extensive use of the Rcpp and RcppArmadillo packages. This removed the need for an external interpreter and the creation of intermediate files (unmixR package, https://github.com/zeloff/unmixR). No changes were made to the original PopR algorithms.
Preliminary analysis of the otolith chemical data indicated that best results were obtained by using both elemental and isotopic variables therefore the full set of variables was used for subsequent analyses. All data treatment and statistical analyses were made in R66. Simulation parameters for the unmixR analysis were 2000 iterations and thinning was set to 1.
Microsatellite markers and genotyping
Total genomic DNA was extracted from fin clips using a standard phenol-chloroform extraction protocol67. Twelve microsatellites (Nplaf8, Nplaf14, Nplaf15, Nplaf23, Nplaf24, Nplaf25, Nplaf27, Nplaf28, Nplaf30, Npalf33, Npal35, Nplaf51) were grouped into 3 multiplex PCR and genotyping groups68. PCR reactions were run with the Type-it Microsatellite PCR Kit (Qiagen TM) containing 5 µl of Master Mix, 1 µl Q-solution, 2 µl RNase-free water, 1 µl of primer mix and 1 µl genomic DNA (c. 50 ng). Amplification conditions were: 95 °C for 10 min followed by 40 cycles of 95 °C for 30 s, 55 °C for 30 s and 72 °C for 1 min and an extension step of 10 min at 72 °C68.
Samples were genotyped in an ABI PRISM 310 Genetic Analyzer and fragments were sized with GeneScan-500 LIZ Size Standard using GeneMapper 3.7 (Applied Biosystems), and blindly scored by at least two readers to minimize genotyping errors.
Microsatellite markers data analysis
Microsatellite loci were first tested for the presence of null alleles and genotyping errors like null alleles, stuttering and large allele dropout using MICRO-CHECKER 2.2.369. Genetic diversity was measured as the mean allelic richness (AR) calculated and corrected for sample size by rarefaction using HP-Rare70; observed heterozygosity (Ho), unbiased expected heterozygosity (He)71 both per loci and multilocus, mean number of alleles across loci (NA) using ARLEQUIN 3.1172; and fixation index within samples (FIS), inferred using GENETIX 4.05.273. Deviations from HWE and linkage disequilibrium were tested using ARLEQUIN per locus and Genepop 3.174 for all loci, using 100 000 Markov chain and 1000 dememorization steps. ARLEQUIN software was also used to calculate population differentiation through pairwise comparisons of FST (fixation index between samples and 100 000 steps for Exact tests) and p-value significance was assumed using the Bonferroni correction for multiple comparison tests.
Isolation by distance (IBD) was tested by comparing pairwise FST values against the shortest waterway distance between collection locations of P. flesus using a Mantel-test implemented in the Vegan package in R. Statistical significance was assessed with 1000 permutations of the data.
Patterns of differentiation were visualized by principal coordinates analysis (PCoA), a multivariate technique that allows major patterns within a multivariate dataset of multiple loci and samples to be discerned. This analysis was computed using GenAlEx 6.575.
A Bayesian clustering method (STRUCTURE 2.3.4)76 was used to infer possible genetic clusters, with parameters of 1000000 Monte Carlo Markov Chain interactions following a burn-in period of 1000000 for K = 1–7, as number of tested clusters, and replicated 20 times. Evanno’s index AK77 was evaluated using STRUCTURE HARVESTER 0.6.9378.
Integrating genetic and chemical markers
Due to the differing nature of otolith chemistry data and genetic data, a straightforward integration of the datasets is challenging11,36. The potential benefits of integrating the two markers were evaluated graphically with a three-dimensional scatterplot combining the probability of each individual belonging to one of the identified genetic clusters and the MDS matrix scores from individual otolith data. Thus, the data used for each individual originated from the results obtained using the full data sets for each marker. One advantage of this integrated graphical approach relies on the combination of results from continuous and categorical data without requiring re-analysis of the data.
Data availability
The datasets generated and/or analysed during the current study are available from the corresponding author on reasonable request.
Acknowledgements
The authors wish to thank all who donated samples and were involved in sampling and fish collection, in particular Audrey Geffen, Zuzanna Mirny, Ann-Britt Florin, Peter Wright, Jan Jaap Poos, Gianna Fabi and Efe Uluturk. We also thank José Loff (phiStat, Statistical Consulting) for his contributions to the development of the unmixR package and Niall Slowey for the isotopic analysis. We would also like to thank the two reviewers for their input to improve previous versions of this manuscript. This study had the support of the Fundação para a Ciência e a Tecnologia (FCT) via UID/MAR/04292/2013, PTDC/AAG-GLO/5849/2014 and PTDC/MAR-EST/2098/2014. PRS and SET were funded with FCT postdoctoral grants (SFRH/BPD/95784/2013 and SFRH/BPD/84278/2012, respectively), and RPV via the Investigador FCT Programme 2013 (IF/00058/2013) and the “Programa Nacional de Amostragem Biológica” (Data Collection Framework, namely for the fisheries sector). The production of genetic data was supported by the “Laboratoire d’Excellence” LabexMER (ANR-10-LABX-19), the “Région Bretagne” and the “Institution d’Aménagement de la Vilaine” (IAV, La Roche Bernard).
Author Contributions
P.R.S. and S.E.T. wrote the main manuscript, based on ideas conceived by P.R.S., S.E.T., R.P.V., and H.C. P.R.S., S.E.T., M.A.A., G.C. performed the chemical and genetic analysis, and analysed the respective data sets. M.A.A., R.P.V., J.L., G.C., M.P., P.P., B.M.G. and H.C. discussed ideas and carefully reviewed this manuscript.
Competing Interests
The authors declare no competing interests.
Footnotes
Patrick Reis-Santos and Susanne E. Tanner contributed equally to this work.
Publisher's note: Springer Nature remains neutral with regard to jurisdictional claims in published maps and institutional affiliations.
References
- 1.Cowen RK, Paris CB, Srinivasan A. Scaling of connectivity in marine populations. Science. 2006;311:522–527. doi: 10.1126/science.1122039. [DOI] [PubMed] [Google Scholar]
- 2.Thorrold SR, Latkoczy C, Swart PK, Jones CM. Natal homing in marine fish metapopulation. Science. 2001;291:297–299. doi: 10.1126/science.291.5502.297. [DOI] [PubMed] [Google Scholar]
- 3.Nathan R, et al. A movement ecology paradigm for unifying organismal movement research. Proc Natl Acad Sci USA. 2008;105:19052–19059. doi: 10.1073/pnas.0800375105. [DOI] [PMC free article] [PubMed] [Google Scholar]
- 4.Palumbi SR. Population genetics, demographic connectivity, and the design of marine reserves. Ecol Appl. 2003;13:S146–S158. doi: 10.1890/1051-0761(2003)013[0146:PGDCAT]2.0.CO;2. [DOI] [Google Scholar]
- 5.Cure K, Thomas L, Hobbs JA, Fairclough DV, Kennington WJ. Genomic signatures of local adaptation reveal source-sink dynamics in a high gene flow fish species. Sci Rep. 2017;7:8618. doi: 10.1038/s41598-017-09224-y. [DOI] [PMC free article] [PubMed] [Google Scholar]
- 6.Papetti C, et al. Single population and common natal origin for Adriatic Scomber scombrus stocks: evidence from an integrated approach. ICES J Mar Sci. 2013;70:387–398. doi: 10.1093/icesjms/fss201. [DOI] [Google Scholar]
- 7.Ruzzante DE, et al. Biocomplexity in a highly migratory pelagic marine fish, Atlantic herring. Proc R Soc B. 2006;273:1459–1464. doi: 10.1098/rspb.2005.3463. [DOI] [PMC free article] [PubMed] [Google Scholar]
- 8.Grewe PM, et al. Evidence of discrete yellowfin tuna (Thunnus albacares) populations demands rethink of management for this globally important resource. Sci Rep. 2015;5:16916. doi: 10.1038/srep16916. [DOI] [PMC free article] [PubMed] [Google Scholar]
- 9.Rooker JR, et al. Natal homing and connectivity in Atlantic bluefin tuna populations. Science. 2008;322:742–744. doi: 10.1126/science.1161473. [DOI] [PubMed] [Google Scholar]
- 10.Reiss H, Hoarau G, Dickey-Collas M, Wolff WJ. Genetic population structure of marine fish: mismatch between biological and fisheries management units. Fish Fish. 2009;10:361–395. doi: 10.1111/j.1467-2979.2008.00324.x. [DOI] [Google Scholar]
- 11.Tanner SE, Pérez M, Presa P, Thorrold SR, Cabral HN. Integrating microsatellite DNA markers and otolith geochemistry to assess population structure of European hake (Merluccius merluccius) Estuar Coast Shelf Sci. 2014;142:68–75. doi: 10.1016/j.ecss.2014.03.010. [DOI] [Google Scholar]
- 12.Kerr, L. A. et al. Lessons learned from practical approaches to reconcile mismatches between biological population structure and stock units of marine fish. ICESJournalofMarineScience:JournalduConseil, fsw188 (2016).
- 13.Cadrin, S. X., Kerr, L. A. & Mariani, S. In Stock Identification Methods (Second Edition) 535–552 (Academic Press, 2014).
- 14.Gillanders, B. M. in Ecological Connectivity among Tropical Coastal Ecosystems (ed. Nagelkerken, I.) 457–492 (Springer, 2009).
- 15.Reis-Santos P, et al. Connectivity between estuarine and coastal fish populations: contributions of estuaries are not consistent over time. Mar Ecol Prog Ser. 2013;491:177–186. doi: 10.3354/meps10458. [DOI] [Google Scholar]
- 16.Tanner SE, Reis-Santos P, Cabral HN. Otolith chemistry in stock delineation: A brief overview, current challenges and future prospects. Fish Res. 2016;173:206–213. doi: 10.1016/j.fishres.2015.07.019. [DOI] [Google Scholar]
- 17.Campana SE. Chemistry and composition of fish otoliths: pathways, mechanisms and applications. Mar Ecol Prog Ser. 1999;188:263–297. doi: 10.3354/meps188263. [DOI] [Google Scholar]
- 18.Sturrock AM, et al. Physiological influences can outweigh environmental signals in otolith microchemistry research. Mar Ecol Prog Ser. 2014;500:245–264. doi: 10.3354/meps10699. [DOI] [Google Scholar]
- 19.Clarke LM, Thorrold SR, Conover DO. Population differences in otolith chemistry have a genetic basis in Menidia menidia. Can J Fish Aquat Sci. 2011;68:105–114. doi: 10.1139/F10-147. [DOI] [Google Scholar]
- 20.Izzo, C., Reis-Santos, P. & Gillanders, B. M. Otolith chemistry does not just reflect environmental conditions: A meta-analytic evaluation. Fish Fish (2018).
- 21.Sturrock, A. M. et al. Quantifying physiological influences on otolith microchemistry. Methods Ecol Evol 6, 806-816 (2015).
- 22.Gillanders BM. Connectivity between juvenile and adult fish populations: do adults remain near their recruitment estuaries? Mar Ecol Prog Ser. 2002;240:215–223. doi: 10.3354/meps240215. [DOI] [Google Scholar]
- 23.Chittaro PM, Finley RJ, Levin PS. Spatial and temporal patterns in the contribution of fish from their nursery habitats. Oecologia. 2009;160:49–61. doi: 10.1007/s00442-009-1282-4. [DOI] [PubMed] [Google Scholar]
- 24.Tournois J, et al. Lagoon nurseries make a major contribution to adult populations of a highly prized coastal fish. Limnol Oceanogr. 2017;62:1219–1233. doi: 10.1002/lno.10496. [DOI] [Google Scholar]
- 25.Hamer PA, Jenkins GP, Gillanders BM. Chemical tags in otoliths indicate the importance of local and distant settlement areas to populations of a temperate sparid. Pagrus auratus. Can J Fish Aquat Sci. 2005;62:623–630. doi: 10.1139/f04-221. [DOI] [Google Scholar]
- 26.Neubauer P, Shima JS. & Swearer, S. E. Inferring dispersal and migrations from incomplete geochemical baselines: analysis of population structure using Bayesian infinite mixturemodels. Methods Ecol Evol. 2013;4:836–845. doi: 10.1111/2041-210X.12076. [DOI] [Google Scholar]
- 27.Planes S, Jones GP, Thorrold SR. Larval dispersal connects fish populations in a network of marine protected areas. Proc Natl Acad Sci USA. 2009;106:5693–5697. doi: 10.1073/pnas.0808007106. [DOI] [PMC free article] [PubMed] [Google Scholar]
- 28.Bonanomi S, et al. Historical DNA documents long-distance natal homing in marine fish. Mol Ecol. 2016;25:2727–2734. doi: 10.1111/mec.13580. [DOI] [PubMed] [Google Scholar]
- 29.Hilborn R, Quinn TP, Schindler DE, Rogers DE. Biocomplexity and fisheries sustainability. Proc Natl Acad Sci USA. 2003;100:6564–6568. doi: 10.1073/pnas.1037274100. [DOI] [PMC free article] [PubMed] [Google Scholar]
- 30.Doyle TK, Haberlin D, Clohessy J, Bennison A, Jessopp M. Localised residency and inter-annual fidelity to coastal foraging areas may place sea bass at risk to local depletion. Sci Rep. 2017;8:45841. doi: 10.1038/srep45841. [DOI] [PMC free article] [PubMed] [Google Scholar]
- 31.Barton, D. P. et al. Stock structure of Lethrinus laticaudis (Lethrinidae) across northern Australia determined using genetics, otolith microchemistry and parasite assemblage composition. Mar Freshwater Res (2018).
- 32.Izzo C, et al. Integrated approach to determining stock structure: implications for fisheries management of sardine, Sardinops sagax, in Australian waters. Rev Fish Biol Fish. 2017;27:267–284. doi: 10.1007/s11160-017-9468-z. [DOI] [Google Scholar]
- 33.Woods RJ, Macdonald JI, Crook DA, Schmidt DJ, Hughes JM. Contemporary and historical patterns of connectivity among populations of an inland river fish species inferred from genetics and otolith chemistry. Can J Fish Aquat Sci. 2010;67:1098–1115. doi: 10.1139/F10-043. [DOI] [Google Scholar]
- 34.Waples RS, Punt AE, Cope JM. Integrating genetic data into management of marine resources: how can we do it better? Fish Fish. 2008;9:423–449. doi: 10.1111/j.1467-2979.2008.00303.x. [DOI] [Google Scholar]
- 35.Lowe WH, Allendorf FW. What can genetics tell us about population genetics? Mol Ecol. 2010;19:3038–3051. doi: 10.1111/j.1365-294X.2010.04688.x. [DOI] [PubMed] [Google Scholar]
- 36.Smith SJ, Campana SE. Integrated stock mixture analysis for continous and categorical data, with application to genetic-otolith combinations. Can J Fish Aquat Sci. 2010;67:1533–1548. doi: 10.1139/F10-078. [DOI] [Google Scholar]
- 37.Pita A, et al. Conceptual and practical advances in fish stock delineation. Fish Res. 2016;173:185–193. doi: 10.1016/j.fishres.2015.10.029. [DOI] [Google Scholar]
- 38.Chin A, et al. Crossing lines: a multidisciplinary framework for assessing connectivity of hammerhead sharks across jurisdictional boundaries. Sci Rep. 2017;7:46061. doi: 10.1038/srep46061. [DOI] [PMC free article] [PubMed] [Google Scholar]
- 39.Fernandes PG, et al. Coherent assessments of Europe’s marine fishes show regional divergence and megafauna loss. Nature Ecology & Evolution. 2017;1:0170. doi: 10.1038/s41559-017-0170. [DOI] [Google Scholar]
- 40.Higgins RM, et al. Multi-disciplinary fingerprints reveal the harvest location of cod Gadus morhua in the northeast Atlantic. Mar Ecol Prog Ser. 2010;404:197–206. doi: 10.3354/meps08492. [DOI] [Google Scholar]
- 41.Neubauer P, Shima JS, Swearer SE. Scale-dependent variability in Forsterygion lapillum hatchling otolith chemistry: implications and solutions for studies of population connectivity. Mar Ecol Prog Ser. 2010;415:263–274. doi: 10.3354/meps08741. [DOI] [Google Scholar]
- 42.Reis-Santos P, Tanner SE, Elsdon TS, Cabral HN, Gillanders BM. Effects of temperature, salinity and water composition on otolith elemental incorporation of Dicentrarchus labrax. J Exp Mar Biol Ecol. 2013;446:245–252. doi: 10.1016/j.jembe.2013.05.027. [DOI] [Google Scholar]
- 43.Stanley RRE, et al. Environmentally mediated trends in otolith composition of juvenile Atlantic cod (Gadus morhua) ICES J Mar Sci. 2015;72:2350–2363. doi: 10.1093/icesjms/fsv070. [DOI] [Google Scholar]
- 44.Torniainen J, et al. Oxygen and carbon isoscapes for the Baltic Sea: Testing their applicability in fish migration studies. Ecol Evol. 2017;7:2255–2267. doi: 10.1002/ece3.2841. [DOI] [PMC free article] [PubMed] [Google Scholar]
- 45.Thorrold SR, Campana SE, Jones CM, Swart PK. Factors determining δ13C and δ18O fractionation in aragonitic otoliths of marine fish. Geochim Cosmochim Acta. 1997;61:2909–2919. doi: 10.1016/S0016-7037(97)00141-5. [DOI] [Google Scholar]
- 46.Limburg KE, et al. Tracking Baltic hypoxia and cod migration over millennia with natural tags. Proc Natl Acad Sci USA. 2011;108:E177–E182. doi: 10.1073/pnas.1100684108. [DOI] [PMC free article] [PubMed] [Google Scholar]
- 47.Limburg KE, et al. In search of the dead zone: Use of otoliths for tracking fish exposure to hypoxia. J Mar Syst. 2015;141:167–178. doi: 10.1016/j.jmarsys.2014.02.014. [DOI] [Google Scholar]
- 48.Milzer G, et al. Benthic stable isotope variability in the Trondheimsfjord during the last 50 years: Proxy records of mixing dynamics related to NAO. Estuar Coast Shelf Sci. 2016;172:34–46. doi: 10.1016/j.ecss.2016.01.034. [DOI] [Google Scholar]
- 49.Sturrock AM, Trueman CN, Darnaude AM, Hunter E. Can otolith elemental chemistry retrospectively track migrations in fully marine fishes? J Fish Biol. 2012;81:766–795. doi: 10.1111/j.1095-8649.2012.03372.x. [DOI] [PubMed] [Google Scholar]
- 50.Tanner SE, Vasconcelos RP, Reis-Santos P, Cabral HN, Thorrold SR. Spatial and ontogenetic variability in the chemical composition of juvenile common sole (Solea solea) otoliths. Estuar Coast Shelf Sci. 2011;91:150–157. doi: 10.1016/j.ecss.2010.10.008. [DOI] [Google Scholar]
- 51.Martinho F, van der Veer HW, Cabral HN, Pardal MA. Juvenile nursery colonization patterns for the European flounder (Platichthys flesus): A latitudinal approach. J Sea Res. 2013;84:61–69. doi: 10.1016/j.seares.2013.07.014. [DOI] [Google Scholar]
- 52.Galarza JA, et al. The influence of oceanographic fronts and early-life-history traits on connectivity among littoral fish species. Proc Natl Acad Sci USA. 2009;106:1472–1478. doi: 10.1073/pnas.0806804106. [DOI] [PMC free article] [PubMed] [Google Scholar]
- 53.Calvès I, et al. Genetic structure of European flounder Platichthys flesus: effects of both the southern limit of the species’ range and chemical stress. Mar Ecol Prog Ser. 2013;472:257–273. doi: 10.3354/meps09797. [DOI] [Google Scholar]
- 54.Cabral HN, Costa MJ, Salgado JP. Does the Tagus estuary fish community reflect environmental changes? Climate Research. 2001;18:119–126. doi: 10.3354/cr018119. [DOI] [Google Scholar]
- 55.Pédron, N. et al. Contrasting patterns of energy metabolism in northern vs southern peripheral European flounder populations exposed to temperature rising and hypoxia. Mar Environ Res (2017). [DOI] [PubMed]
- 56.Florin AB, Hoglund J. Population structure of flounder (Platichthys flesus) in the Baltic Sea: differences among demersal and pelagic spawners. Heredity. 2008;101:27–38. doi: 10.1038/hdy.2008.22. [DOI] [PubMed] [Google Scholar]
- 57.Momigliano P, et al. Extraordinarily rapid speciation in a marine fish. Proceedings of the National Academy of Sciences. 2017;114:6074–6079. doi: 10.1073/pnas.1615109114. [DOI] [PMC free article] [PubMed] [Google Scholar]
- 58.Hawkins SJ, et al. Fisheries stocks from an ecological perspective: Disentangling ecological connectivity from genetic interchange. Fish Res. 2016;179:333–341. doi: 10.1016/j.fishres.2016.01.015. [DOI] [Google Scholar]
- 59.Abaunza P, et al. Stock identity of horse mackerel (Trachurus trachurus) in the Northeast Atlantic and Mediterranean Sea: Integrating the results from different stock identification approaches. Fish Res. 2008;89:196–209. doi: 10.1016/j.fishres.2007.09.022. [DOI] [Google Scholar]
- 60.Munch SB, Clarke LM. A Bayesian approach to identifying mixtures from otolith chemistry data. Can J Fish Aquat Sci. 2008;65:2742–2751. doi: 10.1139/F08-169. [DOI] [Google Scholar]
- 61.Gillanders BM. Temporal and spatial variability in elemental composition of otoliths: implications for determining stock identity and connectivity of populations. Can J Fish Aquat Sci. 2002;59:669–679. doi: 10.1139/f02-040. [DOI] [Google Scholar]
- 62.Hamer PA, Kemp J, Robertson S, Hindell JS. Multiple otolith techniques aid stock discrimination of a broadly distributed deepwater fishery species, blue grenadier. Macruronus novaezelandiae. Fish Res. 2012;113:21–34. doi: 10.1016/j.fishres.2011.08.016. [DOI] [Google Scholar]
- 63.Sturgeon RE, et al. Certification of a fish otolith reference material in support of quality assurance for trace element analysis. J Anal At Spectrom. 2005;20:1067–1071. doi: 10.1039/b503655k. [DOI] [Google Scholar]
- 64.Yoshinaga J, Nakama A, Morita M, Edmonds JS. Fish otolith reference material for quality assurance of chemical analyses. Mar Chem. 2000;69:91–97. doi: 10.1016/S0304-4203(99)00098-5. [DOI] [Google Scholar]
- 65.Ostermann DR, Curry WB. Calibration of stable isotopic data: an enriched δ18O standard used for source gas mixing detection and correction. Paleoceanography. 2000;15:353–360. doi: 10.1029/1999PA000411. [DOI] [Google Scholar]
- 66.R: A Language and Environment for Statistical Computing (R Foundation for Statistical Computing, Vienna, Austria, 2016).
- 67.Sambrook, J. & Russell, D. Molecular Cloning: A Laboratory Manual. (Cold Spring Harbor Laboratory Press, 2001).
- 68.Pédron N, et al. New set of candidate gene SNPs and microsatellites to disentangle selective and neutral processes shaping population responses of European flounder (Platichthys flesus) to anthropogenic stress and contrasted environments. Conservation Genetics Resources. 2015;7:823–826. doi: 10.1007/s12686-015-0492-9. [DOI] [Google Scholar]
- 69.van Oosterhout C, Hutchinson WF, Wills DPM, Shipley P. MICRO-CHECKER: software for identifying and correcting genotyping errors in microsatellite data. Mol Ecol Notes. 2004;4:535–538. doi: 10.1111/j.1471-8286.2004.00684.x. [DOI] [Google Scholar]
- 70.Kalinowski S. T. hp-rare 1.0: a computer program for performing rarefaction on measures of allelic richness. Mol Ecol Notes. 2005;5:187–189. doi: 10.1111/j.1471-8286.2004.00845.x. [DOI] [Google Scholar]
- 71.Nei M. Estimation of Average Heterozygosity and Genetic Distance from a Small Number of Individuals. Genetics. 1978;89:583–590. doi: 10.1093/genetics/89.3.583. [DOI] [PMC free article] [PubMed] [Google Scholar]
- 72.Excoffier L, Laval G, Schneider S. Arlequin ver. 3.0: an integrated software package for population genetics data analysis. Evol Bioinform Online. 2005;1:47–50. doi: 10.1177/117693430500100003. [DOI] [PMC free article] [PubMed] [Google Scholar]
- 73.Belkhir, K., Borsa, P., Chikhi, L., Raufaste, N. & Bonhomme, F. GENETIX 4.05, logiciel sous Windows TM pour la génétique des populations Laboratoire Génome, Populations, Interactions, CNRS UMR 5171, Université de Montpellier II, Montpellier (France). (1996–2004).
- 74.Raymond M, Rousset F. GENEPOP (version 1.2): population genetics software for exact tests and ecumenicism. J Hered. 1995;86:248–249. doi: 10.1093/oxfordjournals.jhered.a111573. [DOI] [Google Scholar]
- 75.Peakall ROD, Smouse PE. genalex 6: genetic analysis in Excel Population genetic software for teaching and research. Mol Ecol Notes. 2006;6:288–295. doi: 10.1111/j.1471-8286.2005.01155.x. [DOI] [PMC free article] [PubMed] [Google Scholar]
- 76.Pritchard JK, Stephens M, Donnelly P. Inference of population structure using multilocus genotype data. Genetics. 2000;155:945–959. doi: 10.1093/genetics/155.2.945. [DOI] [PMC free article] [PubMed] [Google Scholar]
- 77.Evanno G, Regnaut S, Goudet J. Detecting the number of clusters of individuals using the software STRUCTURE: a simulation study. Mol Ecol. 2005;14:2611–2620. doi: 10.1111/j.1365-294X.2005.02553.x. [DOI] [PubMed] [Google Scholar]
- 78.Earl DA, vonHoldt BM. STRUCTURE HARVESTER: a website and program for visualizing STRUCTURE output and implementing the Evanno method. Conservation Genetics Resources. 2012;4:359–361. doi: 10.1007/s12686-011-9548-7. [DOI] [Google Scholar]
- 79.QGIS Development Team. QGIS Geographic Information System, Open Source Geospatial Foundation, http://qgis.osgeo.org. (2009).
Associated Data
This section collects any data citations, data availability statements, or supplementary materials included in this article.
Data Availability Statement
The datasets generated and/or analysed during the current study are available from the corresponding author on reasonable request.