Abstract
Metabolic regulation has been recognized as a powerful principle guiding immune responses. Inflammatory macrophages undergo extensive metabolic rewiring1 marked by the production of substantial amounts of itaconate, which has recently been described as an immunoregulatory metabolite2. Itaconate and its membrane-permeable derivative dimethyl itaconate (DI) selectively inhibit a subset of cytokines2, including IL-6 and IL-12 but not TNF. The major effects of itaconate on cellular metabolism during macrophage activation have been attributed to the inhibition of succinate dehydrogenase2,3, yet this inhibition alone is not sufficient to account for the pronounced immunoregulatory effects observed in the case of DI. Furthermore, the regulatory pathway responsible for such selective effects of itaconate and DI on the inflammatory program has not been defined. Here we show that itaconate and DI induce electrophilic stress, react with glutathione and subsequently induce both Nrf2 (also known as NFE2L2)-dependent and -independent responses. We find that electrophilic stress can selectively regulate secondary, but not primary, transcriptional responses to toll-like receptor stimulation via inhibition of IκBζ protein induction. The regulation of IκBζ is independent of Nrf2, and we identify ATF3 as its key mediator. The inhibitory effect is conserved across species and cell types, and the in vivo administration of DI can ameliorate IL-17–IκBζ-driven skin pathology in a mouse model of psoriasis, highlighting the therapeutic potential of this regulatory pathway. Our results demonstrate that targeting the DI–IκBζ regulatory axis could be an important new strategy for the treatment of IL-17–IκBζ-mediated autoimmune diseases.
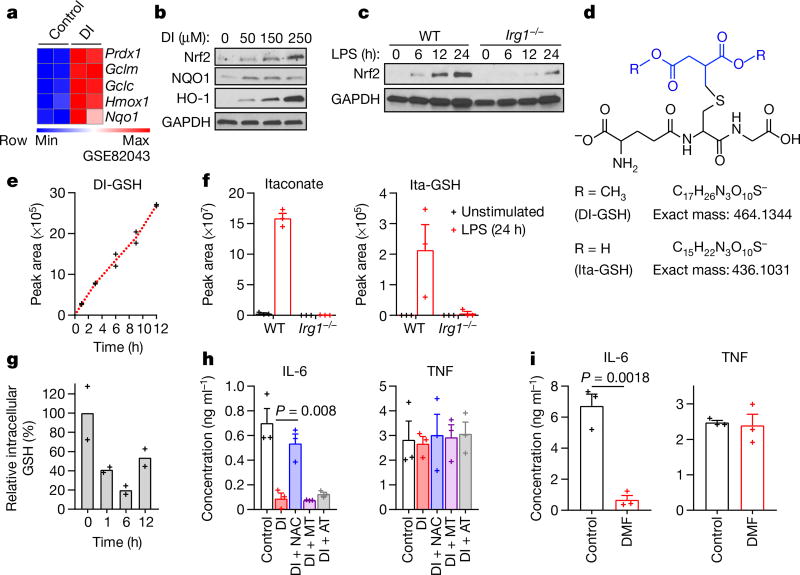
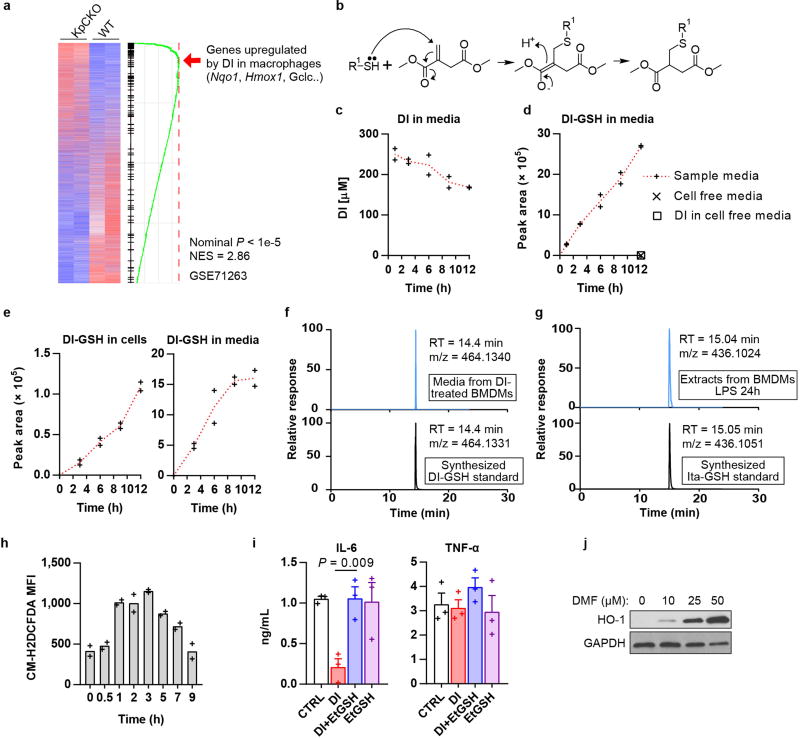
Differential gene expression in our published transcriptional analysis of DI-treated bone marrow-derived macrophages (BMDMs)2 showed the enrichment of electrophilic and xenobiotic stress response pathways, specifically the upregulation of classical transcriptional markers of a Nrf2-mediated response4 such as Hmox1, Nqo1 and Gclm (Fig. 1a). Indeed, Nrf2 protein levels, as well as the protein levels of its classical target genes, increased during 12 hours of treatment with DI (Fig. 1b). Endogenous itaconate also induced a KEAP1–Nrf2 response, as Nrf2 protein levels upon lipopolysaccharide (LPS) activation were higher in wild-type macrophages than in Irg1−/− macrophages (Irg1 is also known as Acod1) (Fig. 1c). Overall, transcriptional signatures of DI treatment matched those of the KEAP1-knockout macrophages5 (Extended Data Fig. 1a), indicating the induction of a global electrophilic stress response.
Fig. 1. DI and itaconate induce electrophilic stress in macrophages.
a, Nrf2-response genes in DI-treated BMDMs. b, c, Western blots of Nrf2 and Nrf2 targets in DI-treated (b) or LPS-stimulated (c) BMDMs. d, The chemical structures of DI-GSH and Ita-GSH. e, DI-GSH levels in the media of DI-treated BMDMs, mean of n = 2 cultures. f, Itaconate (left) and Ita-GSH (right) levels in BMDMs, mean ± s.e.m., n = 3 cultures. g, GSH levels in DI-treated BMDMs, mean of n = 2 experiments. h, i, Cytokine levels in BMDMs treated as indicated and LPS-stimulated for 4 h (h) and 24 h (i); mean ± s.e.m., n = 3 experiments. Western blots are representatives of three experiments. For gel source data, see Supplementary Fig. 1. Statistical tests used were two-tailed t-tests. AT, α-tocopherol; MT, MitoTEMPO.
Considering its structure, DI can readily act as an electrophile in Michael reactions (Extended Data Fig. 1b) and trigger electrophilic stress, which is usually controlled via glutathione (GSH) buffering. For example, covalent conjugation with GSH has been described for fumarate, a metabolite that typically accumulates in cells with mutated fumarate hydratase6,7. Analysis of the cell media from DI-treated macrophages suggested that DI was taken up from the media, and a substantial peak was found with a retention time of 14.4 min and an m/z of 464.1334; this peak increased during incubation with DI and corresponded to the diester of methylsuccinated GSH (DI-GSH) (Fig. 1d, e, Extended Data Fig. 1c, d). The origin of DI-GSH was confirmed using synthesized 13C5-labelled DI for cell treatment (Extended Data Fig. 1e). Notably, the reactivity with GSH was also observed for natural itaconate; we detected methylsuccinated GSH (Ita-GSH, Fig. 1d) in LPS-stimulated macrophages, which correlated with itaconate production and was absent in Irg1−/− cells (Fig. 1f). The identities of the DI-GSH and Ita-GSH conjugates were confirmed by comparing their liquid chromatography–mass spectrometry retention times with those of chemically synthesized standards (Extended Data Fig. 1f, g).
The reactivity of DI led to a substantial decrease in cellular GSH concentration and an associated increase in the generation of reactive oxygen species (Fig. 1g, Extended Data Fig. 1h). Therefore, we tested a panel of antioxidants (scavengers of reactive oxygen species) by administering them simultaneously with DI. Co-treatment with only N-acetylcysteine (NAC) or cell-permeable GSH (EtGSH) reversed the effect of DI, suggesting that DI acts preferentially by modulating the cellular pool of thiol-containing molecules (Fig. 1h, Extended Data Fig. 1i). The prototypical electrophile dimethyl fumarate (DMF) also triggered an Nrf2 response and showed selective inhibition of IL-6 (Fig. 1i, Extended Data Fig. 1j).
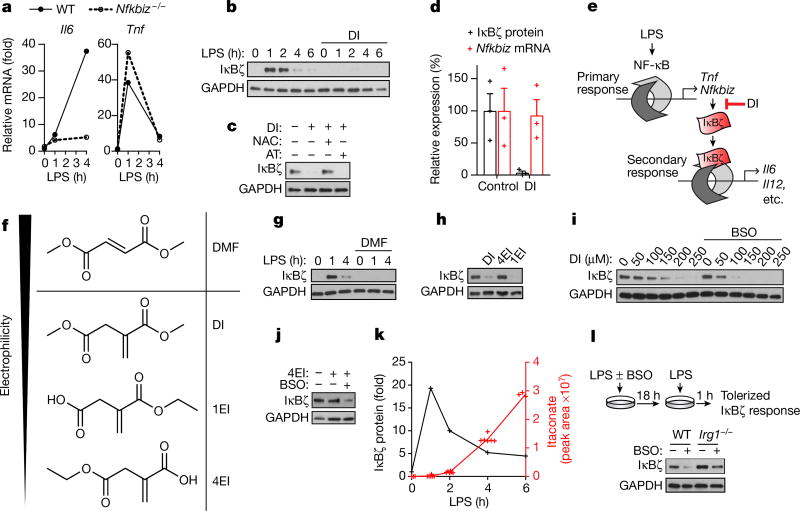
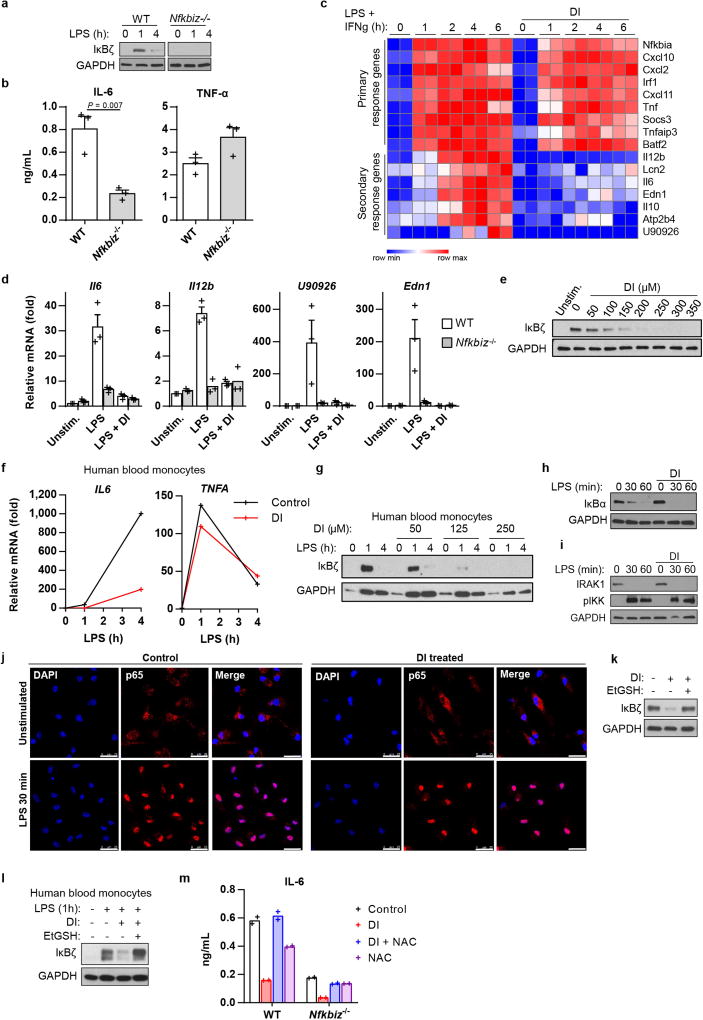
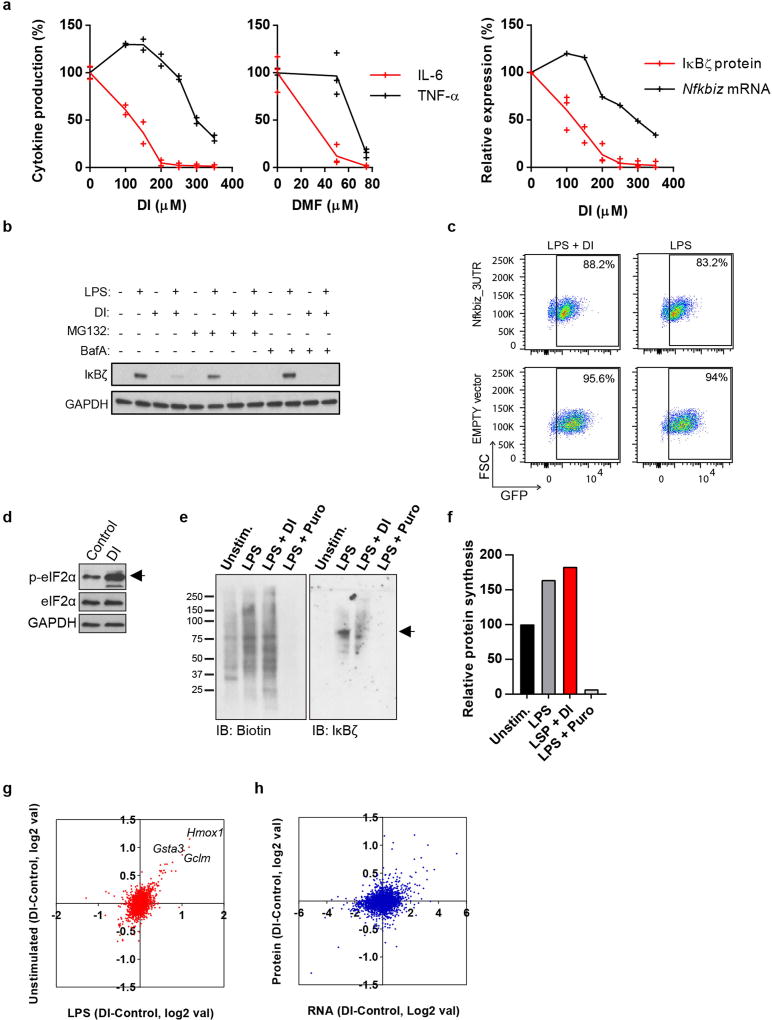
Tnf is induced during the primary transcriptional response to toll-like receptor (TLR) stimulation, whereas Il6 is a product of the secondary transcriptional responses8. The major transcription factor that has been reported to selectively regulate secondary transcriptional response to TLR activation is IκBζ, which is encoded by the Nfkbiz gene9 (Fig. 2a, Extended Data Fig. 2a, b). Notably, DI completely abolished the LPS-associated induction of IκBζ protein and inhibited its target genes (including Il12b and Edn1) in both BMDMs and human blood monocytes (Fig. 2b, Extended Data Fig. 2c–g). This suggested that the observed specificity of action of DI on IL-6 may result from the selective inhibition of the secondary transcriptional response to TLR activation. Indeed, DI did not inhibit IκBα degradation and upstream signalling in response to LPS, nor did it prevent LPS-mediated p65 nuclear translocation (Extended Data Fig. 2h–j). We next tested whether the NAC- or EtGSH-mediated reversal of the effect of DI on IL-6 was associated with the recovery of IκBζ protein induction. Indeed, co-treatment of BMDMs with DI and NAC (or EtGSH), but not α-tocopherol, restored LPS-mediated IκBζ induction in BMDMs and in human blood monocytes, whereas NAC itself did not increase IL-6 levels in untreated or DI-treated Nfkbiz−/− BMDMs (Fig. 2c, Extended Data Fig. 2k–m). Consistent with the idea that the primary NF-κB-mediated response is not affected by DI at this concentration range, Nfkbiz mRNA levels were unchanged upon DI treatment, meaning that IκBζ protein induction is affected at the post-transcriptional level (Fig. 2d, e, Extended Data Fig. 3a).
Fig. 2. DI inhibits LPS-mediated IκBζ induction.
a, mRNA expression in LPS-stimulated BMDMs. Representative of two experiments. b, c, g–j, Western blots of IκBζ expression in BMDMs treated with DI, DMF, 4EI (h, 5 µM; j, 10 µM) or 1EI, LPS for 1 h or as indicated. d, Relative levels of IκBζ protein and mRNA in BMDMs treated with DI and then LPS for 1 h, mean ± s.e.m., n = 3 experiments. e, Schematic showing the mechanism of action of DI. f, Structures of DMF and itaconate derivatives. k, Densitometry of IκBζ from b and itaconate levels, mean of n = 6 cultures. l, Schematic (top) and western blot (bottom) for the measurement of IκBζ expression in BMDMs tolerized in the presence of BSO. Western blots are representative of three experiments (except for h, two experiments). For gel source data, see Supplementary Fig. 1.
To understand the regulation of IκBζ protein, we used proteasome inhibitor MG132 and autophagosome–lysosome fusion inhibitor bafilomycin A, but neither rescued IκBζ induction during DI treatment (Extended Data Fig. 3b). Additionally, the action of DI could not be attributed to the regulation of Nfkbiz 3′ untranslated region (UTR)10, as indicated by a GFP reporter assay (Extended Data Fig. 3c). Finally, cellular stress has been shown to regulate mRNA translation via phosphorylation-driven inactivation of eIF2α11. Indeed, we detected a marked increase in macrophage eIF2α phosphorylation in response to DI (Extended Data Fig. 3d), suggesting that the inhibitory effect of DI on IκBζ protein levels is associated with the regulation of IκBζ translation. However, this suppression was very specific to IκBζ and possibly a few other proteins; DI did not affect protein synthesis globally, as judged by either metabolic labelling of nascent proteins or proteomic profiling of DI-treated macrophages (Extended Data Fig. 3e–h).
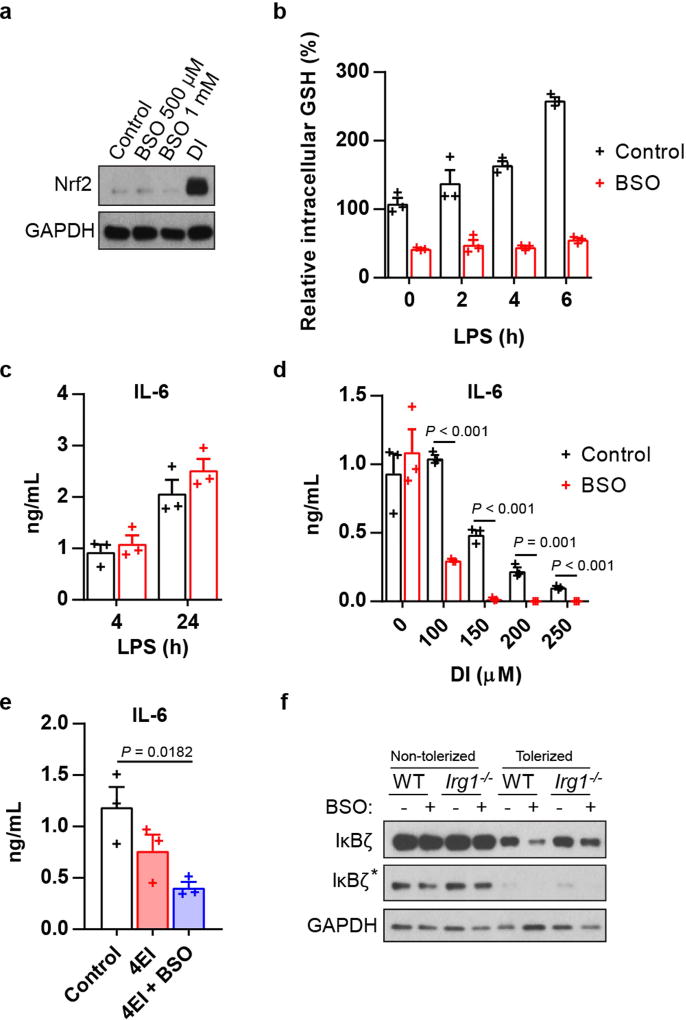
To further understand the effect of electrophilic stress on the IκBζ-mediated inflammatory program, we tested a panel of itaconate derivatives with different electrophilicities and also included DMF (Fig. 2f). The inhibitory effects of the compounds on IκBζ correlated with their electrophilic strength: DI, DMF and 1-ethyl itaconate (1EI) inhibited IκBζ induction, whereas 4-ethyl itaconate (4EI) did not (Fig. 2g, h). To decouple the contribution of the feedback GSH synthesis during the electrophilic stress response to these compounds, we tested combinations of itaconate derivatives with buthionine sulfoximine (BSO), a non-electrophilic inhibitor of GSH synthesis, which itself neither inhibits cytokine production nor triggers a Nrf2 response (Extended Data Fig. 4a–c). BSO enhanced the inhibitory effect of DI on IκBζ–IL-6 (Fig. 2i, Extended Data Fig. 4d) and unlocked the effect of 4EI on IκBζ–IL-6 (Fig. 2j, Extended Data Fig. 4e).
We next considered the effects of endogenously produced itaconate, which is a weak electrophile, on the IκBζ-regulatory axis. The temporal dynamics of IκBζ upon LPS activation are very different from those of itaconate: levels of IκBζ reach a maximum at around 1 hour and are already reduced considerably by around 4 hours, whereas itaconate is only induced at around 2–4 hours and plateaus later after LPS stimulation (Fig. 2k). As such, to address the physiological relevance of endogenous itaconate to IκBζ regulation, we designed an experiment in which both natural itaconate and IκBζ are present in the cells at the same time. Specifically, we have evaluated in vitro macrophage tolerization, when cells are first stimulated with LPS and then rechallenged with LPS at 18 hours. This design ensures that endogenous itaconate is produced in sufficient amounts and LPS restimulation triggers IκBζ induction once again. We observed that, in the presence of BSO, there was a marked difference in IκBζ protein levels upon restimulation between Irg1−/− and wild-type cells (Fig. 2l, Extended Data Fig. 4f), confirming the potential regulatory effects of natural itaconate on IκBζ.
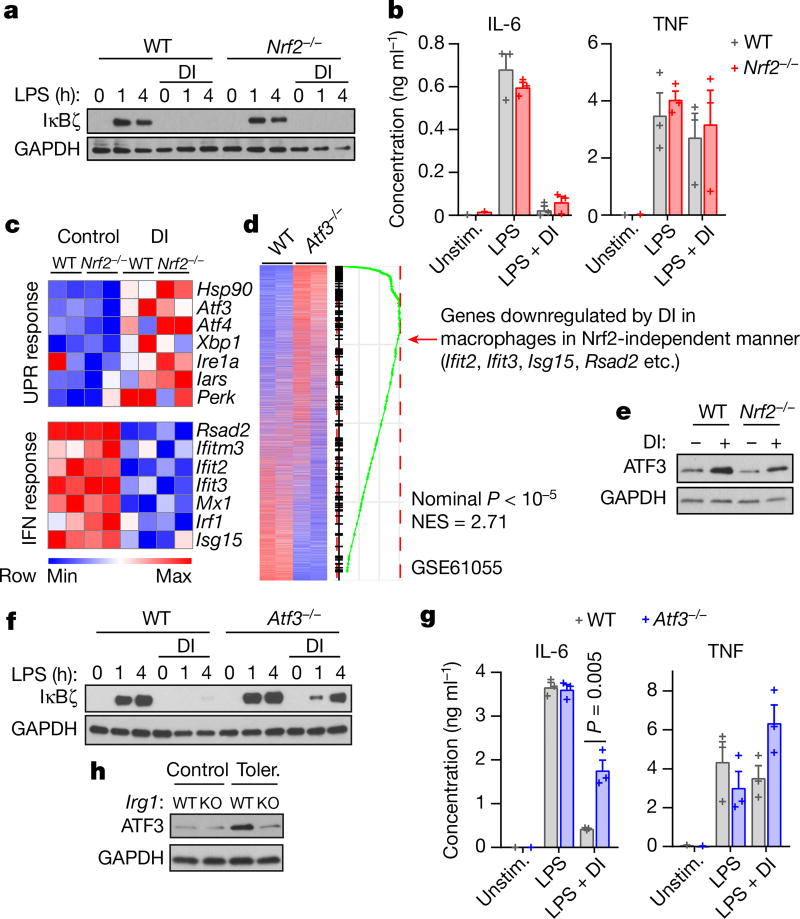
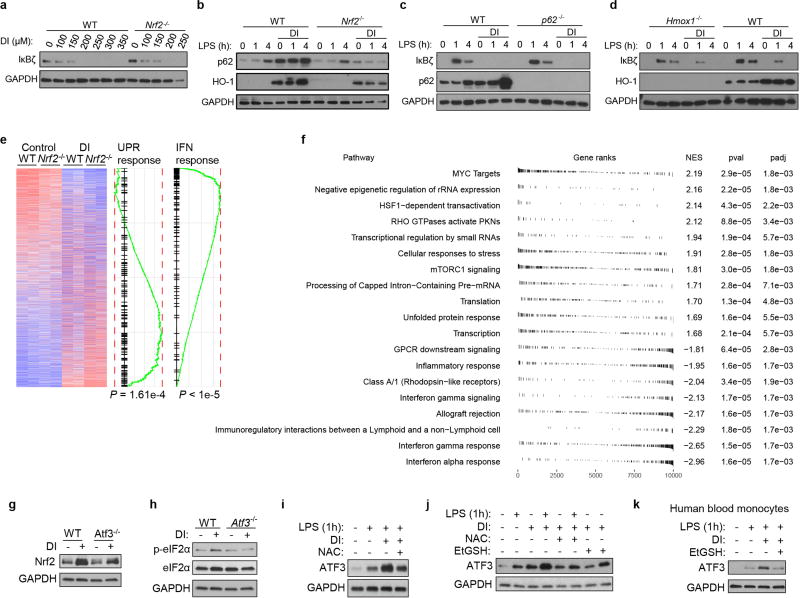
We next aimed to identify major regulatory hubs connecting the electrophilic stress to the blockade of IκBζ induction. First, we tested whether Nrf2 is involved in the inhibition of IκBζ synthesis by DI. Nrf2-deficient BMDMs did not alleviate DI-mediated IκBζ and IL-6 inhibition (Fig. 3a, b, Extended Data Fig. 5a). Similarly, macrophages genetically lacking p62 (also known as SQSTM1)12 or HO-113 did not rescue DI-mediated IκBζ inhibition (Extended Data Fig. 5b–d). Because the action of DI is independent of Nrf2, we performed RNA sequencing (RNA-seq) in Nrf2−/− (also known as Nfe2l2−/−) and wild-type BMDMs and analysed the genes that were differentially expressed upon treatment with DI (Extended Data Fig. 5e). Most of the differentially DI-regulated pathways of the integrated stress response were upregulated (Atf3, Atf4 and Eif2ak3 (also known as Perk)), whereas the interferon (IFN) response pathways (for example, Isg15) were consistently downregulated (Fig. 3c, Extended Data Fig. 5f). Focusing on ATF3 as a potential candidate14, we compared our Nrf2-independent transcriptional signature of DI treatment to the publicly available dataset that profiled wild-type and Atf3−/− macrophages at their basal states15. Notably, we found highly statistically significant overlap between genes regulated by ATF3 and genes regulated by DI (Fig. 3d), suggesting that the action of DI might be mediated by ATF3. Indeed, the protein ATF3 was upregulated by DI treatment even on an Nrf2−/− background (Fig. 3e). Furthermore, Atf3−/− cells restored IκBζ protein levels upon DI treatment and significantly increased IL-6 production in DI-treated Atf3−/− cells compared to the wild type (Fig. 3f, g). In Atf3−/− macrophages, DI failed to increase eIF2α phosphorylation, even though it still induced an Nrf2 response (Extended Data Fig. 5g, h). DI-mediated ATF3 expression was efficiently decreased by co-treatment with NAC or EtGSH in both mouse macrophages and human monocytes (Extended Data Fig. 5i–k). Endogenous itaconate also efficiently induced an ATF3 response: when we compared wild-type and Irg1−/− BMDMs tolerized in the presence of BSO and then restimulated, ATF3 was induced in wild-type cells but not in Irg1−/− cells (Fig. 3h).
Fig. 3. DI induces an Nrf2-independent response and inhibits the IL-6–IκBζ axis via ATF3.
a, f, Western blots showing IκBζ expression in Nrf2−/− (a) and Atf3−/− (f) BMDMs. b, g, Cytokine levels in BMDMs treated with DI, stimulated with LPS for 4 h (b) and 24 h (g), mean ± s.e.m., n = 3 experiments. c, Genes regulated by DI independently of Nrf2. Hsp90, Ire1a and Perk are also known as Hsp84-2, Ern1 and Eif2ak3, respectively. ‘UPS response’ indicates UPS response pathways. d, Transcriptional comparison of Atf3−/− and wild-type BMDMs and enrichment of the Nrf2-independent DI signature. e, h, Western blots of ATF3 expression in BMDMs after DI treatment (e) and tolerized in the presence of BSO (h). Western blot data are representative of three experiments. For gel source data, see Supplementary Fig. 1. Statistical tests used were two-tailed t-tests. KO, knockout; NES, normalized enrichment score; UPR, unfolded protein response.
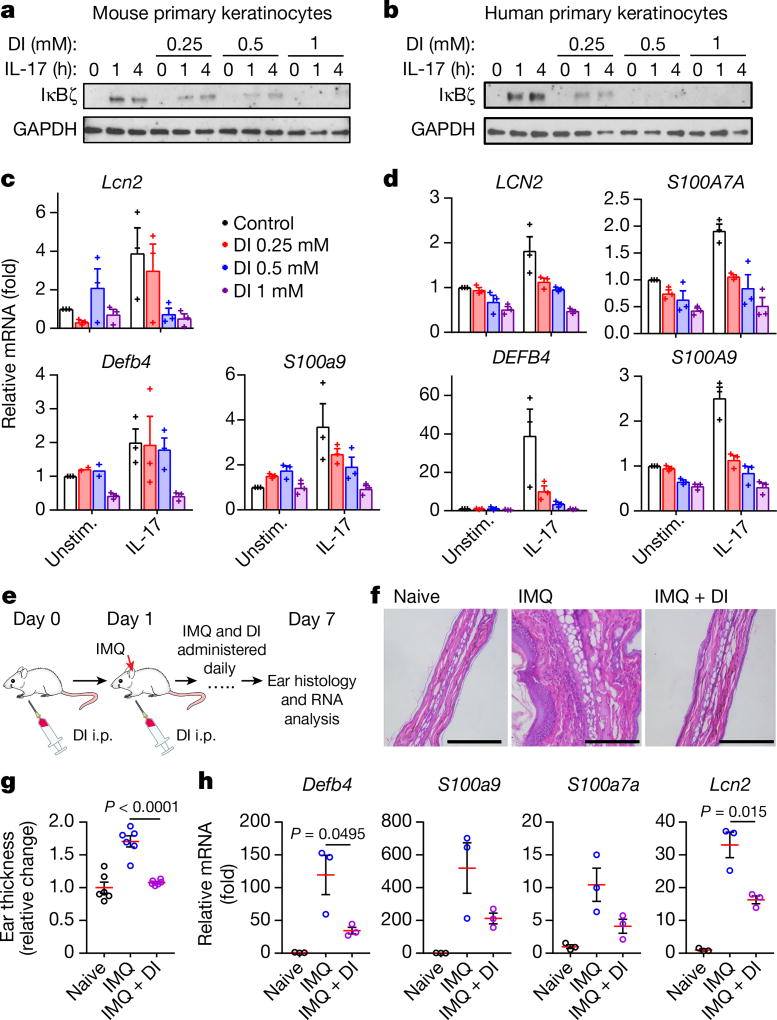
Notably, IκBζ also has a major role outside the macrophage context: it is induced upon IL-17 treatment of epithelial cells and orchestrates downstream inflammatory responses16–18. Nfkbiz polymorphisms have been associated with several immune-related conditions, including psoriasis19. As such, we first tested the in vitro effect of DI pretreatment on IκBζ induction in IL-17A-stimulated primary keratinocytes. The induction of IκBζ was inhibited by DI in primary mouse and human keratinocytes (Fig. 4a, b, Extended Data Fig. 6). To further examine the inhibitory effect of DI on IκBζ induction by IL-17, we analysed expression of the well-characterized IκBζ target genes Defb4, S100a7a, Lcn2 and S100a9 in mouse and human keratinocytes. As expected, the expression of these genes was downregulated by DI in correlation with IκBζ protein levels (Fig. 4c, d). These data suggest that DI can also modulate the induction of IκBζ in several immune contexts.
Fig. 4. DI inhibits IL-17-mediated IκBζ induction in keratinocytes and ameliorates psoriatic pathology.
a, b, Western blot of IκBζ expression in DI-treated, IL-17A-stimulated primary mouse (a) and human (b) keratinocytes. Representative of three mice or donors. For gel source data, see Supplementary Fig. 1. c, d, mRNA expression in DI-treated, IL-17A-stimulated (4 h) primary mouse (c) and human (d) keratinocytes, mean ± s.e.m., n = 3 mice or donors. e, Schematic of DI administration in a psoriasis model. f, Ear histology of control mice (left), IMQ-treated mice (middle) and mice treated with both IMQ and DI (right). Scale bars, 100 µm. Representative of six mice in two experiments. g, Quantification of the histology results in f, showing the relative change in ear thickness. Mean ± s.e.m., n = 6 mice. h, mRNA expression to show the induction of the indicated IκBζ target genes in ear tissue, mean ± s.e.m., n = 3 mice. Statistical tests used were two-tailed t-tests.
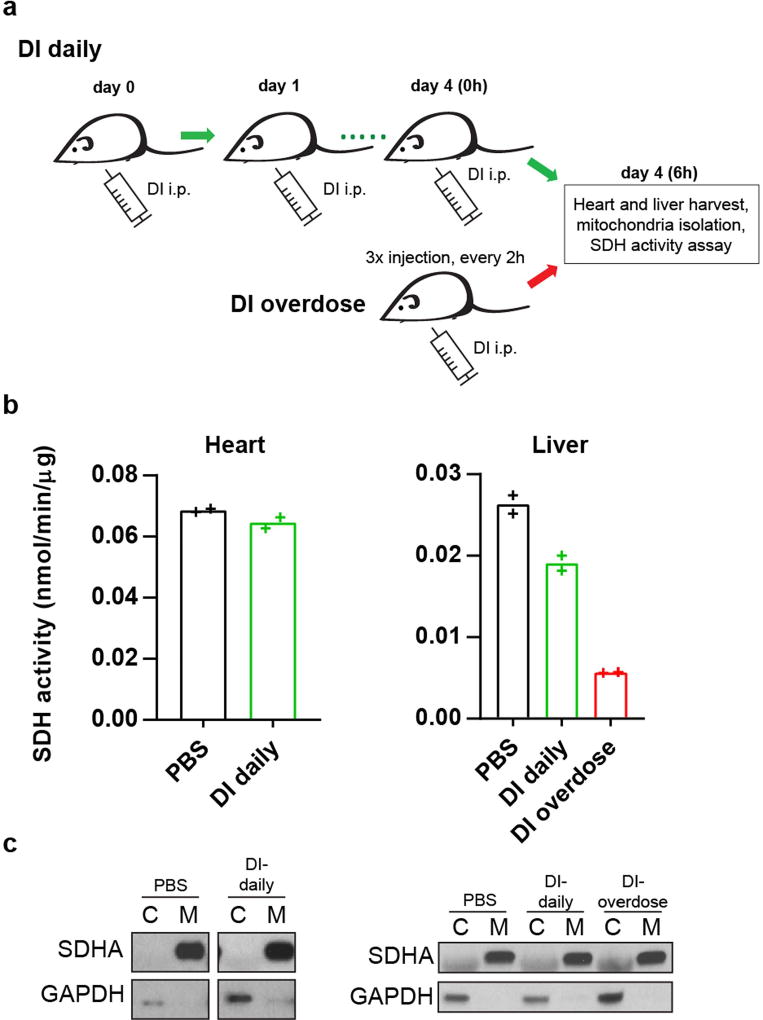
We next explored the ability of DI to interfere with IκBζ signalling in vivo. We used a mouse model of psoriasis induced by the TLR7/8 agonist imiquimod (IMQ). In this model, skin inflammation is induced by topical application of IMQ cream onto the ears of mice to induce a psoriasis-like pathology resembling the human disease. Daily topical application of IMQ to the skin of the ear for seven days led to considerable scaling and oedema of the skin in control animals, whereas mice treated with DI in addition to IMQ showed no detectable skin changes (Fig. 4e–g). Similarly, quantitative analysis of ear-skin-derived mRNA showed significant induction of the IκBζ target genes Defb4, S100a9, S100a7a and Lcn2 after IMQ application, whereas their expression was markedly reduced in the skin of mice treated with DI (Fig. 4h). Daily DI administration did not affect succinate dehydrogenase activity in the heart and the liver considerably (Extended Data Fig. 7), suggesting a favourable safety profile. These data demonstrate that DI can act as an IκBζ inhibitor in vivo and could provide a targeted approach for treating various autoimmune conditions.
Methods
Data reporting
No statistical methods were used to predetermine sample size. The experiments were not randomized, and the investigators were not blinded to allocation during experiments and outcome assessment.
Experimental animals
C57BL/6N wild-type mice were obtained from Charles River Laboratories. Nrf2−/− mice (cat. no. 017009) and control wild-type C57BL/6J mice (cat. no. 000664) were purchased from The Jackson Laboratory. Irg1−/− mice were published previously2. Nfkbiz−/− mice9 were provided by S.A., sex-matched animals were used in experiments. p62-deficient mice20 were provided by H. Virgin. Mice were maintained at Washington University under specific pathogen-free conditions in accordance with federal and university guidelines and protocols approved by the Animal Studies Committee of Washington University. Femurs and tibias from Hmox1lox/− and control LyzMcre/creHmox1lox/− mice21 were provided by M.P.S.. Femurs and tibias from Atf3−/− mice22 and control C57BL/6 wild-type mice were provided by T.H.. Mice used for the study were 6–12 weeks old. Unless stated otherwise, female mice were used.
Bone marrow-derived macrophages and mouse cell cultures
BMDMs were prepared from 6- to 12-week-old mice as described1 and cultured in RMPI-1640 medium supplemented with 10% fetal bovine serum (FBS), 2 mM l-glutamine and 100 U ml−1 penicillin–streptomycin and mouse recombinant macrophage colony stimulating factor (20 ng ml−1, Peprotech). For experiments, cells were seeded at a concentration of 106 cells per ml in tissue-culture plates of various formats. The cells were treated with DI (250 µM unless stated otherwise, cat. no. 592498, Sigma), DMF (50 µM unless stated otherwise, cat. no. 242926, Sigma), 3-(ethoxycarbonyl) but-3-enoic acid (1-ethyl itaconate, 1EI; 5 µM, Aris Pharmaceuticals Inc.), or 4-ethoxy-2-methylene-4-oxobutanoic acid (4-ethyl itaconate, 4EI; Aris Pharmaceuticals Inc.) for 12 h and activated with lipopolysaccharide (LPS; 100 ng ml−1, Escherichia coli 0111:B4, Sigma) for 1 h or as indicated. In some experiments cells were stimulated with a combination of LPS (20 ng ml−1) and IFNγ (50 ng ml−1, Peprotech). In some experiments cells were treated with α-tocopherol (10 µM, Sigma), Mito TEMPO (500 µM, Sigma), N-acetylcysteine (1 mM, Sigma), the ethylester of GSH (EtGSH; 1 mM, Santa Cruz Biotechnology) or buthionene sulfoximine (BSO; 500 µM, Sigma) alone or in combination with DI for 12 h. In some experiments BMDMs were treated with DI for 12 h and bafilomycin A (100 nM, Sigma) or MG132 (10 µM, Selleckchem) were added 30 min before subsequent LPS stimulation.
In tolerization experiments, cells were stimulated with LPS (100 ng ml−1) for 18 h then washed with PBS at 37 °C and restimulated with LPS (100 ng ml−1) for 1 h. In some samples, BSO (500 µM) was present during the first stimulation.
The BV2 microglial cell line was a gift from H. Virgin. BV2 cells were maintained in DMEM medium supplemented with 10% FBS, 2 mM l-glutamine, 1 mM sodium pyruvate and 100 U ml−1 penicillin–streptomycin. BV2 responsiveness to TLR stimulation was tested and cells were not tested for mycoplasma contamination.
RNA sequencing analysis
mRNA was extracted with oligodT beads (Invitrogen), and libraries were prepared and quantified as described previously23. All RNA-seq experiments were performed in n = 2 independent cultures. Raw and processed data were deposited in the Gene Expression Omnibus. Pre-ranked gene set enrichment analysis (GSEA) was performed using the fgsea R package24. For the analysis of wild-type and Nrf2−/− BMDMs, genes were ranked according to signal-to-noise statistics; only the top 10,000 genes ordered by mean expression were considered. MSigDB C2 and H gene set collections were used. For the analysis of KEAP1 conditional knockout (KpCKO) (GSE71263)5 and Atf3−/− (GSE61055)15 datasets, differential expression analysis was carried out using the limma package25, genes were ranked by the corresponding test statistics and P values were calculated using the GSEA method in the fgsea R package24 with 200,000 gene-set permutations. Heat maps were generated using the Phantasus online service (https://artyomovlab.wustl.edu/phantasus/).
Western blots
Cells were lysed in RIPA lysis buffer system (Santa Cruz Biotechnology) and heat-denatured at 95 °C for 5 min in reducing sample buffer (Bio-Rad). Proteins were separated on 4–20% polyacrylamide gradient gels (Bio-Rad) and transferred onto PVDF membranes (0.45 µm pore size, Millipore). Non-specific binding was blocked with 5% skim milk (or 5% BSA when phosphoproteins were analysed), and membranes were probed with primary antibodies specific to Nrf2 (#12721), HO-1 (#70081), IκBζ (mouse-specific, #93726), IκBζ (#9244), ATF3 (#D2Y5W), IRAK1 (#4504; sensitivity of IRAK1 detection diminishes upon IRAK1 K63 ubiquitination26), phospho-IKK (Ser176/180, #2697), p62 (also known as SQSTM1) (#5114), phospho-eIF2α (Ser51, #9721), eIF2α (#5324) from Cell Signaling; glyceraldehyde 3-phosphate dehydrogenase (GAPDH; sc-25778), IκBα (sc-1643), ATF3 (sc-188), succinate dehydrogenase complex, subunit A (SDHA; sc-166909) from Santa Cruz Biotechnology; NQO1 (ab28947) from Abcam, followed by incubation with anti-rabbit-HRP (1:10,000; sc-2030) or anti-mouse-HRP (1:10,000; sc-2031) from Santa Cruz Biotechnology and Clarity Western ECL substrate (Bio-Rad). Membranes were exposed to X-ray films (Research Products International) and developed using an SRX-101A film processor (Konica Minolta). GAPDH run on the same blot was used as a loading control. After the scanning of original films, the image brightness of some blots was adjusted and bands were cropped using ImageJ27,28. Densitometry was performed using ImageJ. For gel source data (unadjusted and uncropped images containing molecular size marker), see Supplementary Fig. 1.
DI detection with gas chromatography–mass spectrometry (GC–MS)
For DI measurement, medium was collected from cells at various time points during incubation with 250 µM DI, and placed on ice. An equal volume of ethyl acetate (Sigma) was added and the samples were vortexed at 4 °C for 1 min. After centrifugation at 14,000g for 2 min at 4 °C, the organic phase was collected and approximately 20–30 mg of sodium sulfate (Sigma) was added. The samples were vortexed before analysis. Analysis was performed using a TRACE 1300 GC equipped with a 30-m DB-35MS capillary column connected to a Thermo TSQ Quantum MS operating under electron impact ionization at 70 eV. 1 µl of sample was injected in splitless mode at 270 °C, using helium as the carrier gas at a flow rate of 1 ml min−1. The GC oven temperature was held at 100 °C for 3 min and increased to 240 °C at 3.5° min−1. The MS source and the quadrupole were held at 230 °C and 280 °C, respectively, and the detector recorded ion abundance in the range 30–800 m/z.
Metabolite profiling with liquid chromatography–mass spectrometry (LC–MS)
Bone marrow-derived macrophages were seeded in 96-well plates at 105 cell per well for all analyses. After treatment, media was removed from the wells and the cells were washed three times with PBS (37 °C) and immediately placed on dry ice. The frozen cells or media were stored at −80 °C until extraction. Cell extracts were prepared by adding 180 µl of 70/30 ethanol/H2O solution at 70 °C, with 300 ng ml−1 13C5 15N1 d5-glutamate as the internal standard. After rigorous mixing and centrifugation (21,694g for 10 min at 4 °C), the supernatant was collected and transferred to another 96-well plate, and the solvent was evaporated under reduced pressure using EZ-2 (Genevac). Before injection, dried extracts were reconstituted, or medium was diluted (1:20) in LC–MS grade water. The extracted samples were analysed by high-resolution accurate mass lLC–MS. LC separation was achieved by reverse-phase ion-pairing chromatography. The system consisted of a Vanquish (Thermo Fisher Scientific) pumping system, coupled to an autosampler and degasser. Chromatographic separation was performed using a Synergy Hydro-RP column (100 mm × 2 mm, 2.5 µm particle size, Phenomenex). The elution gradient involved a binary solvent system as described previously29. Accurate mass data were acquired using a Q Exactive Orbitrap mass spectrometer (Thermo Fisher Scientific), which was equipped with a heated electrospray ionization source operated in negative electrospray mode. Ionization source working parameters were optimized; the heater temperature was set to 300 °C, ion spray voltage was set to 3,500 V. An m/z scan range from 70 to 700 was chosen and the resolution was set at 70,000. The automatic gain control target was set at 1e6 and the maximum injection time was 250 ms. Instrument control and acquisition was achieved using Xcalibur 2.2 software (Thermo Fisher Scientific). All data analysis was conducted using El-MAVEN software30.
Synthesis of DI-GSH conjugate (N5-(1-((carboxymethyl)amino)-3-((4-methoxy-2-(methoxycarbonyl)-4-oxobutyl)thio)-1-oxopropan-2-yl)glutamine)
To a vial charged with dimethyl 2-methylenesuccinate (0.158 g, 1.0 mmol) was added ethanol (1.000 ml) and triethylamine (0.167 ml, 1.200 mmol) and the mixture was cooled in an ice–water bath before the addition of GSH (0.369 g, 1.200 mmol). The resulting suspension was stirred overnight and allowed to slowly warm to room temperature (ice melt) affording a light yellow solution. The mixture was dried under reduced pressure and purified by RP-HPLC as follows: Agilent automated purification system with single quad MS and DAD; Waters AcQuity UPLC I-Class with QDa and UV; XSelect CSH Prep C18 OBD 5 µm 19 × 100 column. Solvents A and B were water with 0.1% formic acid, and acetonitrile, respectively. The method time was 10 min, with a gradient from 10% B to 40% B over 5 min. Samples were loaded at 10% B. The flow rate during the loading was 25 ml min−1 and it was raised to 40 ml min−1 during separation, affording N5-(1-((carboxymethyl) amino)-3-((4-methoxy-2-(methoxycarbonyl)-4-oxobutyl)thio)-1-oxopropan-2-yl)glut amine as a white solid (314 mg, 67.4%). ESI m/z (M + H)+ 466.0. 1H NMR (400 MHz, DMSO-d6) δ 8.70 (t, J = 6.6 Hz, 1H), 8.32 (d, J = 8.6 Hz, 1H), 8.13 (d, J = 1.2 Hz, 1H), 4.43–4.33 (m, 1H), 3.67 (m, 1H), 3.60 (s, 3H), 3.58 (s, 3H), 3.25 (m, 3H, beneath water peak in DMSO), 3.00–2.70 (m, 3H), 2.70–2.56 (m, 3H), 2.28 (m, 2H), 1.95–1.75 (m, 2H).
Synthesis of Ita-GSH conjugate (2-(((2-(4-amino-4-carboxybutanamido)-3-((carboxymethyl)amino)-3-oxopropyl)thio)methyl)succinic acid)
To a vial charged with 2-methylenesuccinic acid (itaconic acid; 0.021 g, 0.163 mmol) was added water (0.651 ml) and GSH (0.05 g, 0.163 mmol). The resulting suspension was heated at 37 °C overnight, affording a pale yellow solution, which was directly purified by RP-HPLC as follows: XSelect Prep C18 5 µm 19 × 100 column. Solvents A and B were water with 0.1% formic acid, and acetonitrile, respectively. The method time was 10 min with a gradient from 5% B to 10% B over 5 min. Samples were loaded at 5% B. The flow rate during the loading and the separation was 40 ml min−1. Mass spectral data were acquired from 200–1000 amu in electrospray positive mode. The product was successfully isolated as 2-(((2-(4-amino-4-carboxybutanamido)-3-((carboxymethyl)amino)-3-oxopropyl)thio)methyl) succinic acid (28.4 mg, 0.065 mmol, 39.9% yield) as a pale white solid. ESI m/z (M + H)+ 437.1. 1H NMR (400 MHz, D2O) δ 4.48 (ddd, J = 8.7, 5.0, 3.3 Hz, 1H), 3.86 (s, 2H), 3.71 (t, J = 6.3 Hz, 1H), 2.97 (ddt, J = 12.1, 9.1, 5.6 Hz, 2H), 2.87–2.52 (m, 5H), 2.43 (td, J = 7.5, 5.4 Hz, 2H), 2.06 (q, J = 7.3 Hz, 2H).
Synthesis of 13C5-DI (13C5-DI)
E. coli ita23 (provided by the Klamt laboratory)31 was allowed to grow in 12C-glucose-LB broth (10 ml of 10 g l−1 bacto-trypsin, 5 g l−1 yeast extract, 10 g l−1 NaCl, 0.28 g l−1 CaCl2, 125 mg l−1 kanamycin and 0.2% (w/v) of 12C-glucose) overnight at 30 °C and 210 r.p.m., until OD420 (the absorbance at 420 nm) reached 2.6. The production of itaconic acid was next initiated by dilution of 100 µl of the above culture into 250 ml of a 13C-glucose minimal media (5.0 g l−1 K2HPO4, 3.5 g l−1 KH2PO4, 3.5 g l−1 (NH3)NaHPO4, 0.25 g l−1 MgSO4, 11.3 mg l−1 CaCl2, 1.5 g l−1 glutamic acid, 0.5 mg l−1 thiamine, 25 mg l−1 kanamycin, 1 ml trace element solution and 0.4% 13C-glucose). The trace element solution consists of 1.6 g l−1 FeCl3, 0.2 g l−1 CoCl2·6H2O, 0.1 g l−1 CaCl2, 0.2 g l−1 ZnCl2·4H2O, 0.2 g l−1 NaMoO4, 0.05 g l−1 H3BO3. The bacteria were allowed to grow for 6 days until the OD420 reached 1.9–2.1. The cells were pelleted by centrifugation for 30 min at 14,000g and 4 °C. The supernatant was collected and lyophilized to afford a white powder (3.78 g). The powder was re-dissolved in distilled H2O (10 ml) and the pH reduced to 2 using concentrated HCl (around 0.5 ml). 13C-labelled itaconate was extracted into ethyl acetate (4 × 15 ml). The combined organic layers were dried over anhydrous Na2SO4 and concentrated in vacuo to afford 13C-labelled itaconate as an off-white solid (283 mg, 1.1 g per litre of culture). 1H NMR (d6-DMSO, 500 MHz) δ 12.38 (br s, 2H, -COOH), 6.30–5.92 (m, 1H, H-2a), 5.71 (ddd, 1H, 1JHC: 158.8 Hz, 2JHC: 12.0 Hz, 3JHC: 5.9 Hz, H-2b), 3.38–3.03 (m, 2H, H-4); 13C NMR (d6-DMSO, 125 MHz) δ 172.0 (dt, 1JCC: 55.7 Hz, 2JCC: 2.6 Hz, C-1), 167.5 (d, 1JCC: 68.8 Hz, C-5), 135.3 (tdd, 1JCC: 69.1 Hz, 1JCC: 46.7 Hz, 2JCC: 2.8 Hz, C-3), 127.4 (d, 1JCC: 70.8 Hz, C-2), 38.1–36.5 (m, C-4) HR-MS 13C5H6O4 (M + Na)+ calcd. 158.0326, found 158.0328.
The reactant 13C-itaconic acid (0.10 g, 9.5 mmol) was dissolved in methanol (1 ml). To this solution was added one drop of concentrated H2SO4 and the mixture was refluxed overnight (16 h). The reaction was quenched with saturated NaHCO3 (1 ml), then extracted into dichloromethane (2 × 2 ml). The combined organic layers were dried over anhydrous Na2SO4 to afford a brown liquid. Yield: 97 mg, 80%. 1H NMR (CDCl3, 300 MHz) δ 6.62–6.00 (m, 1H, H-2a), 6.00–5.36 (m, 1H, H-2b), 3.74 (d, 3H, 3JHC: 3.8 Hz, H-6), 3.67 (d, 2H, 3JHC: 3.9 Hz, H-7), 3.60–2.99 (m, 2H, H-4); 13C NMR (CDCl3, 75 MHz) δ 172.0–170.6 (m, C-1), 167.5–166.0 (m, C-5), 133.9 (tdd, 1JCC: 71.9 Hz, 2JCC 46.5 Hz, 3JCC 3.0 Hz, C-3), 130.0–127.2 (m, C-2), 52.4–52.3 (m, C-6), 52.3–52.2 (m, C-7), 38.7–36.7 (m, C-4) HR-MS C2 13C5H10O4 (M + Na)+ calcd. 168.0639, found 168.0638.
Protein mass spectrometry
BMDMs were plated 2 × 10⁶ cells per well in 6-well plates. Cells were subjected to one of the following: (1) treated with DI (250 µM) for 12 h and then stimulated with LPS (100 ng ml−1) for 1 h, or (2) only stimulated with LPS (100 ng ml−1) for 1 h, or (3) only treated with DI (250 µM) for 12 h, or (4) treated with neither DI nor LPS. Cells were then washed three times with PBS and lysed in 200 µl of urea buffer (8 M urea, 75 mM NaCl, 50 mM Tris pH 8.0, 1 mM EDTA). Lysates were then cleared by centrifugation at 20,000g and protein concentrations were determined by BCA assay (Pierce). 15 µg of total protein per sample were processed further. Disulfide bonds were reduced with 5 mM dithiothreitol and cysteines were subsequently alkylated with 10 mM iodoacetamide. Samples were diluted 1:4 with 50 mM Tris-HCl (pH 8.0) and sequencing grade modified trypsin (Promega) was added in an enzyme-to-substrate ratio of 1:50. After 16 h of digestion, samples were acidified with 1% formic acid (final concentration). Tryptic peptides were desalted on C18 StageTips32 and evaporated to dryness in a vacuum concentrator. Desalted peptides were labelled with the TMT10plex mass tag labelling reagent according to the manufacturer’s instructions (Thermo Scientific) with small modifications. In brief, 0.2 units of TMT10plex reagent was used per 15 µg of sample. Peptides were dissolved in 30 µl of 50 mM HEPES pH 8.5 solution and the TMT10plex reagent was added in 12.3 µl of MeCN. After 1 h incubation the reaction was stopped with 2.5 µl 5% hydroxylamine for 15 min at 25 °C. Differentially labelled peptides were mixed for each replicate and subsequently desalted on C18 StageTips32 and evaporated to dryness in a vacuum concentrator.
The peptide mixtures were fractionated by strong cation exchange (SCX) using StageTips as previously described32 with slight modifications. In brief, one StageTip was prepared per sample by 3 SCX discs (3 M, cat. no. 2251) topped with 2 C18 discs (3 M, cat. no. 2215). The packed StageTips were first washed with 100 µl methanol and then with 100 µl 80% acetonitrile and 0.2% formic acid. Afterwards they were equilibrated by 100 µl 0.2% formic acid and the sample was loaded onto the discs. The sample was transeluted from the C18 discs to the SCX discs by applying 100 µl 80% acetonitrile; 0.2% formic acid, which was followed by three stepwise elutions and collections of the peptide mix from the SCX discs. The first fraction was eluted with 50 µl of 50 mM NH4AcO, 20% MeCN (pH ~7.2); the second with 50 µl 50 mM NH4HCO3, 20% MeCN (pH ~8.5) and the third with 50 µl 0.1% NH4OH, 20% MeCN (pH ~9.5). 200 µl of 0.2% acetic acid was added to each of the three fractions and they were subsequently desalted on C18 StageTips as previously described32 and evaporated to dryness in a vacuum concentrator. Peptides were reconstituted in 10 µl 0.2% formic acid. Both the unfractionated samples and the fractionated, less complex samples were then analysed by LC–MS/MS on a Q Exactive HF as previously described33,34. In brief, around 1 µg of total peptides were analysed on an Eksigent nanoLC-415 HPLC system (Sciex) coupled via a 25-cm C18 column (inner diameter of 100 µm, packed in-house with 2.4 µm ReproSil-Pur C18-AQ medium, Dr. Maisch GmbH) to a benchtop Orbitrap Q Exactive HF mass spectrometer (Thermo Fisher Scientific). Peptides were separated at a flow rate of 200 nl min−1 with a linear 206-min gradient from 2% to 25% solvent B (100% acetonitrile, 0.1% formic acid), followed by a linear 5-min gradient from 25 to 85% solvent B. Each sample was run for 270 min, including sample loading and column equilibration times. Data were acquired in data-dependent mode using Xcalibur 2.8 software. MS1 spectra were measured with a resolution of 60,000, an automatic gain control target of 3e6 and a mass range from 375 to 2000 m/z. Up to 15 MS2 spectra per duty cycle were triggered at a resolution of 60,000, an automatic gain control target of 2e5, an isolation window of 1.6 m/z and a normalized collision energy of 36.
All raw data were analysed with MaxQuant software35 version 1.6.0.16 using a UniProt Mus musculus database (downloaded on 16 May 2017), and MS/MS searches were performed with the following parameters: The five mass spec runs were grouped together. TMT11plex labelling on the MS2 level, oxidation of methionine, deamidation of asparagine and protein N-terminal acetylation as variable modifications; carbamidomethylation as fixed modification; Trypsin/P as the digestion enzyme; precursor ion mass tolerances of 20 p.p.m. for the first search (used for nonlinear mass re-calibration) and 4.5 p.p.m. for the main search, and a fragment ion mass tolerance of 20 p.p.m. For identification, we applied a maximum false discovery rate of 1% separately on protein and peptide level. We required one or more unique/razor peptides for protein identification and a ratio count for each of the 10 TMT channels. This gave us a total of 4,123 quantified protein groups.
Finally, we normalized the MaxQuant-generated corrected TMT intensities such that at each condition or time point the corrected TMT intensity values added up to exactly 1,000,000, therefore each protein group value can be regarded as a normalized microshare (we did this separately for each TMT channel for all proteins that made our filter cutoff in all the TMT channels. After that we added a pseudocount of 1 to each intensity value in order to account for the noise level and make our fold-change calls more robust for small intensity values. Finally, we log2-transformed all values and took the average of the log2 values for all replicates per condition (if replicate samples were present).
Metabolic labelling of nascent protein synthesis with click chemistry
BMDMs were grown in 12-well plates, 106 cells per well and treated with DI (250 µM) for 10 h. The cells were then washed three times with methionine-deficient media and incubated for 1 h without methionine in the presence of 200 µM DI. After that, l-azidohomoalanine (Click-iT AHA, C10102, Invitrogen) was added directly to cell media to a final concentration of 50 µM. The cells were then stimulated with LPS for 1 h. In some samples, cells were treated with puromycin (5 µg ml−1) for 2 h before LPS stimulation to block translation. Cells were lysed in 100 µl of lysis buffer (50 mM Tris-HCl, pH 8, 1% SDS) supplemented with protease inhibitor cocktail, phenylmethylsulfonyl fluoride and Na3VO4 (Santa Cruz Biotechnology). Lysates were incubated on ice for 30 min, sonicated and cleared by centrifugation at 13,000g for 5 min at 4 °C. Total protein concentration was determined using an RC/DC Protein Assay (Bio-Rad). 30 µg of protein was used for the downstream reaction with 40 nM biotin–alkyne (B10185, Invitrogen) and the reaction was carried out in Click-iT Protein Reaction Buffer Kit (C10276, Invitrogen) according to the manufacturer’s protocol. Proteins were separated on 4–20% polyacrylamide gradient gels (Bio-Rad) and biotinylated proteins were detected by western blot with a streptavidin–HRP conjugate (1:1000, #554066, BD Pharmingen). The membrane was stripped using 0.2 M NaOH and reprobed to detect IκBζ (see ‘Western blots’).
Glutathione measurement
The total GSH concentration in cells was determined by a GSH/GSSH Ratio Detection Assay Kit (Abcam) according to the manufacturer’s protocol. In brief, 106 BMDMs were lysed in 100 µl of 0.5% NP-40 in PBS, pH 6. Samples were deproteinized using trichloroacetic acid and neutralized by the addition of 1 M NaHCO3 to achieve pH values of 4–6. Collected extracts were diluted with the supplied assay buffer and used directly for GSH measurement.
Cytokine detection
Cytokines in cell supernatants were analysed using DuoSet ELISA kits according to the manufacturer’s protocol (R&D Systems). The supernatants from BMDMs were diluted 1:4, those from human blood monocytes were diluted 1:3.
RNA isolation and quantitative real-time PCR
RNA from cultured cells was isolated using a Total RNA I kit (Omega). RNA from the skin of mouse ears was extracted using an RNeasy mini kit (Qiagen) after tissue disruption with sterile zirconium beads on a MagNA Lyser (Roche). Isolated RNA was reverse-transcribed using AffinityScript Multi-Temp reverse transcriptase (Agilent Technologies) according to the manufacturer’s protocol. Reactions were performed in 96-well plates using a SYBR Green PCR Master mix (Thermo Fisher Scientific) using a LightCycler 96 or LightCycler 480 (Roche Diagnostics). All assays were performed at least in duplicate, and reaction mixtures in 20-µl volumes (96-plate) or 10-µl volumes (384-plate) were processed under the following cycling conditions: initial 10 min denaturation at 95 °C, followed by 40 cycles at 95 °C for 10 s, 60 °C for 1 min. Threshold cycle values for each sample were determined by automated threshold analysis. Expression levels of all mRNAs were normalized to reference gene Actb in BMDMs or to Rpl19 in mouse keratinocytes and tissue samples; to ACTB in human blood monocytes or RPLP0 in human keratinocytes. The relative increase in the expression level of a gene was normalized to the level of expression in unstimulated control cells in each experiment. Primer pairs used are listed in Supplementary Table 1. IκBζ-dependent genes selected for analysis in macrophages have been published previously36.
Lentiviral transduction
Mouse Nfkbiz 3′ UTR Lenti-reporter-GFP (#MTm64048) vector or pLenti-UTR-GFP-Blank vector (#m014) were purchased from Applied Biological Materials. For lentiviral production, a transfection mixture of 1.5 ml of Opti-MEM medium (Invitrogen), 18 µg of psPAX2 (gift from D. Trono, Addgene plasmid #12260), 13 µg of pCMV-V-SVG (gift from B. Weinberg, Addgene plasmid #8454)37, 20 µg of lentiviral construct, and 105 µl of polyethylenimine (1 mg ml−1, 25 kDa, linear form, Polysciences) was used. The mixture was incubated at room temperature for 20 min and added to HEK-293T cells (ATCC) cultured in DMEM supplemented with 10% FBS, 2 mM l-glutamine and 100 U ml−1 penicillin–streptomycin in a 150 cm2 tissue-culture flask. After 48 h, virus-containing medium was filtered through cellulose acetate filters (45 µm pore-size) and used directly for BV2 transduction in the presence of polybrene (8 µg ml−1, Millipore). The next day, the medium was replaced and two days after this the cells were selected with puromycin at 5 µg ml−1.
Flow cytometry
For measurements of reactive oxygen species, cells were treated with DI (250 µM), loaded with 10 µM CM-H2DCFDA (Invitrogen) at room temperature for 30 min in Hank’s balanced salt solution (HBSS). After incubation, cells were rinsed with warm HBSS, collected and directly analysed. The mean fluorescent intensity of living cells is shown. For Nfkbiz 3′ UTR reporter analysis, the GFP signal was determined in live cells. For analysis of cell viability, cells were stained with propidium iodide (1 µg ml−1) and the percentage of negative cells was plotted. Cells were acquired on CantoII or LSRII flow cytometers (Becton Dickinson), and data were analysed with FlowJo v.9.5.2 software (Tree Star). For the gating strategy, see Supplementary Fig. 2.
Confocal microscopy
BMDMs were seeded at 8-well multitest microscopy slides (MP Biomedicals). Cells were treated with DI (250 µM, 12 h) and then stimulated with LPS (100 ng ml−1, 30 min). The cells were fixed with 3% paraformaldehyde in PBS for 30 min and permeabilized with 0.1% Triton X-100 in PBS for 15 min. After washing with PBS, samples were blocked with 1% BSA for 15 min and subsequently labelled with p65-specific antibody (1:50, #8242, Cell Signaling), followed by AF568-conjugated anti-rabbit secondary antibody (1:500, #A11011, Thermo Fisher Scientific) in PBS containing 1% BSA. After labelling, the cells were washed with PBS and mounted in 50% (w/v) glycerol in PBS, pH 8.5 containing 4′,6-diamidino-2-phenylindole (DAPI; 1 µg ml−1, Sigma) to label nuclei. Images of random fields of view were acquired using a Leica DMi8 confocal microscope (Leica Microsystems) equipped with a HC PL APO 40×/1.3 NA oil immersion objective and exported with LAS AF Lite software (Leica).
Human blood monocytes isolation and treatment
Blood from healthy donors was acquired from leukoreduction chambers supplied by the Mississippi Valley Regional Blood Center. Peripheral blood mononuclear cells from buffy coats were recovered from the Ficoll interface after a 400g centrifugation for 30 min. Monocytes were isolated by adherence on a cell-culture dish for 1 h at 37 °C and 5% CO2 in RPMI containing 1% human serum albumin (Albutein). After extensive washes to remove non-adherent cells, monocytes (≥95% purity) were collected, counted and 5 × 10⁵ cells were plated per well in 24-well plates. The cells were treated with DI (125 µM unless stated otherwise) for 12 h and stimulated with LPS (100 ng ml−1) for 1 h or as indicated. In some experiments cells were treated with DI in the presence of EtGSH (1 mM, Santa Cruz Biotechnology).
Primary mouse and human keratinocytes
Primary keratinocytes were isolated from C57BL/6 wild-type newborn mice or human foreskins as previously described38. 2 × 10⁵ cells in 1 ml of KFSM media (Gibco 10725-018) (Ca2+ concentrations of 0.05 mM (mouse) and 0.09 mM (human)) were plated in 12-well tissue culture plates. After 2–3 days of cultivation, mouse or human cells were treated with DI for 12 h and then stimulated with mouse recombinant IL-17A (100 ng ml−1; cat. no. 421-ML, R&D Systems) or human recombinant IL-17A (100 ng ml−1; 7955-IL, R&D Systems) for 4 h or as indicated.
IMQ-induced psoriasis
To induce experimental psoriasis39, imiquimod (IMQ; imiquimod cream 5%, Perrigo. Co.) was applied daily to mice on both ears (~5 mg per ear) for 7 days. For the DI-treated mice, DI was administered via the intraperitoneal route at 20 mg in 500 µl sterile PBS per mouse one day before IMQ application and daily thereafter for seven days. After seven days, mice were euthanized and ears were used for RNA extraction or histological analysis by performing haematoxylin and eosin staining on 7-µm thick sections after paraffin embedding. The average ear thickness in each sample was quantified from images obtained at identical settings using ImageJ27,28. Thickness at five equidistant places in each image was quantified and the mean of these values was used to represent results in each mouse.
SDH activity in mouse heart and liver
DI was administered to mice via the intraperitoneal route at 20 mg in 500 µl sterile PBS per mouse, either once per day for a total length of four days (DI daily) or every 2 h, three times in total (DI overdose). For the daily DI administration, the last injection was 6 h before the tissue collection, and in the DI overdose protocol the last injection was 2 h before collection. Mice were euthanized and heart (~50 mg) and liver tissue (~200 mg) were collected, washed in PBS and mitochondria were isolated with Mitochondria Isolation Kit for Tissue (#89801, Thermo Scientific) according to the manufacturer’s protocol. For the analysis of mitochondrial purity, cytoplasmic and mitochondrial fractions were diluted with reducing sample buffer and analysed by western blot for the presence of SDH and GAPDH (see ‘Western blots’). SDH activity in isolated mitochondria was analysed using an SDH Activity Colorimetric Kit (#MAK197, Sigma). Isolated mitochondria were directly resuspended in SDH assay buffer. In parallel, protein concentration in each sample was determined using RC/DC Protein Assay (Bio-Rad) and activity was normalized to protein concentration.
Statistical analysis
Unless stated otherwise, standard statistical analyses were performed using MS Excel or GraphPad Prism 7. The type and number of replicates and the statistical tests used are described in the figure legends. Exact P values are shown where determined. Individual data points are shown, and the mean ± s.e.m. is reported for analyses where n > 2, only the mean is reported where n ≤ 2.
Reporting summary
Further information on experimental design is available in the Nature Research Reporting Summary linked to this paper.
Data availability
The raw and processed RNA-seq data have been deposited in the Gene Expression Omnibus with accession numbers GSE102190 and GSE110749. The original mass spectra may be downloaded from MassIVE (http://massive.ucsd.edu) using the identifier MSV000082101. Source data for the graphical representations found in all figures and Extended Data figures are provided. Source data for western blots (uncropped and unprocessed scans with size marker indications) are presented in Supplementary Fig. 1. All other data that support the findings of this study are available from the corresponding author upon reasonable request.
Extended Data
Extended Data Fig. 1. Detection of DI-GSH and Ita-GSH and electrophilic stress response.
a, Transcriptional comparison of KpCKO and wild-type BMDMs and enrichment of the DI gene signature. b, The reaction of DI with a thiol group in a Michael reaction. c, DI levels in media of BMDMs treated with DI for the indicated time, as determined by GC–MS. Mean of n = 2 cultures. d, Levels of the DI-GSH conjugate in the media of BMDMs treated with DI for the indicated time, as detected by LC–MS. Mean of n = 2 cultures. Data from Fig. 1e are overlaid with data for cell-free media. e, Levels of DI-GSH conjugate in BMDMs (left) and in their media (right) after treatment with 13C5-labelled DI for the indicated time, as detected by LC–MS. Mean of n = 2 cultures. f, g, Representative extracted ion chromatograms of DI-GSH detected in the media of BMDMs treated with DI for 6 h compared to the synthesized DI-GSH standard (f), and Ita-GSH detected in BMDMs stimulated with LPS for 24 h compared to the synthesized Ita-GSH standard (g). n = 10 technical replicates. h, Detection of reactive oxygen species in BV2 cells treated with DI for the indicated time, as determined by flow cytometry. Mean of n = 2 experiments. i, Cytokine production in BMDMs treated with DI in the presence of EtGSH and stimulated with LPS for 4 h, mean ± s.e.m., n = 3 experiments. j, Western blot of HO-1 expression in BMDMs treated with DMF. Representative of three experiments. For gel source data, see Supplementary Fig. 1. Statistical tests used were two-tailed t-tests.
Extended Data Fig. 2. DI downregulates secondary transcriptional response to TLR stimulation.
a, Western blot of IκBζ expression in wild-type or Nfkbiz−/− BMDMs stimulated with LPS. b, Cytokine production in wild-type and Nfkbiz−/− BMDMs stimulated with LPS for 4 h, mean ± s.e.m., n = 3 experiments. c, RNA-seq analysis of BMDMs treated with DI and stimulated with LPS and IFNγ. d, mRNA expression show the induction of the indicated target genes in wild-type and Nfkbiz−/− BMDMs treated with DI and stimulated with LPS for 4 h, mean ± s.e.m., n = 3 experiments. e, Western blot of IκBζ expression in DI-treated BMDMs stimulated with LPS for 1 h. f, mRNA expression in human blood monocytes treated with DI and stimulated with LPS. g, Western blot of IκBζ expression in human blood monocytes treated with DI and stimulated with LPS. h, i, Western blot of IκBα (h) and IRAK1 expression and IKK phosphorylation (i) in BMDMs treated with DI and stimulated with LPS. j, p65 localization in DI-treated, LPS-stimulated BMDMs. Nuclei are stained with DAPI. Scale bars, 25 µm. Representative of two cultures. k, Western blot of IκBζ expression in BMDMs treated with DI in the presence of EtGSH and stimulated with LPS for 1 h. l, Western blot of IκBζ expression in human blood monocytes treated with DI in the presence of EtGSH and stimulated with LPS for 1 h. m, Cytokine production in wild-type or Nfkbiz−/− BMDMs treated with DI in the presence of NAC, stimulated with LPS for 4 h. Mean of n = 2 cultures. Representative data from two experiments (a), three experiments (e, h, i, k), three donors (f, g) and two donors (l). For gel source data, see Supplementary Fig. 1. Statistical tests used were two-tailed t-tests.
Extended Data Fig. 3. DI regulates IκBζ at the post-transcriptional level.
a, Comparison of the effects of DI on IL-6, TNF and IκBζ on the protein and mRNA levels. Cytokine production is shown in BMDMs treated with DI (left) or DMF (middle) and stimulated with LPS for 4 h (DI), mean of n = 2 experiments, or 24 h (DMF), mean ± s.e.m., n = 3 experiments. Right, densitometric quantification of IκBζ protein and mRNA expression is shown for BMDMs treated with DI, stimulated with LPS for 1 h. Mean of n = 3 experiments, mRNA representative of two experiments. b, Western blot of IκBζ expression in BMDMs treated with DI and stimulated with LPS for 1 h. MG132 or bafilomycin A (BafA) were added 30 min before LPS stimulation. c, Nfkbiz 3′ UTR reporter expressing GFP in BV2 cells treated with DI (250 µM) for 12 h and stimulated with LPS for 1 h. EMPTY vector expressed GFP only; GFP expression determined by flow cytometry. d, Western blot of phosphorylated and total eIF2α in DI-treated BMDMs. e, Western blot of nascent protein synthesis detected using biotin–alkyne click chemistry in BMDMs treated with DI and stimulated with LPS for 1 h. The same membrane was reprobed for IκBζ. Representative of two experiments. f, Densitometric quantification of the biotin signal in the membrane in e. g, log fold change of proteomic signal in unstimulated and LPS-stimulated cells. h, log fold change of transcript and protein. For b–d, data is representative of three experiments.
Extended Data Fig. 4. BSO potentiates the inhibitory effect of DI.
a, Western blot of Nrf2 expression in BMDMs treated with BSO or DI. b, GSH levels in BMDMs treated with BSO and stimulated with LPS. Mean ± s.e.m., n = 3 cultures. c, Cytokine production in BMDMs treated with BSO and stimulated with LPS. Mean ± s.e.m., n = 3 experiments. d, Cytokine production in BMDMs treated with DI and BSO and stimulated with LPS for 4 h. Mean ± s.e.m., n = 3 experiments. e, Cytokine production in BMDMs treated with 4EI (10 mM) and BSO and stimulated with LPS for 4 h. Mean ± s.e.m., n = 3 experiments. f, Western blot of IκBζ expression in BMDMs tolerized with LPS in the presence of BSO for 18 h and restimulated for 1 h (see Fig. 2l), asterisk shows the different exposures. Western blot data are representative of three experiments. For gel source data, see Supplementary Fig. 1. Statistical tests used were two-tailed t-tests.
Extended Data Fig. 5. Nrf2-independent action of DI.
a, Western blot of IκBζ expression in wild-type or Nrf2−/− BMDMs treated with DI and stimulated with LPS for 1 h. b, Western blot of p62 and HO-1 in wild-type or Nrf2−/− BMDMs treated with DI and stimulated with LPS. c, Western blot of IκBζ expression in wild-type and p62-deficient BMDMs treated with DI and stimulated with LPS. d, Western blot of IκBζ expression in wild-type and Hmox1-deficient BMDMs treated with DI and stimulated with LPS. e, Transcriptional comparison of Nrf2−/− and wild-type BMDMs treated with DI and GSEA statistics for unfolded protein response (UPR) and IFNα pathways. f, Pathways regulated by DI in an Nrf2-independent manner. Gene ranks, normalized enrichment score (NES), P and adjusted P (padj) are shown. g, h, Western blot of Nrf2 expression (g) or phosphorylated and total eIF2α (h) in DI-treated wild-type or Atf3−/− BMDMs. i–k, Western blot of ATF3 in BMDMs (i, j) and human blood monocytes (k) treated with DI in combination with NAC or EtGSH and stimulated with LPS. Data are representative of three experiments (a, g, i, j), two experiments (b, c, h), one experiment (d) and from two donors (k). For gel source data, see Supplementary Fig. 1.
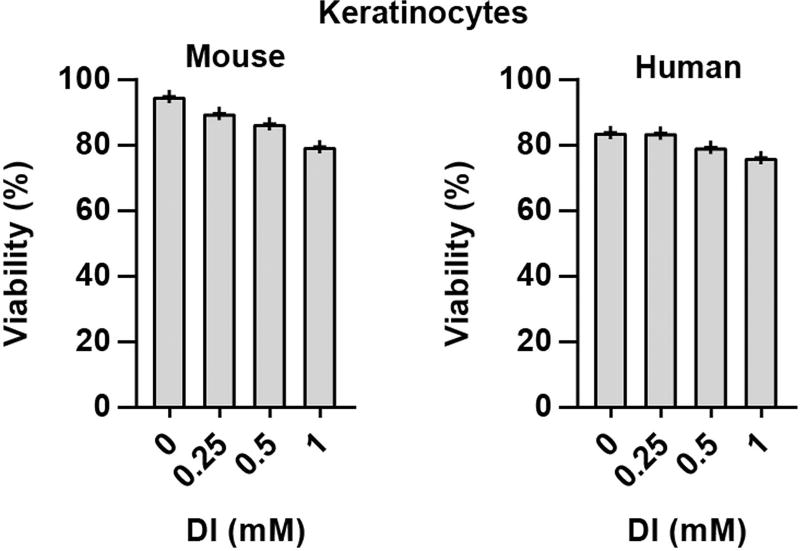
Extended Data Fig. 6. Viability of keratinocytes after DI treatment.
Mouse and human primary keratinocytes were treated with DI for 12 h and viability was determined by propidium iodide staining and flow cytometry. Percentage of propidium iodide-negative cells is shown. Representative of two mice or donors.
Extended Data Fig. 7. DI shows a lack of in vivo toxicity.
a, Schematic of DI administration for the analysis of succinate dehydrogenase (SDH) activity in the heart and the liver. b, SDH activity in the heart and the liver of mice treated as in a. Mean of n = 2 technical replicates. Representative data from two mice. c, Western blot of SDH and GAPDH in mitochondrial and cytoplasmic fractions from the heart and the liver of mice treated as in a. Representative of two mice. For gel source data, see Supplementary Fig. 1.
Supplementary Material
Acknowledgments
We thank H. Virgin for providing p62-deficient mice; I. Schukina, J. Middleton and L. Arthur for technical support; and R. Dolle for assistance. This work was supported by RO1-A1125618 to M.N.A. and MES of Russia (project 2.3300.2017/4.6) to A.Se.
Footnotes
Online content
Any Methods, including any statements of data availability and Nature Research reporting summaries, along with any additional references and Source Data files, are available in the online version of the paper at https://doi.org/10.1038/s41586-018-0052-z.
Author contributions M.B. and M.N.A. conceived and designed the study and wrote the manuscript. M.B. performed western blot, cytokine, cytometry and glutathione analyses, metabolic labelling of protein synthesis and succinate dehydrogenase activity assays. L.G., D.K., M.B. and E.K. designed and performed human blood monocyte experiments. V.L., L.-H.H. and G.J.R. designed and performed in vivo psoriasis model experiments. A.Se. performed RNA-seq data analysis. E.L. prepared RNA-seq libraries and helped with PCR experiments. M.E.M. and C.d.G.S. designed and performed the isolation of mouse and human primary keratinocytes. H.K., K.J., H.B., T.P.R., S.A.B. and K.M.S. designed and performed mass spectrometry metabolomic measurements, and analysis and synthesis of Ita-GSH and DI-GSH conjugates. D.D. and K.A. synthesized 13C5-labelled DI. A.K. and M.J. designed and performed proteomic analysis. A.Sa., R.S.A., T.H., M.P.S., T.S. and S.A. provided animals and bones for the study. R.S. helped with the analysis of the metabolic data. B.J. and G.K.A. designed and performed the initial Nrf2 experiments.
Competing interests M.B., V.L. and M.N.A. are listed as inventors on provisional patent applications regarding the anti-inflammatory properties of itaconate derivatives.
Extended data is available for this paper at https://doi.org/10.1038/s41586-018-0052-z.
Supplementary information is available for this paper at https://doi.org/10.1038/s41586-018-0052-z.
References
- 1.Jha AK, et al. Network integration of parallel metabolic and transcriptional data reveals metabolic modules that regulate macrophage polarization. Immunity. 2015;42:419–430. doi: 10.1016/j.immuni.2015.02.005. [DOI] [PubMed] [Google Scholar]
- 2.Lampropoulou V, et al. Itaconate links inhibition of succinate dehydrogenase with macrophage metabolic remodeling and regulation of inflammation. Cell Metab. 2016;24:158–166. doi: 10.1016/j.cmet.2016.06.004. [DOI] [PMC free article] [PubMed] [Google Scholar]
- 3.Cordes T, et al. Immunoresponsive gene 1 and itaconate inhibit succinate dehydrogenase to modulate intracellular succinate levels. J. Biol. Chem. 2016;291:14274–14284. doi: 10.1074/jbc.M115.685792. [DOI] [PMC free article] [PubMed] [Google Scholar]
- 4.Gorrini C, Harris IS, Mak TW. Modulation of oxidative stress as an anticancer strategy. Nat. Rev. Drug Discov. 2013;12:931–947. doi: 10.1038/nrd4002. [DOI] [PubMed] [Google Scholar]
- 5.Kobayashi EH, et al. Nrf2 suppresses macrophage inflammatory response by blocking proinflammatory cytokine transcription. Nat. Commun. 2016;7:11624. doi: 10.1038/ncomms11624. [DOI] [PMC free article] [PubMed] [Google Scholar]
- 6.Sullivan LB, et al. The proto-oncometabolite fumarate binds glutathione to amplify ROS-dependent signaling. Mol. Cell. 2013;51:236–248. doi: 10.1016/j.molcel.2013.05.003. [DOI] [PMC free article] [PubMed] [Google Scholar]
- 7.Zheng L, et al. Fumarate induces redox-dependent senescence by modifying glutathione metabolism. Nat. Commun. 2015;6:6001. doi: 10.1038/ncomms7001. [DOI] [PMC free article] [PubMed] [Google Scholar]
- 8.Medzhitov R, Horng T. Transcriptional control of the inflammatory response. Nat. Rev. Immunol. 2009;9:692–703. doi: 10.1038/nri2634. [DOI] [PubMed] [Google Scholar]
- 9.Yamamoto M, et al. Regulation of Toll/IL-1-receptor-mediated gene expression by the inducible nuclear protein IκBζ. Nature. 2004;430:218–222. doi: 10.1038/nature02738. [DOI] [PubMed] [Google Scholar]
- 10.Dhamija S, et al. IL-1-induced post-transcriptional mechanisms target overlapping translational silencing and destabilizing elements in IκBζ mRNA. J. Biol. Chem. 2010;285:29165–29178. doi: 10.1074/jbc.M110.146365. erratum 291, 24801 (2016) [DOI] [PMC free article] [PubMed] [Google Scholar]
- 11.Harding HP, et al. An integrated stress response regulates amino acid metabolism and resistance to oxidative stress. Mol. Cell. 2003;11:619–633. doi: 10.1016/s1097-2765(03)00105-9. [DOI] [PubMed] [Google Scholar]
- 12.Komatsu M, et al. The selective autophagy substrate p62 activates the stress responsive transcription factor Nrf2 through inactivation of KEAP1. Nat. Cell Biol. 2010;12:213–223. doi: 10.1038/ncb2021. [DOI] [PubMed] [Google Scholar]
- 13.Otterbein LE, Soares MP, Yamashita K, Bach FH. Heme oxygenase-1: unleashing the protective properties of heme. Trends Immunol. 2003;24:449–455. doi: 10.1016/s1471-4906(03)00181-9. [DOI] [PubMed] [Google Scholar]
- 14.Gilchrist M, et al. Systems biology approaches identify ATF3 as a negative regulator of Toll-like receptor 4. Nature. 2006;441:173–178. doi: 10.1038/nature04768. [DOI] [PubMed] [Google Scholar]
- 15.Labzin LI, et al. ATF3 is a key regulator of macrophage IFN responses. J. Immunol. 2015;195:4446–4455. doi: 10.4049/jimmunol.1500204. [DOI] [PubMed] [Google Scholar]
- 16.Okuma A, et al. Enhanced apoptosis by disruption of the STAT3-IκB-ζ signaling pathway in epithelial cells induces Sjögren’s syndrome-like autoimmune disease. Immunity. 2013;38:450–460. doi: 10.1016/j.immuni.2012.11.016. [DOI] [PubMed] [Google Scholar]
- 17.Muromoto R, et al. IL-17A plays a central role in the expression of psoriasis signature genes through the induction of IκB-ζ in keratinocytes. Int. Immunol. 2016;28:443–452. doi: 10.1093/intimm/dxw011. [DOI] [PubMed] [Google Scholar]
- 18.Johansen C, et al. IκBζ is a key driver in the development of psoriasis. Proc. Natl Acad. Sci. USA. 2015;112:E5825–E5833. doi: 10.1073/pnas.1509971112. [DOI] [PMC free article] [PubMed] [Google Scholar]
- 19.Tsoi LC, et al. Enhanced meta-analysis and replication studies identify five new psoriasis susceptibility loci. Nat. Commun. 2015;6:7001. doi: 10.1038/ncomms8001. [DOI] [PMC free article] [PubMed] [Google Scholar]
- 20.Okada K, et al. The α-glucosidase inhibitor acarbose prevents obesity and simple steatosis in sequestosome 1/A170/p62 deficient mice. Hepatol. Res. 2009;39:490–500. doi: 10.1111/j.1872-034X.2008.00478.x. [DOI] [PubMed] [Google Scholar]
- 21.Parada E, et al. The microglial α7-acetylcholine nicotinic receptor is a key element in promoting neuroprotection by inducing heme oxygenase-1 via nuclear factor erythroid-2-related factor 2. Antioxid. Redox Signal. 2013;19:1135–1148. doi: 10.1089/ars.2012.4671. [DOI] [PMC free article] [PubMed] [Google Scholar]
- 22.Hartman MG, et al. Role for activating transcription factor 3 in stress-induced beta-cell apoptosis. Mol. Cell. Biol. 2004;24:5721–5732. doi: 10.1128/MCB.24.13.5721-5732.2004. [DOI] [PMC free article] [PubMed] [Google Scholar]
- 23.Vincent EE, et al. Mitochondrial phosphoenolpyruvate carboxykinase regulates metabolic adaptation and enables glucose-independent tumor growth. Mol. Cell. 2015;60:195–207. doi: 10.1016/j.molcel.2015.08.013. [DOI] [PubMed] [Google Scholar]
- 24.Sergushichev A. An algorithm for fast preranked gene set enrichment analysis using cumulative statistic calculation. 2016 Preprint at https://www.biorxiv.org/content/early/2016/06/20/060012.
- 25.Ritchie ME, et al. limma powers differential expression analyses for RNA-sequencing and microarray studies. Nucleic Acids Res. 2015;43:e47. doi: 10.1093/nar/gkv007. [DOI] [PMC free article] [PubMed] [Google Scholar]
- 26.McGuire VA, et al. Dimethyl fumarate blocks pro-inflammatory cytokine production via inhibition of TLR induced M1 and K63 ubiquitin chain formation. Sci. Rep. 2016;6:31159. doi: 10.1038/srep31159. [DOI] [PMC free article] [PubMed] [Google Scholar]
- 27.Schindelin J, et al. Fiji: an open-source platform for biological-image analysis. Nat. Methods. 2012;9:676–682. doi: 10.1038/nmeth.2019. [DOI] [PMC free article] [PubMed] [Google Scholar]
- 28.Rueden CT, et al. ImageJ2: ImageJ for the next generation of scientific image data. BMC Bioinformatics. 2017;18:529. doi: 10.1186/s12859-017-1934-z. [DOI] [PMC free article] [PubMed] [Google Scholar]
- 29.Lu W, et al. Metabolomic analysis via reversed-phase ion-pairing liquid chromatography coupled to a stand alone Orbitrap mass spectrometer. Anal. Chem. 2010;82:3212–3221. doi: 10.1021/ac902837x. [DOI] [PMC free article] [PubMed] [Google Scholar]
- 30.Sahil, et al. ElucidataInc/ElMaven: El-MAVEN v0.2.2. 2017 [Google Scholar]
- 31.Harder B-J, Bettenbrock K, Klamt S. Model-based metabolic engineering enables high yield itaconic acid production by Escherichia coli. Metab. Eng. 2016;38:29–37. doi: 10.1016/j.ymben.2016.05.008. [DOI] [PubMed] [Google Scholar]
- 32.Rappsilber J, Mann M, Ishihama Y. Protocol for micro-purification, enrichment, pre-fractionation and storage of peptides for proteomics using StageTips. Nat. Protoc. 2007;2:1896–1906. doi: 10.1038/nprot.2007.261. [DOI] [PubMed] [Google Scholar]
- 33.Cheng Z, et al. Pervasive, coordinated protein-level changes driven by transcript isoform switching during meiosis. Cell. 2018;172:910–923.e16. doi: 10.1016/j.cell.2018.01.035. [DOI] [PMC free article] [PubMed] [Google Scholar]
- 34.Keshishian H, et al. Multiplexed, quantitative workflow for sensitive biomarker discovery in plasma yields novel candidates for early myocardial injury. Mol. Cell. Proteomics. 2015;14:2375–2393. doi: 10.1074/mcp.M114.046813. [DOI] [PMC free article] [PubMed] [Google Scholar]
- 35.Cox J, Mann M. MaxQuant enables high peptide identification rates, individualized p.p.b.-range mass accuracies and proteome-wide protein quantification. Nat. Biotechnol. 2008;26:1367–1372. doi: 10.1038/nbt.1511. [DOI] [PubMed] [Google Scholar]
- 36.Hildebrand DG, et al. IκBζ is a transcriptional key regulator of CCL2/MCP-1. J. Immunol. 2013;190:4812–4820. doi: 10.4049/jimmunol.1300089. [DOI] [PubMed] [Google Scholar]
- 37.Stewart SA, et al. Lentivirus-delivered stable gene silencing by RNAi in primary cells. RNA. 2003;9:493–501. doi: 10.1261/rna.2192803. [DOI] [PMC free article] [PubMed] [Google Scholar]
- 38.de Guzman Strong C, et al. A milieu of regulatory elements in the epidermal differentiation complex syntenic block: implications for atopic dermatitis and psoriasis. Hum. Mol. Genet. 2010;19:1453–1460. doi: 10.1093/hmg/ddq019. [DOI] [PMC free article] [PubMed] [Google Scholar]
- 39.van der Fits L, et al. Imiquimod-induced psoriasis-like skin inflammation in mice is mediated via the IL-23/IL-17 axis. J. Immunol. 2009;182:5836–5845. doi: 10.4049/jimmunol.0802999. [DOI] [PubMed] [Google Scholar]
Associated Data
This section collects any data citations, data availability statements, or supplementary materials included in this article.
Supplementary Materials
Data Availability Statement
The raw and processed RNA-seq data have been deposited in the Gene Expression Omnibus with accession numbers GSE102190 and GSE110749. The original mass spectra may be downloaded from MassIVE (http://massive.ucsd.edu) using the identifier MSV000082101. Source data for the graphical representations found in all figures and Extended Data figures are provided. Source data for western blots (uncropped and unprocessed scans with size marker indications) are presented in Supplementary Fig. 1. All other data that support the findings of this study are available from the corresponding author upon reasonable request.


