

Abstract
Aims
Activation of the renin–angiotensin system (RAS), renal oxidative stress and inflammation are constantly present in experimental hypertension. Nitric oxide (NO) inhibition with Nw-nitro-L-arginine methyl ester (L-NAME) has previously been reported to produce hypertension, increased expression of Angiotensin II (Ang II) and renal dysfunction. The use of Losartan, an Ang II type 1 receptor (AT1R) antagonist has proven to be effective reducing hypertension and renal damage; however, the mechanism by which AT1R blockade reduced kidney injury and normalizes blood pressure in this experimental model is still complete unknown. The current study was designed to test the hypothesis that AT1R activation promotes renal NAD(P)H oxidase up-regulation, oxidative stress and cytokine production during L-NAME induced-hypertension.
Main methods
Male Sprague–Dawley rats were distributed in three groups: L-NAME, receiving 70 mg/100 ml of L-NAME, L-NAME + Los, receiving 70 mg/100 ml of L-NAME and 40 mg/kg/day of Losartan; and Controls, receiving water instead of L-NAME or L-NAME and Losartan.
Key findings
After two weeks, L-NAME induced high blood pressure, renal overexpression of AT1R, NAD(P)H oxidase sub-units gp91, p22 and p47, increased levels of oxidative stress, interleukin-6 (IL-6) and interleukin-17 (IL-17). Also, we found increased renal accumulation of lymphocytes and macrophages. Losartan treatment abolished the renal expression of gp91, p22, p47, oxidative stress and reduced NF-κB activation and IL-6 expression.
Significance
These findings indicate that NO induced-hypertension is associated with up-regulation of NADPH oxidase, oxidative stress production and overexpression of key inflammatory mediators. These events are associated with up-regulation of AT1R, as evidenced by their reversal with AT1R blocker treatment.
Keywords: AT1R, L-NAME, Hypertension, NADPH, IL-6, IL-17
Introduction
Activation of the renin–angiotensin system (RAS), renal inflammation and oxidative stress are characteristic findings playing a key role in the pathogenesis of hypertension. Angiotensin II (Ang II) promotes inflammatory response and reactive oxygen species (ROS) production [1–3], via Ang II type 1 receptor (AT1R) [4]. An important finding about the role of AT1R in hypertension was demonstrated using a kidney cross-transplantation strategy [5]. Similarly, it has been found that genetic hypertension in rats is associated with renal up-regulation of AT1R [6].
During hypertension induced by nitric oxide (NO) inhibition, intrarenal RAS activation is characterized by increased expression of Ang II [7], and it has also been associated with increased proximal sodium reabsorption [8].
Many of the effects of Ang II are potentiated by ROS production. Angiotensin II is associated to increased oxidative stress, mainly via nicotinamide adenine dinucleotide phosphate (NAD(P)H) oxidase activation, main enzymes involved in the generation of ROS [9,10], leading to renal cell hypertrophy [11]. Renal NAD(P)H oxidase activity increases during hypertension [12–14]. The molecular mechanisms of the activation of Ang-II during hypertension involve the stimulation of NAD(P)H oxidase, and the expression of AT1R is redox-dependent, therefore overproduction of ROS during hypertension may result in the over-expression of AT1R and vice versa.
In addition, Ang-II elicits a strong immune response via AT1R which are expressed in immunocompetent cells [15]. Angiotensin II modulates the immune response by inducing T cell proliferation [16], while in vivo the pharmacological suppression of the immune response prevents experimental hypertension [17,18] and improves hypertension in patients with psoriasis and arthritis [19]. T cells play a relevant role in hypertension as shown by Guzik et al. [20], they found that Ang II-induced hypertension was blunted in mice with genetic deletion of the recombinase-activating gene (RAG-1−/− mice).
The role of interleukin-6 (IL-6) as a driving force in the development of hypertension is supported by Lee et al. [21]. They found that Ang II induced-hypertension was attenuated in IL-6 knockout mice. Several studies have demonstrated a link between renal infiltration of T lymphocytes and blood pressure in Ang II-induced hypertension [18,22, 23], and SHR [17]; however the exact way by which T cells and other pro-inflammatory mediators are activated and contribute to hypertension is not understood.
Since hypertension induced by NO inhibition promotes oxidative stress [7] and renal accumulation of macrophages and T cells [18], we postulate that renal AT1R overexpression leads the activation of NAD(P)H oxidases and therefore promotes NF-κB activation and pro-inflammatory cytokine production resulting in high blood pressure.
Methods
Experimental design
All animal protocols and procedures were approved by the Bioethics Committee for Animal Research of Instituto Venezolano de Investigaciones Cientificas (IVIC, Caracas — Venezuela). Animals were housed with controlled temperature on a 12/12 h light/dark cycles and maintained on a standard pellet diet and tap water ad libitum.
Male Sprague–Dawley rats weighing 300–350 g, were divided into 3 groups (n = 6 each): L-NAME group, received 70 mg/100 ml of L-NAME (Sigma, St. Louis, MO) in the drinking water; L-NAME + Los group, received L-NAME (70 mg/100 ml), and the oral administration by gastric gavage of Losartan (40 mg/kg/day). Control rats were not treated with L-NAME or Losartan.
L-NAME and Losartan were administered daily for 2 weeks, and then all rats were euthanized under diazepam–ketamine general anesthesia. After renal perfusion with cold saline solution, the kidneys were harvested for immunofluorescence studies (frozen sections), Western blot studies (renal cortical homogenates) and qRT-PCR (RNA later).
Body weight, serum and urine samples were taken weekly. Serum creatinine was determined using an autoanalyzer methodology (Express Plus, Ciba Corning, Oberlin, OH). Urine protein concentration (proteinuria) was determined by the BCA kit (Sigma, St. Louis, MO).
Blood pressure measurement
Systolic blood pressure (BP) was measured non-invasively using the tail-cuff plethysmography (IITC, Life Scientific Instruments, Woodland Hills, CA), twice a week. The last measurement was taken at the end of the 2nd week of the experimental design. BP values were the average of three successive measurements per rat. Before the experiments, all the animals were conditioned to the procedure.
Reverse transcriptase-polymerase chain reaction (RT-qPCR) analysis
Total RNA was extracted from the renal cortex using the SV Total RNA Isolation System (Promega, USA). First strand of cDNA was synthetized with 1 μg of RNA using MMLV Reverse Transcriptase System (Promega, USA). SYBR Green Real-Time PCR was performed with the IQ5 Multicolor Real-Time PCR Detection System (Bio-Rad, USA), with the following cycle conditions: initial denaturation (95 °C for 3 min), followed by 40 cycles of amplification (95 °C for 15 s) and annealing (60 °C for 45 s). All of the assays were done in triplicate. The following gene specific primers (sense and anti-sense) were designed using Primer3 software and synthesized by Bioneer Inc., USA: IL-6 (forward) 5′-GAC TGA TGT TGT TGA CAG CCA GTG C- 3′ and (reverse) 5′-TAG CCA CTC CTT CTG TGA CTC TAA CT- 3′; IL-17 (forward) 5′-CAA CGT CAC CCT GGA ACT CTC- 3′ and (reverse) 5′-CTC CGC ATT GAC ACA GCG- 3′; IL-10 (forward) 5′-TGC CTT CAG TCA AGT GAA GAC T- 3′ and (reverse) 5′-AAA CTC ATT CAT GGC CTT GTA- 3′; TGFβ1 (forward) 5′-ACC GGG TGG CAG GCG AGA A- 3′ and (reverse) 5′-CGG GAC AGC AAT GGG GGT TCT- 3′; ICAM-1 (forward) 5′-TTT CGA TCT TCC GAC TAG GG- 3′ and (reverse) 5′-AGC TTC AGA GGC AGG AAA CA- 3′; β-actin (forward) 5′-CAG CTG AGA GGG AAA TCG TG- 3′ and (reverse) 5′-CGT TGC CAA TAG TGA TGA CC- 3′. Quantitative values were obtained from the threshold cycle (Ct) number that indicates an exponential amplification of the PCR product, and calculated as the change (n-fold) in value of the treatment group according to the 2(−Delta Delta Ct) method [24]. PCR products were confirmed on 2% agarose gel electrophoresis and melting-curve analysis. β-actin was used as a housekeeping gene for normalization.
Western blot analysis
Total renal cortex protein contents (40 μg) were separated electrophoretically on a 10% SDS-PAGE and transferred onto nitrocellulose membranes. Non-specific binding to the membranes was blocked with 5% non-fat dried milk/Tris-buffered saline (TBST, 20 mM Tris–HCl, 150 mM NaCl, 0.1% Tween-20). Membranes were incubated overnight at 4 °C with primary antibodies: rabbit monoclonal anti-NOX/gp91PHOX (1:1000, Abcam), rabbit polyclonal anti-p22PHOX (1:250, Santa Cruz Biotechnology), rabbit polyclonal anti-p47PHOX (1:1000, Abcam), rabbit polyclonal to rat p65 (1:1000, Abcam), rabbit polyclonal to rat IL-6 (1:2000, Abcam), rabbit polyclonal to rat IL-17 (1:1000, Abcam), mouse to rat IL-10 (1:1000, Abcam), rabbit polyclonal to rat TGF-β (1:1000, Abcam), and rabbit polyclonal to rat AT1 (1:1000, Abcam). Mouse monoclonal anti-β-actin (1:1000, Abcam) and Histone H3 (1:1000, Cell Signaling Biotechnology) were used as loading controls. After washing, membranes were incubated with goat anti-mouse IgG HRP-conjugated (1:2500, Stressgen) or donkey anti-rabbit IgG HRP-conjugates, for 1 h at RT in 1% non-fat dried milk/TBSST. Antigen/ antibody reactions were detected with diaminobenzidine (DAB, Biorad, USA) with ion metal enhancement or Western blotting Luminol Reagent (Sigma, St. Louis, MO). To quantify marker expression, we used Image J image processing software (Wayne Rasband, NIH, Bethesda, MD, USA). Pixel intensity was normalized to the β-actin or H3 loading control for each sample.
Malondialdehyde (MDA) determination
Urine samples were centrifuged at 600 ×g for 15 min and the collected supernatants were analyzed by the method of Ohkawa et al. [25] as described in previous communications [26]. Results are expressed as nanomoles of MDA per milligram of protein (Bio-Rad Protein Assay kit, Laboratories, Hercules, CA, USA).
Renal glutathione (GSH) determination
GSH content was determined in renal cortex slides as described previously [27]. Briefly, renal tissue homogenates were centrifuged at 600 g for 10 min, and 1.5 ml of metaphosphoric acid was added to 1 ml of renal homogenate supernatant and centrifuged at 3000 g for 10 min. Reduced GSH was measured by adding 500 μl of supernatant to 2 ml of 0,2 M phosphate buffer and 0.25 ml 0.04% 5,5′-dithio-bis-2-nitrobenzoic acid (DTNB). Absorbance was determined at 410 nm. GSH content was expressed as nanomoles of GSH per milligram of renal protein. GSH (Sigma, St. Louis, MO) was used as the external.
Renal catalase (CAT), glutathione peroxidase (GPx) and superoxide dismutase (SOD) activity assays
Renal CAT activity was determined spectrophotometrically as reported by Aebi [28]. Calculation was based on ε = 0.0425 mM−1 cm−1 (where ε is the extinction coefficient) for H2O2 at 240 nm and the change in absorbance during the first 60 s of the reaction.
Glutathione peroxidase activity was assayed by following NADPH oxidation to NADP+ at 340 nm, when glutathione is converted to the reduced form by glutathione reductase [29]. Results are expressed as nmol of oxidized NADPH per min per mg of protein (extinction coefficient of 6.22 mM/cm).
The SOD activity was measured spectrophotometrically as previously reported [30]. The assay is performed in 3 ml of 50 mM potassium phosphate buffer pH containing 0.1 mM ethylenediaminetetracetic acid (EDTA), 0.01 mM cytochrome C, 0.05 mM xanthine, and sufficient xanthine oxidase to produce a cytochrome C reduction rate at 550 nm of 0.025 absorbance units per min. Parallel measurements were also performed in presence of 1 mM potassium cyanide (KCN), selective inhibitor of copper–zinc (Cu/Zn) SOD, to differentiate Cu/Zn SOD and MnSOD isoenzymes.
Quantification of tubulointerstitial immune cell infiltration and the expression of ICAM-1 by immunofluorescence studies
Indirect immunofluorescence staining was performed to identify renal macrophages (CD68+ cells), lymphocytes (CD5+ cells) infiltration, and the renal expression of Intercellular Adhesion Molecule-1 (ICAM-1). Frozen renal sections were fixed with cold acetone and were incubated with a monoclonal antibody anti-CD68 (5 μg/ml, AbD Serotec), a mouse anti-rat CD5 (5 μg/ml, AbD Serotec), or a mouse anti-ICAM-1 (5 μg/ml, PIERCE Biotechnology, Inc., USA). After washing, sections were incubated with a goat anti-mouse IgG (Fab′2) FITC conjugated (5 μg/ml, PIERCE Biotechnology, Inc., USA) for 30 min.
Infiltrating CD68+ cells and CD5+ cells were expressed as number of positive cells per glomerular cross-section (GCS), and in tubulointerstitial areas expressed as number of positive cells per mm2. The expression of ICAM-1 was evaluated in digital photographs using the Adobe Photoshop CS6 Extended software®.
Statistical analysis
Data are presented as mean ± SD. Statistical comparisons between different groups were done using analysis of variance (ANOVA) followed by Tukey test, using a commercially available statistical package (GraphPad Software Version 5.0, La Jolla, CA). p value < 0.05 was considered statistically significant.
Results
Effects of Losartan on renal expression of AT1R, systolic blood pressure (SBP) and renal function
We evaluated the renal expression AT1R protein after L-NAME administration by Western blot. NO inhibition increased the AT1R protein expression when compared to controls (p < 0.05). The Losartan treatment did not have any effect on renal expression of AT1R induced by L-NAME administration (Fig. 1).
Fig. 1.
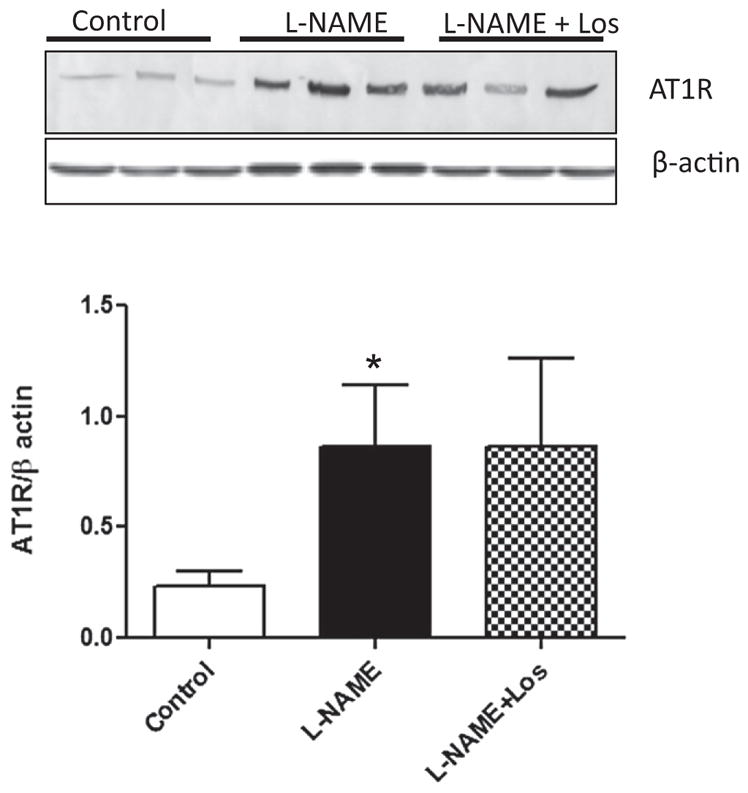
Renal AT1 receptor (AT1R) protein abundance during L-NAME induced-hypertension. Representative blots and averaged densitometric values show overexpression of AT1R in the kidney of rats treated during two weeks with L-NAME. Values are shown as mean ± SD; n = 6. *p < 0.05 versus Control.
All animals studied had normal SBP before the study. SBP rose markedly one week after the L-NAME administration (167.8 ± 25.24 mm Hg), and remained significantly high throughout the experiment (197.86 ± 17.06 mm Hg), with respect to controls (baseline, 115.44 ± 4.16 mm Hg; week 2, 117.6 ± 2.88 mm Hg). Losartan significantly diminished the effect of the NO inhibition on the SBP during week 1 (128.84 ± 4.73 mm Hg) and week 2 (125.58 ± 6.85 mm Hg), Table 1. Body weight and renal functional parameters evaluated are also given in Table 1. At baseline, there were no differences in body weight and serum creatinine levels among the studied groups. As expected, there was a significant increase in uric acid levels after two weeks of L-NAME treatment (p < 0.05 vs control), and an increase of urine protein excretion (p < 0.001 vs control) which was abolished by Losartan treatment (p < 0.001 vs L-NAME).
Table 1.
Summary of biological data.
| Controls | L-NAME | L-NAME + Los | ||||
|---|---|---|---|---|---|---|
|
|
|
|
||||
| Baseline week 2 (n = 6) | Baseline week 2 (n = 6) | Baseline week 2 (n = 6) | ||||
| Body weight g | 233.00 ± 12.04 | 296.00 ± 11.40 | 233.00 ± 12.04 | 309.20 ± 16.76 | 233.00 ± 12.04 | 296.00 ± 11.40 |
| Uric acid mg/dl | 0.60 ± 0.12 | 0.62 ± 0.10 | 0.82 ± 0.45 | 1.82 ± 0.23* | 0.60 ± 0.14 | 0.60 ± 0.07 |
| Creatinine mg/dl | 0.48 ± 0.20 | 0.34 ± 0.05 | 0.34 ± 0.05 | 0.42 ± 0.08 | 0.36 ± 0.08 | 0.38 ± 0.04 |
| Proteinuria mg/24 h | 3.46 ± 1.66 | 2.83 ± 2.03 | 3.65 ± 0.85 | 7.45 ± 1.46*** | 2.72 ± 1.47 | 3.20 ± 1.17 |
| SBP mm Hg | 115.44 ± 4.16 | 117 ± 2.88 | 115.44 ± 4.16 | 197.86 ± 17.06*** | 115.44 ± 4.16 | 125 ± 6.85 |
Values are shown as means ± SD. n = 6.
p < 0.05 versus Control and L-NAME + Los groups.
p < 0.001 versus Control and L-NAME + Los groups.
Effect of the AT1R blocker Losartan on the renal expression of NAD(P)H subunits gp91PHOX, p22 PHOX, p47 PHOX and p67 PHOX during NO inhibition induced-hypertension
We studied the renal expression of the subunits gp91PHOX, p22PHOX and p47PHOX and p67PHOX of the NAD(P)H oxidase, as the main source of ROS production in the kidney. As shown in Fig. 2A–C, the L-NAME treated animals showed a significant up-regulation of gp91PHOX, p22PHOX and p47PHOX sub-units of renal NAD(P)H oxidase when compared to controls (gp91PHOX: p < 0.01; p22PHOX: p < 0.05; p47PHOX: p < 0.001). AT1R blockade using Losartan prevented up-regulation of the NAD(P)H sub-units studied (gp91PHOX: p < 0.05; p22PHOX: p < 0.05; p47PHOX: p < 0.01 vs L-NAME treated animals). There were no changes in renal p67PHOX subunit expression.
Fig. 2.

Renal expression of the NADPH oxidase subunits gp91PHOX, p22PHOX and p47PHOX and p67PHOX. Effect of the AT1 receptor blocker therapy. gp91PHOX, p22PHOX and p47PHOX and p67PHOX concentrations were determined in the renal cortex of Control, L-NAME and L-NAME + Los treated rats (n = 6). L-NAME treatment induced an increase in the renal expression of the NADPH oxidase subunits gp91PHOX, p22PHOX and p47PHOX. Losartan treatment diminished the expression of gp91PHOX, p22PHOX and p47PHOX. Data are means ± SD. ***p < 0.001 vs Control; **p < 0.01 vs Control; *p < 0.05; ##p < 0.01 vs L-NAME; #p < 0.05 vs L-NAME.
Renal antioxidant enzymes catalase (CAT), superoxide dismutase (SOD) and glutathione peroxidase (GPx) activities in hypertension induced by NO-inhibition
As shown in Fig. 3A–C, the activity of the renal antioxidant enzymes CAT, SOD and GPx significantly increased in the L-NAME treated rats when compared with the control animals (p < 0.001). Losartan treatment (L-NAME + Los) reduced significantly these findings (p < 0.001).
Fig. 3.

Effect of AT1R blocked in renal antioxidant enzyme activity. Catalase (CAT), Cu/Zn SOD, and glutathione peroxidase (GPx) activity were determined in the renal cortex of Control, L-NAME and L-NAME + Los treated rats (n = 6 in each group). L-NAME treatment induced an increase in CAT (A), Cu/Zn SOD (B) and GPx activity (C). Losartan treatment diminished the activity of the studied enzymes. Data are means ± SD. ***p < 0.001 vs Control; ##p < 0.01 vs L-NAME and vs Control; ###p < 0.001 L-NAME.
Effect of Losartan on renal oxidative stress markers during NO-inhibition induced hypertension
Fig. 4A shows an increase of urine malondialdehyde (MDA) levels in the hypertensive rats after two weeks of NO inhibition (p < 0.001), Losartan treatment significantly diminished urine MDA excretion in the L-NAME + Los treated rats (p < 0.01). Levels of reduced glutathione (GSH) were depleted in L-NAME treated rats when compared with control rats (p < 0.01), Losartan treatment (L-NAME + Los) kept renal GSH levels similar to controls (Fig. 4B).
Fig. 4.
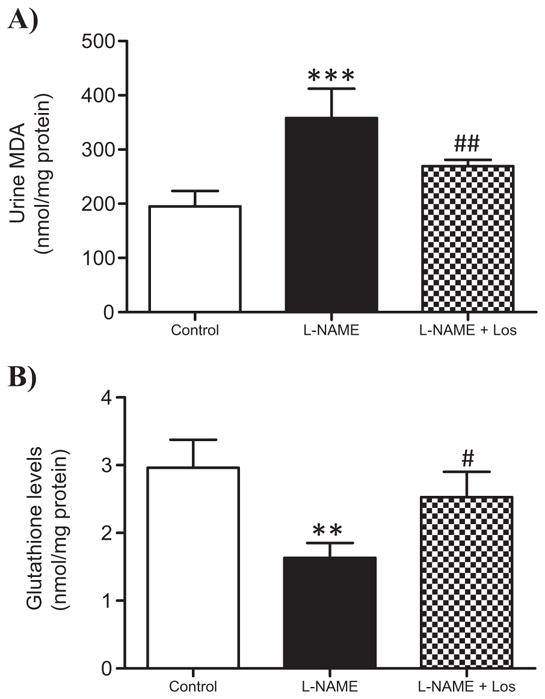
Effect of the AT1 receptor blocker therapy on urine malondialdehyde (MDA) concentration and the levels of renal glutathione (GSH). During hypertension induced by L-NAME administration, urine MDA concentration increased significantly (A). Losartan treatment (L-NAME + Los) diminished urine MDA content. ***p < 0.001 versus Control; ## p < 0.01 versus L-NAME a. B) Renal GSH levels decreased in the L-NAME treated rats, Losartan treatment restored renal GSH levels in L-NAME + Los treated rats. **p < 0.01 versus Control; #p < 0.05 vs L-NAME. n = 6.
Renal NF-κB (p65) expression and cytokines in L-NAME induced hypertension
To study the effect of NO inhibition on the renal cytokine production, we analyzed by RT-qPCR the gene expression of IL-6, IL-17, TGF-β and IL-10. The protein expression of NF-κB and cytokines was determined by Western blot. Activation of NF-κB is characterized by phosphorylation of specific amino acid residues in the p65 sub-unit, an important pre-requisite for the activation of target genes related to inflammation. Fig. 5 shows that renal p65 expression in the L-NAME treated rats increased significantly when compared to controls (p < 0.01). Losartan treatment prevented these increments (p < 0.05).
Fig. 5.
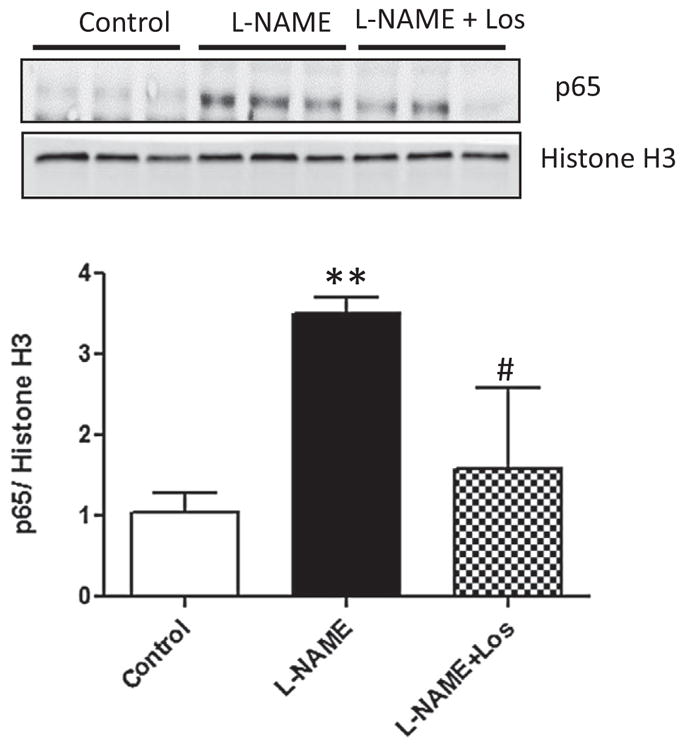
Renal protein expression of p65 during L-NAME induced-hypertension. Representative blots and averaged densitometric values show overexpression of p65 in the kidney of rats treated during two weeks with L-NAME. Values are shown as means ± SD; n = 6. **p < 0.01 versus Control; #p < 0.05 versus L-NAME.
Quantitative PCR analysis of the kidney shows an increase of the pro-inflammatory cytokines in experimental hypertension induced by NO inhibition. Fig. 6A shows an increase in IL-6 mRNA in the L-NAME treated rats when compared to Control rats (p < 0.001). The increase in IL-6 renal expression was further confirmed by Western blot, reaching statistical significance when compared to Controls as shown in Fig. 6B (p < 0.05).
Fig. 6.

Renal expression of IL-6 and IL-17 during L-NAME induced-hypertension. NO inhibition during two weeks caused an increase in mRNA expression of IL-6 and IL-17 (A, C), and protein content (B, D). Losartan treatment (L-NAME + Los) diminished renal expression of IL-6 (A,B) and mRNA expression of IL-17 (C). Data are means ± SD; n = 6. ***p < 0.001 versus Control; ###p < 0.001 versus L-NAME; *p < 0.05 versus Control; #p < 0.05 versus L-NAME; *p < 0.05 versus Control.
Similar findings were observed with renal expression of IL-17 as shown in Fig. 6C–D, an increased renal IL-17 mRNA and protein was observed in L-NAME treated rats, p < 0.001 and p < 0.01 versus Controls, respectively. Losartan treatment (L-NAME + Los) diminished the renal pro-inflammatory cytokines induced by NO inhibition (p < 0.05) when compared to L-NAME treated rats, except for IL-17 protein expression which diminished without reaching statistical difference. Although renal TGF-β mRNA was depleted by NO inhibition (L-NAME and L-NAME + Los treated rats) with respect to Controls (p < 0.05), Western blot analysis did not show variation in renal protein expression of TGF-β (Fig. 7A–B). We also evaluated the renal expression of the anti-inflammatory cytokine IL-10, which diminished in the L-NAME treated rats when compared with Controls, as shown in Fig. 7D (p < 0.001). Losartan treatment had no effect on the expression of renal TGF-β or IL-10.
Fig. 7.

Renal expression of TGF-β and IL-10 during L-NAME induced-hypertension. Renal mRNA expression of TGF-β diminished in L-NAME treated rats and in L-NAME + Los treated rats (A). D) Western blot analysis shows a decreased IL-10 expression in L-NAME and L-NAME + Los groups. Data are means ± SD; n = 6. *p < 0.05 vs control; #p < 0.05 vs control ***p < 0.001 versus Control; ##p < 0.01 versus Control.
Cellular infiltration and expression of the renal Intercellular Adhesion Molecule-1 (ICAM-1)
We observed a marked renal infiltration of macrophages (CD68+ cells) in the tubulointerstitial area after two weeks of L-NAME treatment when compared to Controls, p < 0.01. Losartan treatment (L-NAME + Los) decreased but not significantly the number of tubulointerstitial CD68+ cells with respect to L-NAME group (Fig. 8A). Similarly, renal T lymphocyte (CD5+ cells) infiltration increased in the L-NAME treated rats with respect to Control rats, p < 0.05 (Fig. 8B–C).
Fig. 8.

Tubulointerstitial infiltration of macrophages (CD68+ cells) A). After two weeks of NO inhibition, the L-NAME treated rat (solid bar) had a significant increment of CD68+ cells when compared to Controls. Losartan treatment (L-NAME + Los) did not have any effect on tubulointerstitial infiltration of CD68+ cells. Each bar shows means ± SD (n = 6). **p < 0.01 versus Control. Tubulointerstitial infiltration of lymphocytes (CD5+ cells). B) L-NAME treated rats (solid bar) had a significant increment of CD5+ cells (**p < 0.05 versus Control). Values are mean ± SD; n = 6. C) Representative photomicrographs of CD5 staining from renal cross-sections of the kidney show CD5 positive cells (arrows) in tubulointerstitial areas of Control, L-NAME and L-NAME + Los rats. Magnification 400×.
Evaluation of the renal expression of ICAM-1 after two weeks of L-NAME administration shows a markedly up-regulated ICAM-1 mRNA in the kidney of rats treated with L-NAME when compared to control rats (p < 0.01), Fig. 9A. Losartan treatment restored renal ICAM-1 mRNA expression to control levels (p < 0.001 vs L-NAME). Similar findings were obtained after immunofluorescence studies, although we did not find statistical differences between all the groups evaluated, NO inhibition appears to induce renal ICAM-1 expression (1252.9 ± 1097.1 μm2) compared with Control rats (666.7 ± 327.1 μm2), whereas Losartan treatment seems to suppress the increased intensity of renal ICAM-1 produced by NO inhibition during two weeks (355.6 ± 149.5 μm2), Fig. 9B–C.
Fig. 9.

Renal expression of ICAM-1 in hypertension induced by NO inhibition during 2 weeks. A) L-NAME treated rats (solid bar) had a significant increase of renal mRNA expression of ICAM-1 (**p < 0.001 vs Control). Losartan treatment abolished ICAM-1 mRNA expression in the L-NAME + Los rats (###p < 0.001 vs L-NAME). Values are means ± SD. B) NO inhibition has no significant effect on renal expression of ICAM-1. (C) Representative photomicrographs of ICAM-1 positive cells in tubulointerstitial areas of Controls, L-NAME treated rats, and L-NAME + Los treated rats. Magnification 400×, scale bar 50 μm.
Discussion
During L-NAME induced-hypertension, intrarenal RAS activation is characterized by increased renal expression of Ang II [18]. In this study, we reported evidence supporting the participation of Ang II in this experimental model. Our work indicates that NO inhibition induces the overexpression of AT1R in the kidney, contributing to hypertension and renal damage. Ohsawa et al. [31] have shown that renal AT1R activation promotes sodium retention via ENaC activation, and consecutively the exacerbation of hypertension induced by Ang II administration.
One characteristic finding of hypertension is the increased oxidative stress [12,32]. As reviewed by Araujo and Wilcox [33] increased renal oxidative stress can initiate and contribute to the progression of hypertension. The renal redox balance is altered during NO-inhibition induced hypertension, as documented previously by Sainz et al. [34]. One important mediator of oxidative stress during hypertension is the NAD(P)H oxidase, which represents one of the major sources of renal O− 2 production [35]. Ang-II induces oxidative stress via NAD(P)H oxidase activation [36,37] through AT1R activation [38–40]. Consistent with these results, L-NAME treated group exhibits a marked increase in renal AT1R expression. Up-regulation of AT1R was coupled with marked increases of NAD(P)H oxidase subunits that could lead to increase oxidative stress during hypertension.
As expected, our results show that NO deficiency increased urine MDA and depleted renal GSH content, nevertheless, the activity of the renal antioxidant enzymes Cu/Zn SOD, CAT and GPx was up-regulated in the L-NAME treated rats when compared with controls, indicating a compensatory mechanism to reduce the excessive renal ROS production. These findings suggest a predominance of renal pro-oxidative response, which may be associated with up-regulated renal AT1R, NAD(P)H oxidase activation and the pro-inflammatory milieu during hypertension. Although Losartan treatment did not reduce significantly leukocyte infiltration during L-NAME-induced hypertension, our results indicate that the protective effects of Losartan are mediated in part by decreasing renal NAD(P)H subunit expression, urine MDA levels and restoring renal GSH levels, suggesting an important role of renal tubular cells on ROS production.
Aside from the effects of Ang II inducing hypertension, it has a potential role on immune cells inducing an inflammatory response in the kidney, via AT1R [23]. Renal tubulointerstitial infiltration is a common finding in experimental models of hypertension and it has been related with the renal damage during this pathology [3,17]. The adaptive immune system seems to be involved in the development of hypertension [17,41]. Chronic L-NAME administration increases renal T cell infiltration in SHR [42]. Similarly, the development of Ang II-induced hypertension and renal disease during hypertension are dependents of T lymphocytes [20], nevertheless the mechanisms by which T cells are activated and contribute to hypertension are not understood. Taking advantage of prior finding regarding the role of inflammation during genetic and experimental hypertension [17,18,22], we evaluated renal cytokine production in hypertension induced by NO inhibition.
Angiotensin II may function as a pro-inflammatory molecule via NF-κB activation, which is the general transcription factor for pro-inflammatory cytokines, chemokines and adhesion molecules [43]. We demonstrated that increased renal expression of p65 in L-NAME induced-hypertension is dependent of ATIR activation, since Losartan treatment prevented NF-κB activation. NF-κB activation may be responsible of promoting renal inflammation during NO inhibition induced-hypertension. Increased renal NF-κB binding activity has been demonstrated and associated with increased inflammatory cell infiltration in Ang II induced-hypertension [44]. Muller et al. [45] have suggested that blockade of NF-κB activation may provide therapeutic benefits in preventing and treating hypertension and renal injury.
Similarly, we showed an increase of renal pro-inflammatory cytokines (IL-6, IL-17) in the rats treated with L-NAME. The role of pro-inflammatory cytokines regulating blood pressure is not well understood, nevertheless the renal pro-inflammatory cytokine IL-6 contributes to impaired pressure natriuresis [46]. Likewise, IL-6 knockout mice do not develop Ang II induced-hypertension [21,47, 48]. On the other hand, increased renal IL-17 in L-NAME treated rats suggests that during hypertension the renal inflammatory response could be mediated by T lymphocytes via a Th17 response.
The production of IL-6 in presence of IL-1β induces the expression of the retinoic acid receptor-related orphan receptor γt (RORγt) and promotes the differentiation of CD4+ T cells into Th17 cells [49]. In mice, the production of IL-6 and TGF-β is necessary for the differentiation of T cells to Th17 cells [50,51], nevertheless in human cells the presence of TGF-β suppresses the Th17 differentiation of CD4+ T cells, therefore the role of TGF-β inducing Th17 differentiation is controversial [49]. In our study, L-NAME administration suppressed mRNA renal expression of TGF-β, but induced a significantly increase of IL-6 and IL-17 cytokines suggesting a similar response to those described to human cells [49]. This finding suggests that local production of TGF-β in presence of the pro-inflammatory cytokines IL-6 and IL-17, plays a pro-inflammatory role and could drive the differentiation of Th17 cells, main source of IL-17. Since the role of TGF-β in regulating the molecular orchestration of Th17 cell differentiation is controversial, it is thought that it inhibits Th1 and Th2 cell differentiation via preventing the expression of STAT-4 and GATA-3 [52]; on the other hand an early signaling by TGF-β in an inflammatory context promotes Th17 differentiation and up-regulates IL-23R [51]. Nevertheless, further studies are necessary to elucidate the role of TGF-β in the renal cell infiltration during hypertension induced by NO inhibition.
Besides IL-17, RAS activity may influence a Th17 response as documented by Madhur et al. [53] in the experimental hypertension induced by Ang II, which is strongly dependent of a Th17/IL17 response. In hypertension induced by NO inhibition has been documentedan increase of renal Ang II expression [18], which could contribute to renal T cell infiltration and Th17 differentiation in this experimental model.
Another finding supporting renal inflammatory response during hypertension induced by NO inhibition is the downregulation of renal IL-10 production, cytokine essential for homeostasis of the immune system by inhibiting the activation of NF-κB. In stroke-prone spontaneous hypertensive rats, IL-10 seems to have an important role since gene therapy using IL-10 diminishes blood pressure [54]. In Ang II induced-hypertension, the reduction of IL-10 is associated to NO deficiency [55], which could result in a reduction of the number of regulatory T lymphocytes (Treg) and therefore IL-10 production. The mechanisms to explain the relation between NO and IL-10 production are not clear, nevertheless NO could maintain IL-10 production by inducing proliferation of Treg [56]. It has been documented that Ang-II induced hypertension is attenuated by replacement of Treg, the main source of IL-10; nevertheless Th2 cells, NK, B cells, macrophages and dendritic cells may also produce this cytokine [57,58]. Although, the role of Treg in hypertension is not clear, the administration of Treg prevents the rise of the blood pressure and the vascular injury in Ang II induced hypertension [59].
Renal production of pro-inflammatory cytokines induces renal interstitial infiltration and oxidative stress, common findings previously reported in experimental hypertension [18,41,60]. We postulate that increased renal IL-6 and IL-17 in the L-NAME treated rats, lead homing and renal infiltration of macrophages and lymphocytes. Likewise increased production of renal Ang II during L-NAME administration contributes to renal infiltration in this experimental model [18,61]. In addition, the up-regulation of renal ICAM-1 may contribute to adhesion and T cell infiltration as reported previously [62]. We showed that the number of macrophages and T cells in the kidney in L-NAME group was significantly increase compared with control. Although it is not possible with our results to identify which subsets of renal T cells predominate during L-NAME hypertension, significant production of IL-17 suggests the presence of Th1/Th17 cells. Recently, the role of IL-17 in hypertension has been unraveled in experimental hypertension [53]. Although it is not known how this cytokine increases leukocyte recruitment in response to Ang II, IL-17 could promote leukocyte infiltration and increase blood pressure.
The renal protection conferred by AT1R blockade, revealed in this and other studies, has been consistently accompanied by amelioration of hypertension. Because hypertension is a major cause of renal injury and inflammation, its improvement undoubtedly contributes to protective action of AT1R blockers. Additional studies are required to discriminate the impact of blood pressure reduction per se on the NAD(P)H oxidase activation, oxidative stress and inflammation.
Conclusions
In summary, NO inhibition induced-hypertension was associated with up-regulation of renal AT1R, NAD(P)H oxidase activation and heightened intrarenal oxidative/inflammatory pathways. AT1R blockade lowered blood pressure, reduced renal damage and attenuated up-regulations of the pro-oxidative/inflammatory pathways in L-NAME-induced hypertension. Although Losartan reduced the renal oxidative stress, NF-κB activation and IL-6 expression after L-NAME administration, we did not find any effect on renal macrophages and T cell infiltration, suggesting an important role of the renal epithelial cells in mediating ROS production and IL-6 induction. Nevertheless, as renal infiltrating cells were showed during L-NAME induced-hypertension, we cannot rule out its role contributing to hypertension.
Acknowledgments
This work was supported by funds from the Instituto Venezolano de Investigaciones Científicas, IVIC (935).
Footnotes
Conflict of interest statement
The authors declare that there are no conflicts of interest.
References
- 1.Griendling KK, Ushio-Fukai M, Lassègue B, Alexander RW. Angiotensin II signaling in vascular smooth muscle. New concepts. Hypertension. 1997;29:366–373. doi: 10.1161/01.hyp.29.1.366. [DOI] [PubMed] [Google Scholar]
- 2.Navar LG, Harrison-Bernard LM, Nishiyama A, Kobori H. Regulation of intrarenal angiotensin II in hypertension. Hypertension. 2002;39:316–322. doi: 10.1161/hy0202.103821. [DOI] [PMC free article] [PubMed] [Google Scholar]
- 3.Ruiz-Ortega M, Esteban V, Ruperez M, Sanchez-Lopez E, Rodriguez-Vita J, Carvajal G, Egido J. Renal and vascular hypertension-induced inflammation: role of angiotensin II. Curr Opin Nephrol Hypertens. 2006;15:159–166. doi: 10.1097/01.mnh.0000203190.34643.d4. [DOI] [PubMed] [Google Scholar]
- 4.Zhuo J, Song K, Harris PJ, Medelson FA. In vitro autoradiography reveals predominantly AT1 angiotensin II receptors in rat kidney. Ren Physiol Biochem. 1992;15:231–239. doi: 10.1159/000173458. [DOI] [PubMed] [Google Scholar]
- 5.Crowley SD, Gurley SB, Herrera MJ, Ruiz P, Griffiths R, Kumar AP, Kim HS, Smithies O, Le TH, Coffman TM. Angiotensin II causes hypertension and cardiac hypertrophy through its receptors in the kidney. Proc Natl Acad Sci U S A. 2006;103:17985–17990. doi: 10.1073/pnas.0605545103. [DOI] [PMC free article] [PubMed] [Google Scholar]
- 6.Reja V, Goodchild AK, Phillips JK, Pilowsky PM. Upregulation of angiotensin AT1 receptor and intracellular kinase gene expression in hypertensive rats. Clin Exp Pharmacol Physiol. 2006;33:690–695. doi: 10.1111/j.1440-1681.2006.04420.x. [DOI] [PubMed] [Google Scholar]
- 7.Khattab M, Ahmad M, Al-Shabanah OA, Raza M. Effects of losartan on blood pressure, oxidative stress and nitrate/nitrite levels in the nitric oxide deficient hypertensive rats. Recept Channels. 2004;10:147–157. doi: 10.3109/10606820490936141. [DOI] [PubMed] [Google Scholar]
- 8.Llinás MT, González JD, Nava E, Salazar FJ. Role of angiotensin II in the renal effects induced by nitric oxide and prostaglandin synthesis inhibition. J Am Soc Nephrol. 1997;8:543–550. [PubMed] [Google Scholar]
- 9.Rajagopalan S, Kurz S, Münzel T, Tarpey M, Freeman BA, Griendling KK, Harrison DG. Angiotensin II-mediated hypertension in the rat increases vascular super-oxide production via membrane NADH/NADPH oxidase activation. Contribution to alterations of vasomotor tone. J Clin Invest. 1996;97:1916–1923. doi: 10.1172/JCI118623. [DOI] [PMC free article] [PubMed] [Google Scholar]
- 10.Lambeth JD. NOX enzymes and the biology of reactive oxygen. Nat Rev Immunol. 2004;4:181–189. doi: 10.1038/nri1312. [DOI] [PubMed] [Google Scholar]
- 11.Sasche A, Wolf G. Angiotensin II-induced reactive oxygen species and the kidney. J Am Soc Nephrol. 2007;18:2439–2446. doi: 10.1681/ASN.2007020149. [DOI] [PubMed] [Google Scholar]
- 12.Wilcox CS. Oxidative stress and nitric oxide deficiency in the kidney: a critical link to hypertension? Am J Physiol Regul Integr Comp Physiol. 2005;289:913–935. doi: 10.1152/ajpregu.00250.2005. [DOI] [PubMed] [Google Scholar]
- 13.Lassègue B, Griendling KK. Reactive oxygen species in hypertension; an update. Am J Hypertens. 2004;17:852–860. doi: 10.1016/j.amjhyper.2004.02.004. [DOI] [PubMed] [Google Scholar]
- 14.White BH, Sidhu A. Increased oxidative stress in renal proximal tubules of the spontaneously hypertensive rat: a mechanism for defective dopamine D1A receptor/G-protein coupling. J Hypertens. 1998;16:1659–1665. doi: 10.1097/00004872-199816110-00013. [DOI] [PubMed] [Google Scholar]
- 15.Benigni A, Cassis P, Remuzzi G. Angiotensin II revisited: new roles in inflammation, immunology and aging. EMBO Mol Med. 2010;2:247–257. doi: 10.1002/emmm.201000080. [DOI] [PMC free article] [PubMed] [Google Scholar]
- 16.Nataraj C, Oliverio M, Mannon R, Mannon P, Audoly L, Amuchastegui C, Ruiz P, Smithies O, Coffman T. Angiotensin II regulates cellular immune responses through a calcineurin-dependent pathway. J Clin Invest. 1999;104:1693–1701. doi: 10.1172/JCI7451. [DOI] [PMC free article] [PubMed] [Google Scholar]
- 17.Rodríguez-Iturbe B, Quiroz Y, Nava M, Bonet L, Chávez M, Herrera-Acosta J, Johnson RJ, Pons HA. Reduction of renal immune infiltration results in blood pressure control in genetically hypertensive rats. Am J Physiol Ren Physiol. 2002;282:191–201. doi: 10.1152/ajprenal.0197.2001. [DOI] [PubMed] [Google Scholar]
- 18.Quiroz Y, Pons H, Gordon KL, Rincón J, Chávez M, Parra G, Herrera-Acosta J, Gómez-Garre D, Largo R, Egido J, Johnson RJ, Rodríguez-Iturbe B. Mycophenolate mofetil prevents salt-sensitive hypertension resulting from nitric oxide synthesis inhibition. Am J Physiol Ren Physiol. 2001;281:F38–F47. doi: 10.1152/ajprenal.2001.281.1.F38. [DOI] [PubMed] [Google Scholar]
- 19.Herrera J, Ferrebuz A, Macgregor E, Rodriguez-Iturbe B. Mycophenolate mofetil treatment improves hypertension in patients with psoriasis and rheumatoid arthritis. J Am Soc Nephrol. 2006;17:S218–S225. doi: 10.1681/ASN.2006080918. [DOI] [PubMed] [Google Scholar]
- 20.Guzik TJ, Hoch NE, Brown KA, McCann LA, Rahman A, Dikalov S, Goronzy J, Weyand C, Harrison DG. Role of the T cell in the genesis of angiotensin II-induced hypertension and vascular dysfunction. J Exp Med. 2007;204:2449–2460. doi: 10.1084/jem.20070657. [DOI] [PMC free article] [PubMed] [Google Scholar]
- 21.Lee DL, Sturgis LC, Labazi H, Osborne JB, Jr, Fleming C, Pollock JS, Manhiani M, Imig JD, Brands MW. Angiotensin II hypertension is attenuated in interleukin-6 knockout mice. Am J Physiol Heart Circ Physiol. 2006;290:935–940. doi: 10.1152/ajpheart.00708.2005. [DOI] [PubMed] [Google Scholar]
- 22.Rodriguez-Iturbe B, Pons H, Quiroz Y, Gordon K, Rincón J, Chávez M, Parra G, Herrera-Acosta J, Gómez-Garre D, Largo R, Egido J, Johnson RJ. Mycophenolate mofetil prevents salt-sensitive hypertension resulting from angiotensin II exposure. Kidney Int. 2001;59:2222–2232. doi: 10.1046/j.1523-1755.2001.00737.x. [DOI] [PubMed] [Google Scholar]
- 23.Crowley SD, Frey CW, Gould SK, Griffiths R, Ruiz P, Burchette JL, Howell DN, Makhanova N, Yan M, Kim HS, Tharaux PL, Coffman TM. Stimulation of lymphocyte responses by angiotensin II promotes kidney injury in hypertension. Am J Physiol Ren Physiol. 2008;295:515–524. doi: 10.1152/ajprenal.00527.2007. [DOI] [PMC free article] [PubMed] [Google Scholar]
- 24.Livak KJ, Schimittgen TD. Analysis of relative gene expression data using real-time quantitative PCR and the 2(−delta delta C(T)) method. Methods. 2001;25:402–408. doi: 10.1006/meth.2001.1262. [DOI] [PubMed] [Google Scholar]
- 25.Ohkawa H, Ohishi N, Yagi K. Assay for lipid peroxides in animal tissue by thiobarbituric acid reaction. Anal Biochem. 1979;95:351–358. doi: 10.1016/0003-2697(79)90738-3. [DOI] [PubMed] [Google Scholar]
- 26.Quiroz Y, Ferrebuz A, Romero F, Vaziri ND, Rodrígueziturbe B. Melatonin ameliorates oxidative stress, inflammation, proteinuria and progression of renal damage in rats with renal mass reduction. Am J Physiol Ren Physiol. 2008;294:F336–F344. doi: 10.1152/ajprenal.00500.2007. [DOI] [PubMed] [Google Scholar]
- 27.Sedlak M, Lindsay R. Estimation of total, protein-bound and non-protein sulfhydryl groups in tissue with Ellman’s reagent. Anal Biochem. 1968;25:192–205. doi: 10.1016/0003-2697(68)90092-4. [DOI] [PubMed] [Google Scholar]
- 28.Aebi H. Catalase in vitro. Methods Enzymol. 1982;105:121–126. doi: 10.1016/s0076-6879(84)05016-3. [DOI] [PubMed] [Google Scholar]
- 29.Wendel A. Glutathione peroxidase. Methods Enzymol. 1981;77:325–333. doi: 10.1016/s0076-6879(81)77046-0. [DOI] [PubMed] [Google Scholar]
- 30.McCord JM. Oxygen-derived free radicals in postischemic tissue injury. N Engl J Med. 1985;312:159–163. doi: 10.1056/NEJM198501173120305. [DOI] [PubMed] [Google Scholar]
- 31.Ohsawa M, Tamura K, Wakui H, Maeda A, Dejima T, Kanaoka T, Azushima K, Uneda K, Tsurumi-Ikeya Y, Kobayashi R, Matsuda M, Uchida S, Toya Y, Kobori H, Nishiyama A, Yamashita A, Ishikawa Y, Umemura S. Deletion of the angiotensin II type 1 receptor-associated protein enhances renal sodium reabsorption and exacerbates angiotensin II-mediated hypertension. Kidney Int. 2014;86:570–581. doi: 10.1038/ki.2014.95. [DOI] [PMC free article] [PubMed] [Google Scholar]
- 32.Wilcox CS. Reactive oxygen species: roles in blood pressure and kidney function. Curr Hypertens Rep. 2002;4:160–166. doi: 10.1007/s11906-002-0041-2. [DOI] [PubMed] [Google Scholar]
- 33.Araujo M, Wilcox CS. Oxidative stress in hypertension: role of the kidney. Antioxid Redox Signal. 2014;20:74–101. doi: 10.1089/ars.2013.5259. [DOI] [PMC free article] [PubMed] [Google Scholar]
- 34.Sainz J, Wangensteen R, Rodríguez Gómez I, Moreno JM, Chamorro V, Osuna A, Bueno P, Vargas F. Antioxidant enzymes and effects of tempol on the development of hypertension induced by nitric oxide inhibition. Am J Hypertens. 2005;18:871–877. doi: 10.1016/j.amjhyper.2004.12.022. [DOI] [PubMed] [Google Scholar]
- 35.Gill PS, Wilcox CS. NADPH oxidases in the kidney. Antioxid Redox Signal. 2006;8:1597–1607. doi: 10.1089/ars.2006.8.1597. [DOI] [PubMed] [Google Scholar]
- 36.Garrido AM, Griendling KK. NADPH oxidases and angiotensin II receptor signaling. Mol Cell Endocrinol. 2009;29:148–158. doi: 10.1016/j.mce.2008.11.003. [DOI] [PMC free article] [PubMed] [Google Scholar]
- 37.Harrison DG, Gongora MC. Oxidative stress and hypertension. Med Clin North Am. 2009;93:621–635. doi: 10.1016/j.mcna.2009.02.015. [DOI] [PubMed] [Google Scholar]
- 38.Li N, Yi FX, Spurrier JL, Bobrowitz CA, Zou AP. Production of superoxide through NADH oxidase in thick ascending limb of Henles loop in rat kidney. Am J Physiol Ren Physiol. 2002;282:1111–1119. doi: 10.1152/ajprenal.00218.2001. [DOI] [PubMed] [Google Scholar]
- 39.Taniyama Y, Griendling KK. Reactive oxygen species in the vasculature: molecular and cellular mechanisms. Hypertension. 2003;42:1075–1081. doi: 10.1161/01.HYP.0000100443.09293.4F. [DOI] [PubMed] [Google Scholar]
- 40.Lassègue B, Clempus RE. Vascular NAD(P)H oxidases: specific features, expression, and regulation. Am J Physiol Regul Integr Comp Physiol. 2003;285:277–297. doi: 10.1152/ajpregu.00758.2002. [DOI] [PubMed] [Google Scholar]
- 41.Quiroz Y, Johnson RJ, Rodriguez-Iturbe B. The role of T cells in the pathogenesis of primary hypertension. Nephrol Dial Transplant. 2012;27(Suppl 4):iv2–iv5. doi: 10.1093/ndt/gfs421. [DOI] [PMC free article] [PubMed] [Google Scholar]
- 42.Brinson KN, Elmarakby AA, Tipton AJ, Crislip GR, Yamamoto T, Baban B, Sullivan JC. Female SHR have greater blood pressure sensitivity and renal T cell infiltration following chronic NOS inhibition than males. Am J Physiol Regul Integr Comp Physiol. 2013;305:701–710. doi: 10.1152/ajpregu.00226.2013. [DOI] [PMC free article] [PubMed] [Google Scholar]
- 43.Ruiz-Ortega M, Lorenzo O, Ruperez M, Konig S, Wittig B, Ejido J. Angiotensin II activates nuclear transcription factor kappaB through AT(1) and AT(2) in vascular smooth muscle cells: molecular mechanisms. Circ Res. 2000;86:1266–1272. doi: 10.1161/01.res.86.12.1266. [DOI] [PubMed] [Google Scholar]
- 44.Ruiz-Ortega M, Lorenzo O, Rupérez M, Suzuki Y, Egido J. Angiotensin II activates nuclear transcription factor-kappaB in aorta of normal rats and in vascular smooth muscle cells of AT1 knockout mice. Nephrol Dial Transplant. 2001;16(Suppl 1):27–33. doi: 10.1093/ndt/16.suppl_1.27. [DOI] [PubMed] [Google Scholar]
- 45.Muller DN, Dechend R, Mervaala EM, Park JK, Schmidt F, Fiebeler A, Theuer J, Breu V, Ganten D, Haller H, Luft FC. NF-kappaB inhibition ameliorates angiotensin II-induced inflammatory damage in rats. Hypertension. 2000;35:193–201. doi: 10.1161/01.hyp.35.1.193. [DOI] [PubMed] [Google Scholar]
- 46.Li K, Guo D, Zhu H, Hering-Smith KS, Hamm LL, Ouyang J, Dong Y. Interleukin-6 stimulates epithelial sodium channels in mouse cortical collecting duct cells. Am J Physiol Regul Integr Comp Physiol. 2010;299:590–595. doi: 10.1152/ajpregu.00207.2009. [DOI] [PMC free article] [PubMed] [Google Scholar]
- 47.Brands MW, Banes-Berceli AK, Inscho EW, Al-Azawi H, Allen AJ, Labazi H. Interleukin 6 knockout prevents angiotensin II hypertension: role of renal vasoconstriction and janus kinase 2/signal transducer and activator of transcription 3 activation. Hypertension. 2010;56:879–884. doi: 10.1161/HYPERTENSIONAHA.110.158071. [DOI] [PMC free article] [PubMed] [Google Scholar]
- 48.Coles B, Fielding CA, Rose-John S, Scheller J, Jones SA, Donnell VBO. Classic interleukin-6 receptor signaling and interleukin-6 trans-signaling differentially control angiotensin II-dependent hypertension, cardiac signal transducer and activator of transcription-3 activation, and vascular hypertrophy in vivo. Am J Pathol. 2007;171:315–325. doi: 10.2353/ajpath.2007.061078. [DOI] [PMC free article] [PubMed] [Google Scholar]
- 49.Acosta-Rodríguez EV, Napolitani G, Lanzavecchia A, Sallusto F. Interleukins 1 beta and 6 but not transforming growth factor-beta are essential for the differentiation of interleukin 17-producing human T helper cells. Nat Immunol. 2007;8:942–949. doi: 10.1038/ni1496. [DOI] [PubMed] [Google Scholar]
- 50.Veldhoen M, Hocking RJ, Atkins CJ, Locksley RM, Stockinger B. TGF-β in the context of an inflammatory cytokine milieu supports de novo differentiation of IL-17 producing T cells. Immunity. 2006;24:179–189. doi: 10.1016/j.immuni.2006.01.001. [DOI] [PubMed] [Google Scholar]
- 51.Mangan PR, Harrington LE, Quinn DBO, Helms WS, Bullard DC, Elson CO, Hatton RD, Wahl SM, Schoeb TR, Weaver CT. Transforming growth factor-beta induces development of the TH17 lineage. Nature. 2006;441:231–234. doi: 10.1038/nature04754. [DOI] [PubMed] [Google Scholar]
- 52.Das J, Ren G, Zhang L, Roberts AI, Zhao X, Bothwell A, Van Kaer L, Shi Y, Das G. Transforming growth factor β is dispensable for the molecular orchestration of Th17 cell differentiation. J Exp Med. 2009;206:2407–2416. doi: 10.1084/jem.20082286. [DOI] [PMC free article] [PubMed] [Google Scholar]
- 53.Madhur MS, Lob HE, McCann LA, Iwakura Y, Blinder Y, Guzik TJ, Harrison DG. Interleukin 17 promotes angiotensin II-induced hypertension and vascular dysfunction. Hypertension. 2010;55:500–507. doi: 10.1161/HYPERTENSIONAHA.109.145094. [DOI] [PMC free article] [PubMed] [Google Scholar]
- 54.Nomoto T, Okada T, Shimazaki K, Yoshioka T, Nonaka-Sarukawa M, Ito T, Takeuchi K, Katsura KI, Mizukami H, Kume A, Ookawara S, Ikeda U, Katayama Y, Ozawa K. Systemic delivery of IL-10 by an AAV vector prevents vascular remodeling and end-organ damage in stroke-prone spontaneously hypertensive rats. Gene Ther. 2009;16:383–391. doi: 10.1038/gt.2008.151. [DOI] [PubMed] [Google Scholar]
- 55.Hermann M, Flammer A, Luscher TF. Nitric oxide in hypertension. J Clin Hypertens (Greenwich) 2006;8:17–29. doi: 10.1111/j.1524-6175.2006.06032.x. [DOI] [PMC free article] [PubMed] [Google Scholar]
- 56.Niedbala W, Cai B, Liew FY. Role of nitric oxide in the regulation of T cell functions. Ann Rheum Dis. 2006;65:iii37–iii40. doi: 10.1136/ard.2006.058446. [DOI] [PMC free article] [PubMed] [Google Scholar]
- 57.Matrougui K, Abd Elmageed Z, Kassan M, Choi S, Nair D, Gonzalez-Villalobos RA, Chentoufi AA, Kadowitz P, Belmadani S, Partyka M. Natural regulatory T cells control coronary arteriolar endothelial dysfunction in hypertensive mice. Am J Pathol. 2011;178:434–441. doi: 10.1016/j.ajpath.2010.11.034. [DOI] [PMC free article] [PubMed] [Google Scholar]
- 58.Moore KW, de Waal MR, Coffman RL, Garra AO. Interleukin-10 and the interleukin-10 receptor. Annu Rev Immunol. 2001;19:683–765. doi: 10.1146/annurev.immunol.19.1.683. [DOI] [PubMed] [Google Scholar]
- 59.Barhoumi T, Kasal DA, Li MW, Shbat L, Laurant P, Neves MF, Paradis P, Schiffrin EL. T regulatory lymphocytes prevent angiotensin II-induced hypertension and vascular injury. Hypertension. 2011;57:469–476. doi: 10.1161/HYPERTENSIONAHA.110.162941. [DOI] [PubMed] [Google Scholar]
- 60.Harrison DG, Guzik TJ, Lob HE, Madhur MS, Marvar PJ, Thabet SR, Vinh A, Weyand CM. Inflammation, immunity, and hypertension. Hypertension. 2011;57:132–140. doi: 10.1161/HYPERTENSIONAHA.110.163576. [DOI] [PMC free article] [PubMed] [Google Scholar]
- 61.Melaragno MG, Fink GD. Role of ANG II in hypertension produced by chronic inhibition of nitric oxide synthase in conscious rats. Am J Physiol. 1996;271:806–811. doi: 10.1152/ajpheart.1996.271.2.H806. [DOI] [PubMed] [Google Scholar]
- 62.Nabah YN, Mateo T, Cerdá-Nicolás M, Alvarez A, Martinez M, Issekutz AC, Sanz MJ. L-NAME induces direct arteriolar leukocyte adhesion, which is mainly mediated by angiotensin-II. Microcirculation. 2005;12:443–453. doi: 10.1080/10739680590960962. [DOI] [PubMed] [Google Scholar]