Summary
T cell immunoglobulin domain and mucin domain‐containing molecule‐3 (Tim‐3), a member of the immunoglobulin superfamily, has been shown to play a crucial role in host adaptive immunity and tolerance. However, its role in kidney ischaemia–reperfusion injury (IRI) remains unknown. In this study, we investigated the role and mechanism of Tim‐3 signalling after kidney IRI. In an established murine model of kidney IRI, we found that Tim‐3 expression is enhanced on monocytes/macrophages. Anti‐Tim‐3 antibody RMT3‐23 ameliorates biochemical and histological kidney injury, reduces apoptosis and decreases macrophage infiltration and cytokine production in ischaemic kidneys. Cell culture experiments also demonstrated that the role of Tim‐3 in IRI‐induced macrophage activation leads to the secretion of proinflammatory cytokines and chemokines. In addition, Toll‐like receptor (TLR)‐4 and Nod‐like receptor (NLR) family CARD domain‐containing protein 4 (NLR‐C4) expression were enhanced after kidney IRI and decreased significantly by RMT3‐23. Tim‐3 not only promotes TLR‐mediated nuclear factor kappa B (NF‐κB) activation and cytokine and chemokine release, but also participates in NLR‐C4 inflammasome activation. Taken together, our data confirm that Tim‐3 signalling enhances injury after kidney IRI and demonstrated that Tim‐3 is involved in regulating TLR‐4/NF‐κB signalling and NLR‐C4 inflammasome activation, which provide evidence that Tim‐3 signalling is critical for kidney IRI and may provide a new means to ameliorate kidney tissue immune responses in the clinics.
Keywords: inflammasome, kidney ischaemia–reperfusion injury, macrophages, NLR‐4, Tim‐3, TLR‐4
Introduction
Ischaemia–reperfusion injury (IRI) is a major cause of acute kidney injury (AKI) in both allograft and native kidneys due to the acute reduction of blood flow that produces hypoxia‐induced vascular and tubular dysfunction 1, 2. To date, there is no effective treatment to improve survival, limit injury or speed recovery except dialysis 3. IRI and acute rejection (AR) are two major factors affecting early functional recovery of kidney allograft 4. In the past, AR has always been the focus of the research, but with the development of clinical research and animal experiments, the impact of IRI on kidney allograft began to cause attention. Some studies showed that IRI not only cause delayed graft function (DGF), but also promote AR through the immune mechanism 5. In addition, IRI, as a major non‐antigen‐dependent factor, could lead directly to chronic rejection. Therefore, IRI affects early functional recovery of kidney allograft as well as significantly decreasing the long‐term survival rate of kidney allograft. How to reduce the impact of IRI on kidney allograft function is a major problem in kidney transplantation.
Animal models have demonstrated that a robust inflammatory reaction that results in tissue injury occurs following ischaemia–reperfusion (I/R) and the innate immunity plays a major role in the immune response to IRI 6, 7, 8, 9, 10. Innate immunity is the first‐line response defence against invading microorganisms by detecting pathogen‐associated molecular patterns (PAMPs) or damage‐associated molecular patterns (DAMPs) 11. DAMPs are molecules released by stressed cells that act as endogenous danger signals to promote and exacerbate the inflammatory response, which activate Toll‐like receptors (TLRs), purinergic receptors or the Nod‐like receptor (NLR)‐P3 inflammasome 12, 13, 14. TLR‐mediated cell activation induces nuclear factor kappa B (NF‐κB)‐dependent inflammatory cytokines and chemokines in all cells 15. In NLR‐P3 inflammasome, the activation of caspase‐1 and caspase‐11 confer proteolytic cleavage of pro‐interleukin (IL)‐1β and pro‐IL‐18 into the mature cytokines that trigger local inflammation inside the kidney 16. This process induces kidney inflammation and immunopathology. Macrophages are key regulators of inflammation and fibrosis 17, 18. After reperfusion, monocytes infiltrate the injured kidney at 24 h, differentiate into macrophages and increase in number to day 7. Macrophages secrete factors to augment, modulate or suppress inflammation. Initially, macrophages promote removal of infected or apoptotic cells at a proinflammatory state (classically activated M1 macrophages) and then contribute to the process of repair at a wound‐healing state (alternative‐activated M2 macrophages). However, the mechanisms that regulate macrophage activation and effector functions during the course of acute ischaemic kidney injury and repair are not well understood.
The T cell immunoglobulin domain and mucin domain‐containing molecule‐3 (Tim‐3), as one member of the Tim family, is identified initially as expressed on activated T helper type 1 (Th1) cells 19. Although present researches concerning Tim‐3 focus upon its role in negatively regulating Th1 cells and inducing immunological tolerance, Tim‐3 has been found to be expressed on, and to have more functions in, other types of cells, including dendritic cells (DC) and monocytes/macrophages 20, 21. Evidence gathered to date suggests that Tim‐3 plays an important role in innate and adaptive immune responses. Tim‐3 has either a negative or positive regulatory function on diverse cells during the immune response, and its dysregulated expression is related closely to many autoimmune diseases, viral infections and cancer 22, 23, 24, 25. For example, the down‐regulation of Tim‐3 expression on CD4+ effector cells could enhance T cell activation in patients with autoimmune hepatitis 26. However, the function of Tim‐3 in kidney IRI and the molecular mechanisms that the protein regulates are not yet clear.
In the present study, we assessed the contribution of Tim‐3 in kidney IRI and investigated the potential mechanisms which provide evidence that Tim‐3 signalling is critical for kidney IRI, and may provide new means to ameliorate tissue immune responses in clinics.
Materials and methods
Animals and kidney IRI model
Male C57BL/6N mice (aged 6–8 weeks) were purchased from SLAC Laboratory Animal (Shanghai, China). Mice were housed under specific pathogen‐free conditions receiving food and water at the Animal Center of General Hospital of Ji'nan Military Command and were adapted to laboratory conditions (temperature: 20 ± 2°C, relative humidity 50% and light/dark cycle: 12 h) for 1 week before experiment. The animal experiments were approved by the General Hospital of Ji'nan Military Command Animal Care and Use Committee.
Mice were food‐deprived for 12 h before the procedures and were anaesthetized with intraperitoneal injection of 1% sodium pentobarbital solution (40 mg/kg). Using a midline abdominal incision, bilateral renal IRI was induced by clamping both renal pedicles for 15 min. After removal of the clamp, the kidneys were inspected for confirming reperfusion. Body temperature was maintained at 37°C throughout the procedure. As a control, sham‐operated mice underwent the same procedure, except clamping of the renal pedicles. To investigate the role of Tim‐3, mice were injected intraperitoneally with 200 μg anti‐Tim‐3 antibody [RMT3–23; rat immunoglobulin (Ig)G2a, κ] 1 day prior to ischaemia insult, and then killed at 6, 24 and 48 h after reperfusion. Controls were treated with rat IgG antibody or phosphate‐buffered saline (PBS). At the time of death, blood was collected by retro‐orbital venous plexus puncture with heparinized capillary tubes, and kidneys were harvested for further analysis.
Renal function
Renal function was assessed by measurements of serum creatinine and cystatin C. Serum for creatinine and cystatin C measurement was taken at 6, 24 and 48 h after reperfusion.
Immunohistochemistry
Kidney tissue was fixed in 10% formalin for 12 h and then embedded in paraffin wax. For assessment of injury, 5‐μm sections were stained with periodic acid‐Schiff (PAS). Tubular injury was assessed in PAS‐stained sections using a semiquantitative scale 2. The percentage of cortical tubules showing epithelial necrosis was assigned a score: 0 = normal; 1 < 10%; 2 = 10–25%; 3 = 26–75%; and 4 > 5%. Sections were scored independently by two investigators who were blinded to the treatment of the animal. Ten fields of ×40 magnification were examined and averaged.
Terminal deoxynucleotidyl transferase (TdT) dUTP nick‐end labelling (TUNEL) assay
Apoptosis in kidney paraffin sections was detected by the TUNEL method using a commercial kit (Keygen Biotech, Nanjing, China). Negative control was prepared by omission on TdT. Positive controls were generated by treatment with DNase. TUNEL‐positive cell nuclei were counted in 20 randomly selected fields of each section by two investigators who were blinded to the treatment of the animal. Data were normalized to the mean value of the control group for statistical analysis.
Quantitative reverse transcription–polymerase chain reaction (RT–PCR)
Total RNA (2 μg) was reverse‐transcribed in a reaction volume of 20 μl using a RevertAid First Strand cDNA Synthesis Kit and Oligo dT. The product was diluted to a volume of 200 μl, and 1‐μl aliquots were used as templates for amplification using the SYBR Green PCR amplification reagent (Qiagen, Valencia, CA, USA) and gene‐specific primers. The primer sets used were: mouse tumour necrosis factor (TNF)‐α (forward: CCTGTAGCCCACGTCGTAG; reverse: GGGAGTAGACAAGGTACAACCC), interferon (IFN)‐γ (forward: ACAGCAAGGCGAAAAAGGATG; reverse: TGGTGGACCACTCGGATGA), IL‐6 (forward: CAATGGCAATTCTGATTGTATG; reverse: AGGACTCTGGCTTTGTCTTTC), IL‐18 (forward: TGTTGAGCATGAAAAGCCTCTAT; reverse: AGGTCTCCCGAATTGGAAAGG), chemokine (C‐X‐C motif) ligand (CXCL)‐1 (forward: ACTGCACCCAAACCGAAGTC; reverse: TGGGGACACCTTTTAGCATCTT) and CXCL‐2 (forward: CCAACCACCAGGCTACAGG; reverse: GCGTCACACTCAAGCTCTG). The amount of DNA was normalized to the glyceraldehyde‐3‐phosphate dehydrogenase (GAPDH) signal amplified in a separate reaction (forward: TATGTCGTGGAGTCTACTGGT; reverse: GAGTTGTCATATTTCTCGTGG).
Flow cytometry
Peripheral blood samples were obtained from mice and were collected into heparinized tubes. Peripheral blood mononuclear cells (PBMCs) were separated by Ficoll‐HyPaque, density gradient centrifugation (400 g for 20 min at 24°C) for the following experiment. Cells were fixed and incubated with the appropriated fluorochrome‐conjugated antibody for 15 min at room temperature for cell surface staining. Phycoerythrin (PE)‐conjugated anti‐mouse Tim‐3 (clone: RMT3–23) was used, which was purchased from eBioscience (San Diego, CA, USA). Flow cytometry (FCM) analysis was performed on a Beckman Coulter FC500‐MPL flow cytometer (Beckman Coulter, Brea, CA, USA). Data were analysed with FlowJo version 6.1 software (TreeStar, Ashland, OR, USA).
Immunofluorescence
Fresh tissue was snap‐frozen in liquid nitrogen. Cryosections of approximately 5 μm were cut and mounted on gelatin‐coated slides. Immunofluorescence was performed on cryosections using the following primary antibodies: anti‐mouse Tim‐3 (bs‐8766R; Bioss, Woburn, MA, USA), fluorescein isothiocyanate (FITC)‐conjugated anti‐mouse F4/80 (sc‐52664 FITC; Santa Cruz Technology, Dallas, TX, USA), anti‐CD11c antibody (ab11029; Abcam, Cambridge, MA, USA) and anti‐CD3 antibody (ab56313; Abcam). Sections were blocked with 10% normal goat serum for 1 h to block non‐specific binding to immunoglobulin. Then sections were incubated with primary antibody as appropriate overnight at 4°C. For Tim‐3, CD11c and CD3, sections were incubated further with FITC/tetramethylrhodamine isothiocyanate (TRITC)‐conjugated secondary antibodies for 1 h to visualize the bound primary antibodies. Specimens were analysed using confocal microscope Leica TCS SP5 with the digital image‐processing program ImageJ. Quantitative analysis of cell infiltration was performed by counting the number of positively labelled cells in 15 non‐overlapping high‐power fields (HPFs).
Western blot analysis
Western blot analysis was performed to measure protein expression. Kidney tissue or cells were homogenized in cold buffer and centrifuged at 14000 g for 20 min. The protein extracts were subjected to electrophoresis on 12% or 15% sodium dodecyl sulphate–polyacrylamide gel electrophoresis (SDS‐PAGE) gel that depends upon the molecular size of the protein and transferred to polyvinylidene difluoride (PVDF) membrane. The membranes were incubated in 5% non‐fat milk for 1 h at room temperature and then incubated with the following primary antibodies: cleaved anti‐caspase‐3 antibody (ab13847; Abcam), anti‐procaspase‐3 antibody (ab32150; Abcam), anti‐GAPDH antibody (KGAA002; Keygen Biotech), TLR‐4 (KG22755; Keygen Biotech), NF‐κB p105/p50 (pSer 337) (KG11017; Keygen Biotech), anti‐CARD12 (NLR‐C4) antibody (PB0658; Boster Biological Technology, Pleasanton, CA, USA), anti‐IKB alpha (phospho S36) antibody (ab133462; Abcam), anti‐caspase‐1 antibody (ab108362; Abcam) and anti‐pro caspase1 +p10 +p12 antibody (ab179515; Abcam), followed by incubation with horseradish peroxidase‐conjugated secondary antibody. Proteins were detected using enhanced chemiluminescence detection reagents. Protein loading was normalized to GAPDH expression using anti‐mouse GAPDH antibody.
Cell culture and hypoxia/reoxygenation treatment
Mouse macrophages (Raw 264.7 cells; ATCC, Manassas, VA, USA) were cultured in RPMI‐1640 medium containing 10% fetal bovine serum (FBS) at 37°C with 5% CO2. After stable transfection, Raw 264.7 cells were incubated at 4°C for 16 h in Soltran preserving solution in a closed chamber containing 8% O2 and 5% CO2 balanced with N2, and then recovered for 12 h at 37°C in RPMI‐1640 medium in a normal cell incubator. After hypoxia/reoxygenation, Raw 264.7 cell medium was collected for the following experiment.
shRNA transfection
RNA interference mediated by duplexes of 21‐nucleotide RNA was performed in Raw 264.7 cells. The following four shRNAs of Tim‐3 were synthesized by Shanghai GenePharma Co (Shanghai, China): Tim‐3‐mus‐157 (5'‐GGT TGG TAA GAA TGC CTA TCT‐3'), Tim‐3‐mus‐183 (5'‐GCA GTT ACA CTC TAT CTA CAC‐3'), Tim‐3‐mus‐499 (5'‐GGA CTC TAC TAC AGC TTC TCC‐3') and Tim‐3‐mus‐608 (5'‐GCTGAT GAA ATT AAG GAC TCT‐3'). A negative control shRNA duplex (shRNA‐NC 5'‐TTC TCC GAA CGT GTC ACG T‐3') was used, which did not target any known murine gene and was synthesized by Shanghai GenePharma Co (Shanghai, China). shRNA transfection was carried out with lipofectamine 2000 (Invitrogen, Carlsbad, CA, USA) according to the procedure recommended by the manufacturer.
Enzyme‐linked immunosorbent assay (ELISA)
Frozen kidneys were homogenized in PBS containing 1% Triton X‐100, 1 mM ethylenediamine tetraacetic acid (EDTA) and 1% protease inhibitor cocktail. The cell‐cultured supernatants were collected and centrifuged. Kidney homogenate TNF‐α, IFN‐γ, IL‐6, IL‐18, CXCL‐1 and CXCL‐2 content and their concentration in cultured supernatants were determined by commercially available ELISA kit (Keygen Biotech). ELISA was performed according to the manufacturer's instructions.
Human blood sample collection and isolation of peripheral blood mononuclear cells
This study was approved by the ethics committee of General Hospital of Ji'nan Military Command, Ji'nan, China. Written informed consent was obtained from patients for the collection and study of blood samples. Patients were included when the following inclusion criteria were met: (1) adult patients (age 18 ∼ 60 years); (2) acute kidney injury after ischaemia–reperfusion injury, a rapid decrease in the function of kidney, which was diagnosed if any one of the following was present: increase in serum creatinine (Scr) ≥ 0·3 mg/dl (≥ 26·4 μmol/l) within 48 h; increase in Scr to ≥ 1·5 times baseline measured within the previous 7 days; or urine volume < 0·5 ml/kg/h for 6 h. Exclusion criteria were as follows: kidney dysfunction caused by primary glomerular and tubular kidney disease or secondary kidney disease induced by diabetes or hypertension.
Peripheral blood samples were obtained from patients and volunteer donors and were collected into heparinized tubes. PBMCs were separated by Ficoll‐HyPaque, density gradient centrifugation (400 g for 20 min at 24°C) for the following experiment.
Analysis of gene expression with RT‐PCR array
Total RNA was isolated from PBMCs of patients and volunteer donors using TRIzol® reagent (Invitrogen, Carlsbad, CA, USA; #15596‐026). RNAs from six patients were pooled and used for cDNA probe preparation using RevertAid First Strand cDNA Systhesis Kit (Thermo Fisher, Fremont, CA, USA; #K1622). The human inflammasomes RT2 ProfilerTM PCR Arrays (Qiagen; #PAHS‐097Z) were used to analyse the inflammation‐related gene expression using real‐time RT–PCR according to the manufacturer's instruction.
Statistical analysis
Data were expressed as mean ± standard deviation (s.d.). Multiple group comparisons were performed by one‐way analysis of variance (anova), followed by the Bonferroni procedure for comparison of means. Comparisons between two groups were analysed by the two‐tailed t‐test. Differences were considered to be significant at P < 0·05. Analysis of the data was performed using GraphPad prism software (GraphPad Software, La Jolla, CA, USA).
Results
Expression of Tim‐3 is enhanced on monocytes/macrophages after kidney IRI
To determine whether Tim‐3 participate in kidney IRI, we investigated the expression of Tim‐3 in PBMCs from control mice that were subjected to kidney IRI using flow cytometric analysis. Compared with that of sham mice, Tim‐3 expression from peripheral blood was up‐regulated significantly at 6, 24 and 48 h in control mice, suggesting that Tim‐3 expression is induced following kidney IRI (Fig. 1a,b). As is well known, macrophages are key regulators of inflammation and fibrosis. To investigate whether the expression of Tim‐3 is induced on monocytes/macrophages after kidney IRI, we detected the expression of Tim‐3 on monocytes/macrophages from control mice using immunofluorescence. Kidney tissue from sham and control mice were stained with antibody to F4/80+, characterizing macrophages, in combination with anti‐Tim‐3. We found that the expression of Tim‐3 was up‐regulated on F4/80+ macrophages in kidney tissue from control mice compared with that obtained from sham mice (Fig. 1c). Meanwhile, no difference was detected in Tim expression and the number of CD3+ T cells and CD11c+ dendritic cells (Supporting information, Fig. S1). Taken together, these results suggested that Tim‐3 expression is induced on monocytes/macrophages after kidney IRI.
Figure 1.
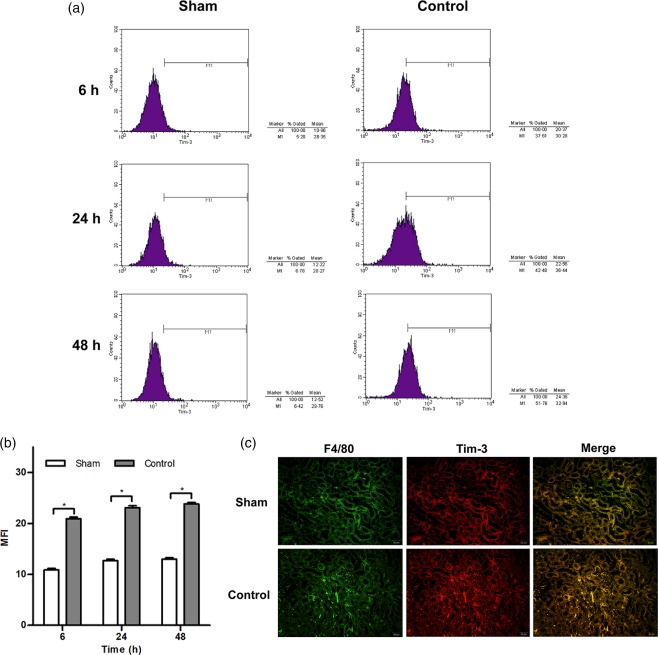
T cell immunoglobulin domain and mucin domain‐containing molecule‐3 (Tim‐3) expression is induced on monocytes/macrophages after kidney ischaemia–reperfusion injury (IRI). (a) Representative histograms show Tim‐3 expression in peripheral blood mononuclear cells (PBMCs) from control mice at 6, 24 and 48 h after kidney IRI injury. Sham‐operated mice were as used as controls. (b) The mean fluorescence intensity (MFI) of Tim‐3 expression in PBMCs was enhanced markedly at 6, 24 and 48 h after reperfusion. * P < 0·05 versus sham mice. (c) Representative immunofluorescence staining with anti‐F4/80 (original magnification ×400) and anti‐Tim‐3 (original magnification × 400).
Anti‐Tim‐3 antibody treatment protects against reperfusion injury and prevents renal dysfunction
To confirm further the role of Tim‐3 in kidney IRI, we assessed kidney function by measuring serum creatinine and cystatin C and investigating histological features. In comparison with sham mice, control mice caused significant renal dysfunction at 6, 24 and 48 h after reperfusion, as suggested by a significant increase in serum creatinine and cystatin C (Fig. 2a,b). However, the mice that were administered with anti‐Tim‐3 antibody RMT3–23 1 day before ischaemia had a marked reduction in serum creatinine and cystatin C.
Figure 2.
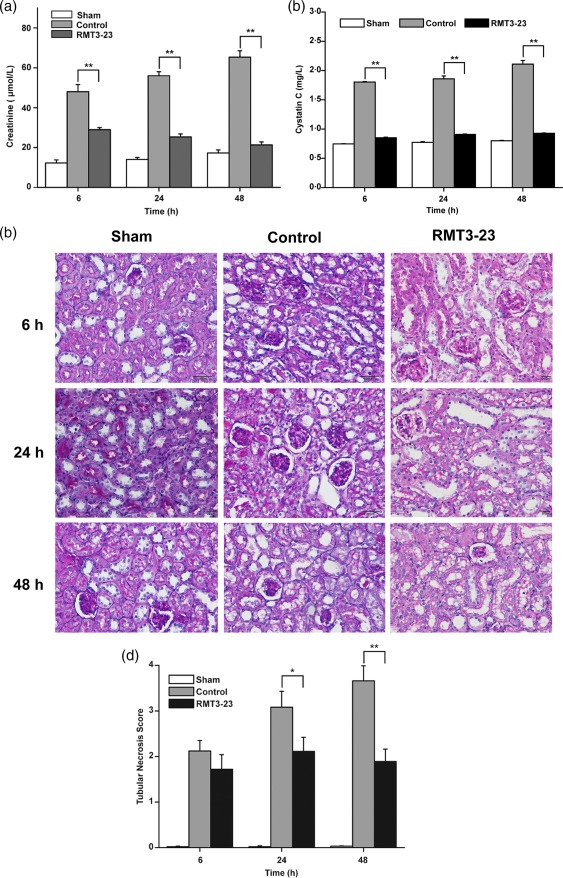
Anti‐mouse CD366/T cell immunoglobulin domain and mucin domain‐containing molecule‐3 (Tim‐3) (RMT3–23) prevents kidney dysfunction, protects against reperfusion injury and reduces histological features. (a) Control mice (light grey bars) show a dramatic elevation of serum creatinine levels at 6, 24 and 48 h after reperfusion over sham‐operated mice (white bars), whereas serum creatinine levels in RMT3–23‐treated mice (dark grey bars) were significantly lower at the same time‐point. Mean ± standard deviation (s.d.) (error bars) of three separate experiments performed in triplicate. * P < 0·05 control mice versus RMT3–23‐treated mice. (b) Control mice (light grey bars) show a dramatic elevation of cystatin C levels at 6, 24 and 48 h after reperfusion over sham‐operated mice (white bars), whereas cystatin C levels in RMT3–23‐treated mice (black bars) were significantly lower at the same time‐point. Mean ± s.d. (error bars) of three separate experiments performed in triplicate. * P < 0·05 control mice versus RMT3–23‐treated mice. (c) Representative periodic acid‐Schiff‐stained sections of outer medulla from sham, control and RMT3–23‐treated mice (original magnification ×400). (d) The injury was worse in control mice (dark grey bars) compared with sham‐operated mice (white bars), whereas RMT3–23 treatment (black bars) reduced the injury at 6, 24 and 48 h after reperfusion, especially significantly at 24 and 48 h. Graph represents the mean ± s.d. (error bars) of three separate experiments. * P < 0·05, ** P < 0·01 versus control mice.
Histology indicated that the kidney tissue from control group had tubular damage in the outer medulla, evidenced by widespread tubular necrosis, loss of the brush border, cast formation, tubular dilation and significant infiltration of neutrophils. In contrast, kidney tissues obtained from mice treated with RMT3–23 showed significantly less tubular damage at the same time‐point (Fig. 2c). Quantification of the tubular damage showed a markedly lower mean tubular injury score from the kidney of mice treated with anti‐Tim‐3 antibody (Fig. 2d). These results indicated that Anti‐Tim‐3 antibody could protect against reperfusion injury and prevent renal dysfunction, suggesting that Tim‐3 exacerbates kidney IRI.
Anti‐Tim‐3 antibody decreases macrophage infiltration and cytokine production in ischaemic kidneys
Quantification of infiltrating F4/80+ macrophages into kidney tissues by immunofluorescence showed that there were few infiltrating macrophages in kidney tissues obtained from sham mice. However, infiltrating F4/80+ macrophages were observed in kidney tissues in control mice subjected to IRI as early as 6 h and increased at 24 and 48 h. Treatment with RMT3–23 decreased the number of infiltrating macrophages significantly compared with control mice at the same time‐point (Fig. 3a,b).
Figure 3.
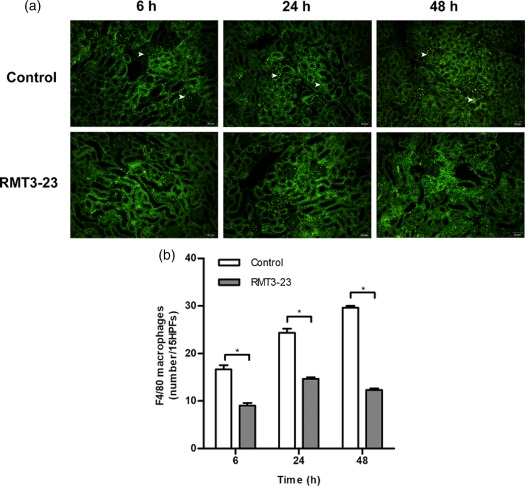
Anti‐mouse CD366/T cell immunoglobulin domain and mucin domain‐containing molecule‐3 (Tim3) (RMT3–23) decreases infiltration of F4/80+ macrophages in ischaemic kidneys. (a) Representative immunofluorescence staining with anti‐F4/80 (original magnification ×400); white arrows point to infiltrating macrophages. (b) The histograms show the numbers of a significant reduction in infiltrating F4/80+ macrophages at 6, 24 and 48 h after reperfusion. Mean ± standard deviation (error bars) of three separate experiments performed in triplicate. * P < 0·05 control mice versus RMT3–23‐treated mice.
To assess the role of macrophage activation products locally at the site of injury, we analysed the expression of the cytokines IFN‐γ, IL‐6, CXCL1, IL‐18, CXCL2 and TNF‐α by ELISA in ischaemic kidneys. Kidneys from control mice showed a marked up‐regulation of TNF‐α, IL‐18, CXCL1 and CXCL2 at 6, 24 and 48 h, whereas IFN‐γ and IL‐6 were up‐regulated only at 24 and 48 h after kidney IRI compared with sham mice (Fig. 4). Consistent with the diminished macrophage infiltration in RMT3–23‐treated mice, the results showed a reduced expression of the cytokines produced by macrophages, confirming at a molecular level the observed differences in organ function mentioned above.
Figure 4.
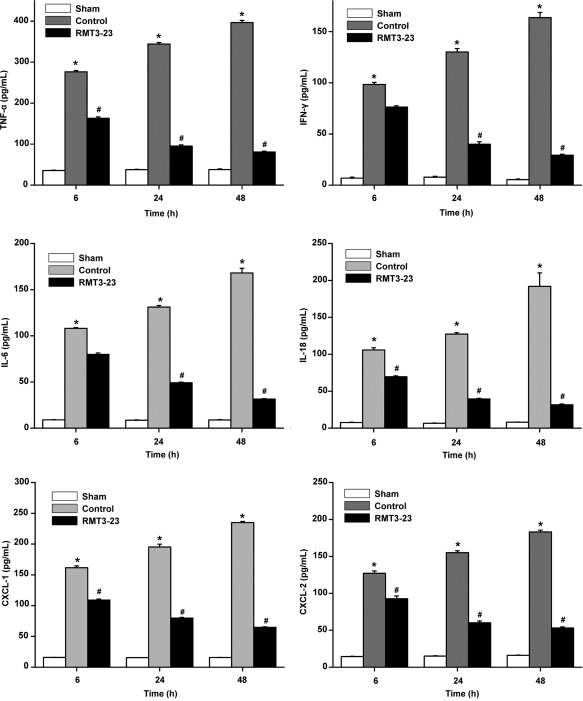
Diminished macrophage infiltration is associated with decreased cytokine production. At 6, 24 and 48 h after reperfusion, tumour necrosis factor (TNF)‐α, interferon (IFN)‐γ, interleukin (IL)‐6, IL‐18, chemokine (C‐X‐C motif) ligand (CXCL)‐1 and CXCL‐2 levels were assessed by enzyme‐linked immunosorbent assay (ELISA). * P < 0·05 versus sham; # P < 0·05 versus control. All the results are from three independent experiments. Graph represents the mean ± standard deviation (error bars).
Anti‐Tim‐3 antibody treatment reduces apoptosis in ischaemic kidneys
Kidney IRI is associated with ischaemia‐induced apoptosis, which might contribute to kidney dysfunction. To evaluate the role of Tim‐3 in the development of apoptosis in ischaemic kidneys, we scored the rate of apoptotic bodies in kidney tissues by TUNEL assay, the expression of anti‐apoptotic Bcl‐2, proapoptotic Bax and cleaved caspase‐3 by Western blotting. In control mice, approximately 20% of TUNEL‐positive cells were noted in the ischaemic kidney, whereas only a few TUNEL‐positive cells were seen in non‐ischaemic kidneys of sham mice. However, RMT3–23 reduced the number of TUNEL‐positive cells markedly compared with control mice (Fig. 5a,b). The expression of Bax was increased significantly and the expression of Bcl‐2 was decreased markedly after reperfusion. Consistently, the cleaved caspase‐3 intensity increased in the control mice compared with the sham mice, whereas RMT3–23 increased significantly the expression of Bcl‐2, decreased Bax and inhibited kidney IRI‐induced caspase‐3 activation (Fig. 5c,d).
Figure 5.
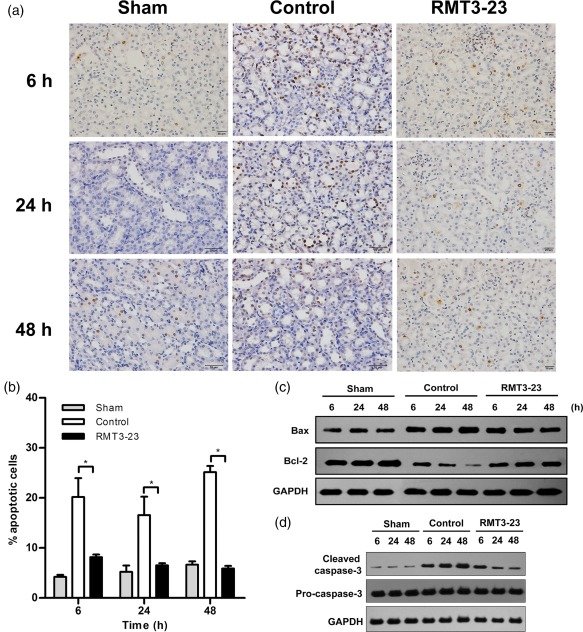
Anti‐mouse CD366/T cell immunoglobulin domain and mucin domain‐containing molecule‐3 (Tim‐3) (RMT3–23) reduces apoptosis in ischaemic kidneys. (a) Representative specimens after terminal deoxynucleotidyl transferase (TdT) dUTP nick‐end labelling (TUNEL) assay in sham, control and RMT3–23‐treated mice at 6, 24 and 48 h after reperfusion (original magnification ×400). (b) The histograms show the degree of apoptosis within ischaemic kidneys. RMT3–23 (black bars) markedly reduced the number of TUNEL‐positive cells. Mean ± standard deviation (error bars) of three separate experiments performed in triplicate. * P < 0·05 control mice versus RMT3–23‐treated mice. (c) Bax and Bcl‐2 levels in whole cell lysates were measured by Western blot. (d) Pro‐caspase‐3 and cleaved caspase‐3 levels in whole cell lysates were measured by Western blot.
Gal‐9/Tim‐3 signalling regulates cytokine and chemokine secretion in macrophages
We analysed further the immunomodulatory function of Tim‐3 in cell culture experiments, designed to mimic in‐vivo kidney IRI settings. Tim‐3 is efficiently over‐expressed or knocked down in stably transfected mouse macrophages (Supporting information, Fig. S2). The results showed that the expression of cytokines and chemokines, including TNF‐α, IL‐6, CXCL1, IL‐18 and CXCL2, was increased significantly by over‐expression of Tim‐3, either at gene or protein levels, in macrophages following hypoxia/reoxygenation (Fig. 6a,b). Conversely, knock‐down of Tim‐3 led to down‐regulation of these cytokines and chemokines. It has been demonstrated that the intracellular signalling of Tim‐3 begins after binding to its ligand, galectin 9 (Gal‐9) 27. To confirm further the involvement of Gal‐9/Tim‐3 signalling in regulating cytokine and chemokine secretion in macrophages, we detected the secretion of TNF‐α and IL‐6 from macrophages after over‐expression of Tim‐3 and addition of anti‐Gal‐9 antibody. As shown in Fig. 7, the expression of TNF‐α and IL‐6 increased by over‐expression of Tim‐3. Addition of anti‐Gal‐9 antibody could suppress the increase of TNF‐α and IL‐6 expression by over‐expression of Tim‐3. These results demonstrated that the role of Gal‐9/Tim‐3 signalling in IRI induced macrophage activation leading to the secretion of proinflammatory cytokines and chemokines, which may cause further renal cell necrosis.
Figure 6.
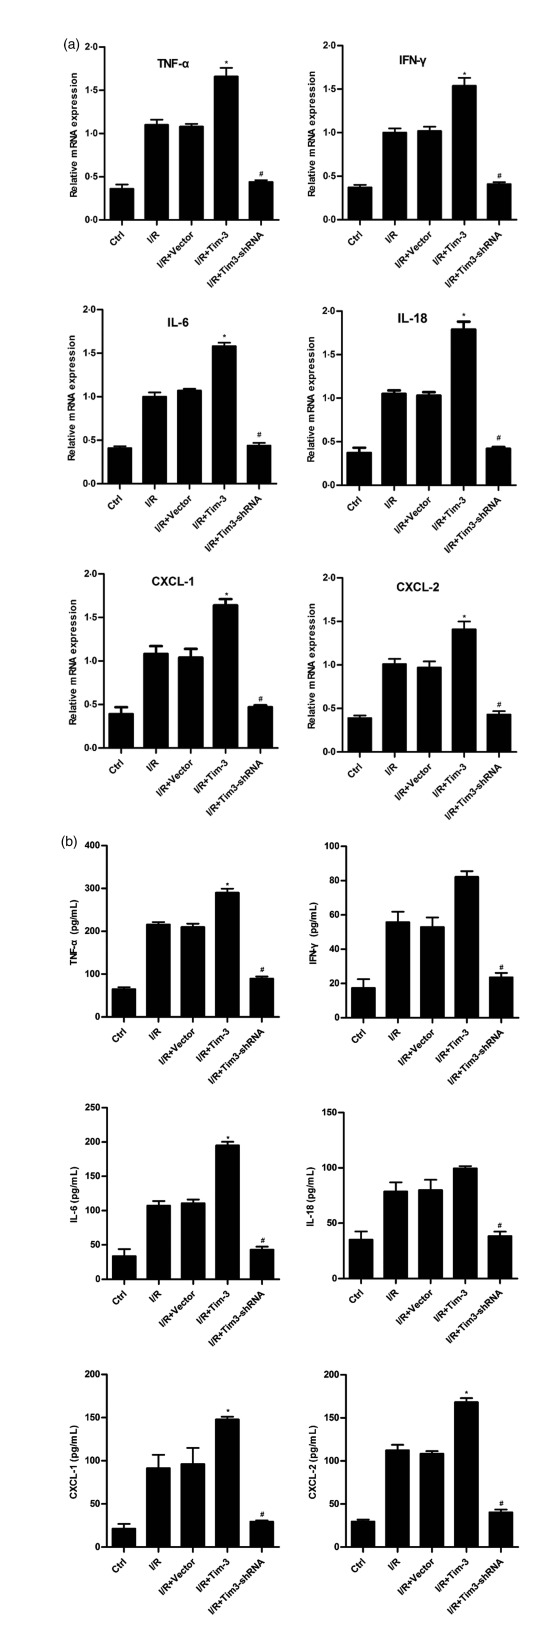
T cell immunoglobulin domain and mucin domain‐containing molecule‐3 (Tim‐3) regulates cytokine and chemokine secretion in macrophages. Inflammatory cytokines and chemokines were measured by quantitative polymerase chain reaction (qPCR) in whole cell lysates (a) and by enzyme‐linked immunosorbent assay (ELISA) in cell supernatant (b). * P < 0·05 versus I/R+vector; #P < 0·05 versus I/R+vector. All the results are from three independent experiments. Graph represents the mean ± standard deviation (error bars).
Figure 7.
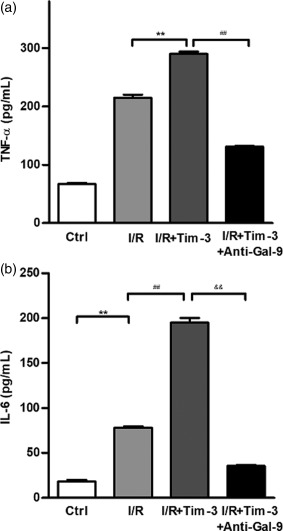
Galectin 9 (Gal‐9)/T cell immunoglobulin domain and mucin domain‐containing molecule‐3 (Tim‐3) signalling regulates tumour necrosis factor (TNF)‐α and interleukin (IL)‐6 secretion in macrophages. TNF‐α and IL‐6 in Tim‐3‐expressing macrophages were detected using enzyme‐linked immunosorbent assay (ELISA) with or without addition of anti‐Gal‐9 antibody. Addition of anti‐Gal‐9 antibody could suppress TNF‐α (a) and IL‐6 (b) secretion induced by over‐expression of Tim‐3. TNF‐α: ** P < 0·01 versus ischaemia–reperfusion (I/R), ## P < 0·01 versus I/R+Tim‐3; IL‐6: ** P < 0·01 versus control, ## P < 0·01 versus I/R, && P < 0·01 versus I/R+Tim‐3. All the results are from three independent experiments. Graph represents the mean ± standard deviation (error bars).
Tim‐3 is involved in regulating TLR‐4/NF‐κB signalling during kidney IRI
Previous studies have shown that TLR‐4 plays an important role in the pathogenesis of kidney IRI, which is central in the innate immune response that leads to kidney injury 28, 29. To determine if Tim‐3 was involved in regulating TLR‐4/NF‐κB signalling during kidney IRI, we detected TLR‐4 expression using Western blotting and quantitative PCR (qPCR). We found that TLR‐4 expression was increased significantly in the kidney tissue of control mice when compared with sham group mice, while RMT3–23 reduced the expression of TLR‐4 markedly (Fig. 8a–c). To confirm the role of Tim‐3 in TLR‐4/NF‐κB signalling, we investigated it in stably transfected mouse macrophages using culture cell experiments. Similar to the results mentioned above, over‐expression of Tim‐3 increased TLR‐4 expression, while knock‐down of Tim‐3 decreased its expression (Fig. 8d,e). The expression of TLR‐4 decreased when Tim‐3‐expressing macrophages were pretreated with anti‐Gal‐9 (Fig. 8f,g). NF‐κB is the downstream effector of the TLR‐4 signalling pathway, so we investigated the NF‐κB activation using Western blotting. The results showed that kidney IRI induced the activation of NF‐κB, and pretreatment with TAK‐242, a selective TLR‐4 signal transduction inhibitor, suppressed the activation of NF‐κB. Over‐expression of Tim‐3 could partly reverse the suppressive effect of TAK‐242 on the activation of NF‐κB (Fig. 8h). Moreover, we detected the secretion of TNF‐α and IL‐6 from macrophages. TAK‐242 could suppress the secretion of TNF‐α and IL‐6 from macrophages induced by IRI, while over‐expression of Tim‐3 could partly increase their secretion (Fig. 8i). Taken together, these results demonstrated Tim‐3 is involved in regulating TLR‐4/NF‐κB signalling during kidney IRI.
Figure 8.
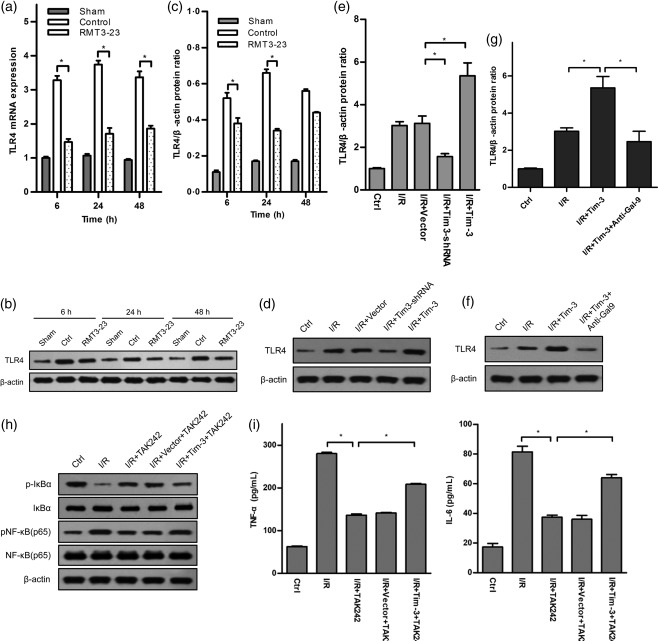
T cell immunoglobulin domain and mucin domain‐containing molecule‐3 (Tim‐3) is involved in Toll‐like receptor (TLR)‐4/nuclear factor kappa B (NF‐κB) signalling‐mediated kidney ischaemia–reperfusion injury (IRI). (a–c) TLR‐4 expression was measured by quantitative polymerase chain reaction (qPCR) and Western blot in sham, control and anti‐mouse CD366/TIM‐3 (RMT3–23)‐treated mice at 6, 24 and 48 h after reperfusion. Control mice (white bars) show a dramatic elevation of TLR‐4 expression levels at 6, 24 and 48 h after reperfusion over sham‐operated mice (grey bars), whereas TLR‐4 expression in RMT3–23‐treated mice (dot bars) were significantly lower at the same time‐point. Mean ± standard deviation (s.d.) (error bars) of three separate experiments performed in triplicate. * P < 0·05 control mice versus RMT3–23‐treated mice. (d,e) TLR‐4 expression was measured by Western blot in whole lysates from macrophages expressing or knock‐downing Tim‐3. Mean ± s.d. (error bars) of three separate experiments performed in triplicate. * P < 0·05 versus ischaemia–reperfusion (I/R)+vector. (f,g) TLR‐4 expression in Tim‐3‐expressing macrophages were detected using Western blot with or without addition of anti‐galectin 9 (Gal‐9) antibody. Addition of anti‐Gal‐9 antibody could suppress TLR‐4 expression induced by over‐expression of Tim‐3. * P < 0·05 I/R versus I/R+Tim‐3, I/R+Tim‐3 versus I/R+Tim‐3+anti‐Gal‐9. All the results are from three independent experiments. Graph represents the mean ± s.d. (error bars). (h, i) Over‐expression of Tim‐3 partly reverses the suppressive effect of TLR‐4 signal transduction inhibitor TAK242 on NF‐κB activation and tumour necrosis factor (TNF)‐α and IL‐6 secretion. * P < 0·05 I/R versus I/R+TAK242, I/R+vector+TAK242 versus I/R+Tim‐3+TAK242. All the results are from three independent experiments. Graph represents the mean ± standard deviation (error bars).
Tim‐3 is involved in regulating NLR‐C4 inflammasome activation during kidney IRI
Inflammasomes are central players in a series of infectious diseases and inflammatory processes. To investigate the role of Tim‐3 in inflammasome activation, we tested caspase‐1 cleavage and IL‐1β and IL‐18 secretion in kidney tissue using immunoblotting and ELISA. The results showed that caspase‐1 cleavage and IL‐1β and IL‐18 secretion were increased significantly in the kidney tissue of control mice when compared with sham group mice, while RMT3–23 reduced them markedly (Fig. 9a,b). Consistent with the result from mice, over‐expression of Tim‐3 in macrophages promotes caspase‐1 cleavage and IL‐1β, IL‐18 secretion, while knock‐down of Tim‐3 in macrophages reduces them (Fig. 9c,d). These results suggested that Tim‐3 is involved in inflammasome activation. In our previous result, to investigate changes in inflammasome‐related gene expression in AKI, we examined the differences in inflammasome‐related gene expression between healthy individuals and AKI patients using the human inflammasome RT Profiler PCR Arrays (Supporting information, Fig. S3). Of the 84 probed genes, 44 genes in AKI patients were expressed differentially more than twofold compared with the expression observed in healthy individuals (data not shown). Among the identified candidates, NLR‐C4, one of the NLR family, has attracted our attention. NLR‐C4 nucleates distinct inflammasome complexes that promote caspase‐1 activation and secretion of the proinflammatory cytokines IL‐1β and IL‐18. To confirm the regulatory function of Tim‐3 in NLR‐C4 inflammasome activation, we investigated the expression of NLR‐C4 using Western blotting and qPCR. The results showed that NLR‐C4 expression was increased significantly in the kidney tissue of control mice when compared with sham group mice, while RMT3–23 reduced the expression of NLR‐C4 markedly (Fig. 9e,f). Similar results were obtained from macrophages (Fig. 9g,h). These results suggested that Tim‐3 is involved in NLR‐C4 inflammasome activation during kidney IRI.
Figure 9.
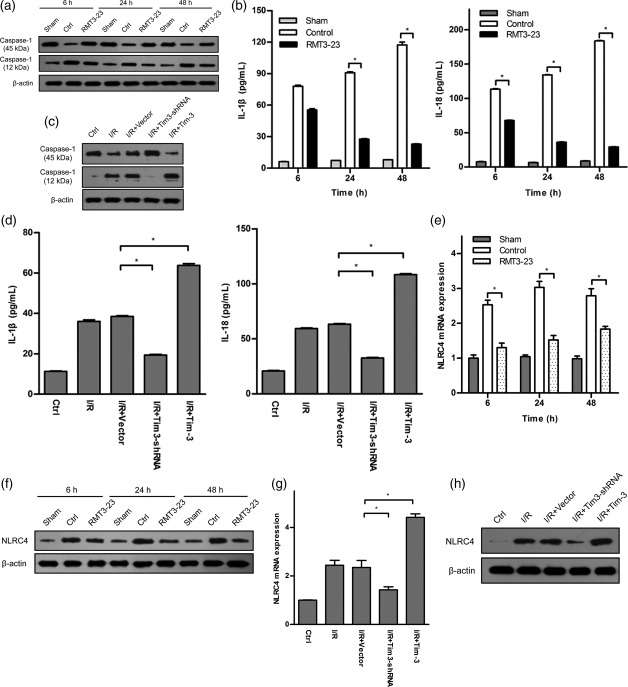
T cell immunoglobulin domain and mucin domain‐containing molecule‐3 (Tim‐3) is involved in Nod‐like receptor (NLR) family CARD domain‐containing protein 4 (NLR‐C4) inflammasome‐mediated kidney ischaemia–reperfusion injury (IRI). (a, b) Caspase‐1 cleavage and interleukin (IL)‐1β and IL‐18 secretion were measured by Western blot and enzyme‐linked immunosorbent assay (ELISA) in sham, control and anti‐mouse CD366/TIM‐3 (RMT3–23)‐treated mice at 6, 24 and 48 h after reperfusion. Mean ± standard deviation (s.d.) (error bars) of three separate experiments performed in triplicate. * P < 0·05 versus control. (c, d) Caspase‐1 cleavage and IL‐1β and IL‐18 secretion were measured by Western blot in whole lysates and by ELISA in cell supernatant from macrophages expressing or knock‐downing Tim‐3. Mean ± s.d. (error bars) of three separate experiments performed in triplicate. * P < 0·05 versus ischaemia–reperfusion (I/R)+vector. (e,f) NLR‐C4 expression was measured by quantitative polymerase chain reaction (qPCR) and Western blot in sham, control and RMT3–23‐treated mice at 6, 24 and 48 h after reperfusion. Control mice (white bars) show a dramatic elevation of NLR‐C4 expression levels at 6, 24 and 48 h after reperfusion over sham‐operated mice (grey bars), whereas NLR‐C4 expression in RMT3–23‐treated mice (dot bars) were significantly lower at the same time‐point. Mean ± s.d. (error bars) of three separate experiments performed in triplicate. * P < 0·05 versus control mice. (g,h) NLR‐C4 expression was measured by qPCR and Western blot from macrophages expressing or knock‐downing Tim‐3. Mean ± s.d. (error bars) of three separate experiments performed in triplicate. * P < 0·05 versus I/R+vector.
Discussion
The pathogenesis of kidney injury induced by I/R is complex and diverse. It is thought that the excessive inflammatory response induced by I/R is the main cause of kidney injury 30. The innate immune system, known as the first line of defence, plays an important role in kidney IRI. In transgenic mice, monocytes/macrophages and their produced cytokines, IL‐1β, IL‐6, infiltrate kidney tissue in days 1–5 following kidney I/R 31. Infiltrating monocytes/macrophages secrete IL‐8, macrophage inflammatory protein‐2 (MIP‐2) and other factors to promote their activation 32. Activated monocytes/macrophages exert anti‐inflammatory effects through producing inflammatory cytokines IL‐1α, IL‐6, IL‐12, IL‐18 and TNF‐α, and monocytes/macrophages may infiltrate into kidney tissue depending on chemokines 31, 33, 34. Compared with control mice, kidney injury is reduced significantly in chemokine‐deficient mice. In our study, macrophage infiltration was observed at 6 h following kidney IRI and is time‐dependent, which is consistent with that reported in previous literature 35, 36. We also found that the secretion of monocytes/macrophages produced cytokines TNF‐α, IL‐18 and chemokines CXCL‐1, CXCL‐2 increase significantly, suggesting that monocytes/macrophages participate in early innate immune response during kidney IRI. The initial reason for tissue injury in kidney IRI is acute decrease in blood flow, which results in ischaemia and hypoxia‐induced vascular and tubular dysfunction. Apoptosis and macrophage cytotoxicity play an important role in kidney IRI 37. In this study, we found that there were different pathological changes of tubular epithelial cell swelling, vacuolar degeneration and necrosis in I/R mice. The kidney injury score was markedly higher than that in the sham‐treated group. The apoptotic index of TUNEL assay, the apoptotic pathway related gene bax/bcl‐2 expression ratio and the caspase‐3 cleavage in I/R group increases compared with the sham‐treated group, suggesting that early injury induces the apoptosis and necrosis of renal endothelial and epithelial cells.
Tim‐3 is a co‐stimulatory molecule found on the surface of activated Thl cells, which is involved in specific immune responses by negatively regulating the function of Th1 cells. Abnormalities or intervention of this negative regulatory pathway will result in or exacerbate the Th1 dominant autoimmune response, e.g. multiple sclerosis, allograft rejection and even anti‐viral immune responses. With further research, Tim‐3 has been found to be expressed in DC, macrophages, mast cells and other natural immune cells with different functions. Tim‐3 on macrophages or natural immune cells functions as a positive regulator, which promotes the release of inflammatory mediators, e.g. TNF‐α, IL‐6. These studies suggest that Tim‐3 signalling plays a bidirectional immunomodulatory role in different disease models and in different cell types. Recent studies have showed that Tim‐3 plays a critical role in monocytes/macrophages pattern recognition and phagocytosis of apoptotic cells 38, 39. However, the role of Tim‐3 in kidney IRI and its related mechanism remain unclear. In the present study, in an established murine model of kidney IRI, anti‐Tim‐3 antibody RMT3–23 ameliorates biochemical and histological kidney injury, reduces apoptosis and decreases macrophage infiltration and cytokine production in ischaemic kidneys. Similar results were from cell culture experiments. These results suggest that Tim‐3 signalling enhances injury after kidney IRI and may be a therapeutic target.
Tim‐3 is expressed constitutively on cells of the innate immune system in both mice and humans. It can synergize with TLRs to promote immune responses 40. TLRs can trigger multiple downstream effects, activate the NF‐κB signalling pathway, promote the production of inflammatory cytokines and chemokines, cause granulocyte and macrophage chemotaxis and increase capillary permeability to participate in kidney IRI. Meanwhile, kidney interstitial infiltrating monocytes/macrophages release inflammasomes, activate caspase‐1, release IL‐1β, IL‐18 and other cytokines and induce kidney local inflammatory response to regulate DAMPs‐induced damage process 41, 42, 43. In our study, we found that Tim‐3 is involved in TLR‐4/NF‐κB signalling and NLR‐C4 inflammasome‐mediated kidney IRI. Therefore we speculate that, after I/R, the expression of Tim‐3 is enhanced on monocytes/macrophages, which induces the activation of infiltrating macrophages. Meanwhile, early injury induces the necrosis of renal endothelial and epithelial cells, which leads to DAMPs release. These DAMPs activate TLR‐4 and NLR‐C4 inflammasome in macrophages. Upon activation, these cells produce inflammatory cytokines and chemokines that cause further renal cell necrosis (e.g. by TNF‐induced necroptosis) (Fig. 10). Nevertheless, how Tim‐3 triggers the activation of macrophages after I/R remains unclear. This requires further investigation.
Figure 10.
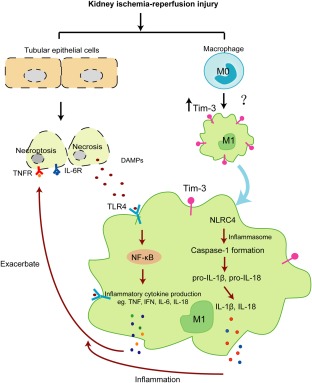
Scheme of the involvement of T cell immunoglobulin domain and mucin domain‐containing molecule‐3 (Tim‐3) in kidney ischaemia–reperfusion injury through Toll‐like receptor (TLR)‐4/nuclear factor kappa B (NF‐κB)/Nod‐like receptor (NLR) family CARD domain‐containing protein 4 (NLR‐C4) inflammasome pathways.
This study provides evidence that Tim‐3 signalling enhances injury after kidney IRI and demonstrated that Tim‐3 is involved in regulating TLR‐4/NF‐κB signalling and NLR‐C4 inflammasome activation. These findings provide evidence that Tim‐3 signalling is critical for kidney IRI and may provide new means to ameliorate kidney tissue immune responses in clinics.
Disclosure
The authors have no conflicts of interest to disclose.
Supporting information
Additional Supporting Information may be found in the online version of this article at the publisher's website:
Fig. S1. The expression of T cell immunoglobulin domain and mucin domain‐containing molecule‐3 (Tim‐3) on CD3+ T cells and CD11c+ dendritic cells. (a) Representative immunofluorescence staining with anti‐CD3 (original magnification ×400) and anti‐Tim‐3 (original magnification ×400). (b) Representative immunofluorescence staining with anti‐CD11c (original magnification ×400) and anti‐Tim‐3 (original magnification ×400).
Supplementary Figure 1b
Fig. S2. The expression of T cell immunoglobulin domain and mucin domain‐containing molecule‐3 (Tim‐3) in macrophages stably expressing or knock‐downing Tim‐3. (a,b) The mRNA expression of Tim‐3 was detected by quantitative polymerase chain reaction (qPCR) in macrophages stably expressing or knock‐downing Tim‐3. Mean ± standard deviation (error bars) of three separate experiments performed in triplicate. ** P < 0·01 versus NC‐shRNA or vector. (c,d) The protein expression of Tim‐3 was detected by Western blot in macrophages stably expressing or knock‐downing Tim‐3.
Supplementary Figure 2b
Supplementary Figure 2c
Supplementary Figure 2d
Fig. S3. Heat‐map representation of polymerase chain reaction (PCR)‐array analysis.
Acknowledgements
This work was supported by the National Natural Science Foundation of China (Grant no. 81300582; 81601393).
Contributor Information
Y. Guo, Email: yunshan_jn@163.com
M. Chen, Email: soso1010@126.com.
References
- 1. Ympa YP, Sakr Y, Reinhart K, Vincent JL. Has mortality from acute renal failure decreased? A systematic review of the literature. Am J Med 2005; 118:827–32. [DOI] [PubMed] [Google Scholar]
- 2. Bonventre JV, Yang L. Cellular pathophysiology of ischemic acute kidney injury. J Clin Invest 2011; 121:4210–21. [DOI] [PMC free article] [PubMed] [Google Scholar]
- 3. Rewa O, Bagshaw SM. Acute kidney injury – epidemiology, outcomes and economics. Nat Rev Nephrol 2014; 10:193–207. [DOI] [PubMed] [Google Scholar]
- 4. Nankivell BJ, Alexander SI. Rejection of the kidney allograft. N Engl J Med 2010; 363:1451–62. [DOI] [PubMed] [Google Scholar]
- 5. Perico N, Cattaneo D, Sayegh MH. Delayed graft function in kidney transplantation. Lancet 2004; 364:1814–27. [DOI] [PubMed] [Google Scholar]
- 6. Sharfuddin AA, Molitoris BA. Pathophysiology of ischemic acute kidney injury. Nat Rev Nephrol 2011; 7:189–200. [DOI] [PubMed] [Google Scholar]
- 7. Thurman JM. Triggers of inflammation after renal ischemia/reperfusion. Clin Immuno 2007; 123:7–13. [DOI] [PMC free article] [PubMed] [Google Scholar]
- 8. Jang HR, Rabb H. Immune cells in experimental acute kidney injury. Nat Rev Nephrol 2015; 11:88–101. [DOI] [PubMed] [Google Scholar]
- 9. Denecke C, Tullius SG. Innate and adaptive immune responses subsequent to ischemia–reperfusion injury in the kidney. Prog Urol 2014; 24:S13–9. [DOI] [PubMed] [Google Scholar]
- 10. Eltzschig HK, Eckle T. Ischemia and reperfusion – from mechanism to translation. Nat Med 2011; 17:1391–401. [DOI] [PMC free article] [PubMed] [Google Scholar]
- 11. Turvey SE, Broide DH. Innate immunity. J Allergy Clin Immunol 2010; 125:S24–32. [DOI] [PMC free article] [PubMed] [Google Scholar]
- 12. Vénéreau E, Ceriotti C, Bianchi ME. DAMPs from cell death to new life. Front Immunol 2015; 6:422. [DOI] [PMC free article] [PubMed] [Google Scholar]
- 13. Braza F, Brouard S, Chadban S et al Role of TLRs and DAMPs in allograft inflammation and transplant outcomes. Nat Rev Nephrol 2016; 12:281–90. [DOI] [PMC free article] [PubMed] [Google Scholar]
- 14. He Y, Hara H, Núñez G. Mechanism and regulation of NLRP3 inflammasome activation. Trends Biochem Sci 2016; 41:1012–21. [DOI] [PMC free article] [PubMed] [Google Scholar]
- 15. Rosin DL, Okusa MD. Dangers within: DAMP responses to damage and cell death in kidney disease. J Am Soc Nephrol 2011; 22:416–25. [DOI] [PMC free article] [PubMed] [Google Scholar]
- 16. Lorenz G, Darisipudi MN, Anders HJ. Canonical and non‐canonical effects of the NLRP3 inflammasome in kidney inflammation and fibrosis. Nephrol Dial Transplant 2014; 29:41–8. [DOI] [PubMed] [Google Scholar]
- 17. Huen SC, Cantley LG. Macrophages in renal injury and repair. Annu Rev Physiol 2017; 79:449–69. [DOI] [PubMed] [Google Scholar]
- 18. Huen SC, Cantley LG. Macrophage‐mediated injury and repair after ischemic kidney injury. Pediatr Nephrol 2015; 30:199–209. [DOI] [PMC free article] [PubMed] [Google Scholar]
- 19. Sánchez‐Fueyo A, Tian J, Picarella D et al Tim‐3 inhibits T helper type 1‐mediated auto‐ and alloimmune responses and promote immunological tolerance. Nat Immunol 2003; 4:1093–101. [DOI] [PubMed] [Google Scholar]
- 20. Yang X, Jiang X, Chen G et al T cell Ig mucin‐3 promotes homeostasis of sepsis by negatively regulating the TLR response. J Immunol 2013; 190:2068–79. [DOI] [PubMed] [Google Scholar]
- 21. Chiba S, Baghdadi M, Akiba H et al Tumor‐infiltrating DCs suppress nucleic acid‐mediated innate immune responses through interactions between the receptor TIM‐3 and the alarmin HMGB1. Nat Immunol 2012; 13:832–42. [DOI] [PMC free article] [PubMed] [Google Scholar]
- 22. Yi W, Zhang P, Liang Y et al T‐bet‐mediated Tim‐3 expression dampens monocyte function during chronic hepatitis C virus infection. Immunology 2017; 150:301–11. [DOI] [PMC free article] [PubMed] [Google Scholar]
- 23. Li S, Peng D, He Y et al Expression of TIM‐3 on CD4+ and CD8+ T cells in the peripheral blood and synovial fluid of rheumatoid arthritis. APMIS 2014; 122:899–904. [DOI] [PubMed] [Google Scholar]
- 24. Granier C, Dariane C, Combe P et al Tim‐3 expression on tumor‐infiltrating PD‐1+CD8+ T cells correlates with poor clinical outcome in renal cell carcinoma. Cancer Res 2017; 77:1075–82. [DOI] [PubMed] [Google Scholar]
- 25. Shen P, Yue R, Tang J et al Preferential Tim‐3 expression on Treg and CD8(+) T cells, supported by tumor‐associated macrophages, is associated with worse prognosis in gastric cancer. Am J Transl Res 2016; 8:3419–28. [PMC free article] [PubMed] [Google Scholar]
- 26. Ju Y, Shang X, Liu Z et al The Tim‐3/galectin‐9 pathway involved in the homeostasis of hepatic Tregs in a mouse model of concanavalin A‐induced hepatitis. Mol Immunol 2014; 58:85–91. [DOI] [PubMed] [Google Scholar]
- 27. Zhu C, Anderson AC, Schubart A et al The Tim‐3 ligand galectin‐9 negatively regulates T helper type 1 immunity. Nat Immunol 2005; 6:1245–52. [DOI] [PubMed] [Google Scholar]
- 28. Wu HL, Chen G, Wyburn KR et al TLR4 activation mediates kidney ischemia/reperfusion injury. J Clin Invest 2007; 117:2847–59. [DOI] [PMC free article] [PubMed] [Google Scholar]
- 29. Zhao H, Perez JS, Lu S, George AJ, Ma D. Role of Toll‐like receptor‐4 in renal graft ischemia‐reperfusion injury. Am J Physiol Renal Physiol 2014; 306:F801–11. [DOI] [PMC free article] [PubMed] [Google Scholar]
- 30. Thurman JM. Triggers of inflammation after renal ischemia/reperfusion. Clin Immunol 2007; 123:7–13. [DOI] [PMC free article] [PubMed] [Google Scholar]
- 31. Li L, Huang L, Sung SS et al The chemokine receptors CCR2 and CX3CR1 mediate monocyte/macrophage trafficking in kidney ischemia‐reperfusion injury. Kidney Int 2008; 74:1526–37. [DOI] [PMC free article] [PubMed] [Google Scholar]
- 32. Lemay S, Rabb H, Postler G et al Prominent and sustained up‐regulation of gp130‐signaling cytokine and the chemokine MIP‐2 in murine renal ischemia–reperfusion injury. Transplantation 2000; 69:959–63. [DOI] [PubMed] [Google Scholar]
- 33. Oh DJ, Dursun B, He Z et al Fractalkine receptor (CX3CR1) inhibition is protective against ischemic acute renal failure in mice. Am J Physiol Renal Physiol 2008; 294:F264–71. [DOI] [PubMed] [Google Scholar]
- 34. Vazquez‐Torres A, Stevanin T, Jones‐Carson J et al Analysis of nitric oxide‐dependent antimicrobial actions in macrophages and mice. Methods Enzymol 2008; 437:521–38. [DOI] [PMC free article] [PubMed] [Google Scholar]
- 35. Rabb H. The T cell as a bridge between innate and adaptive immune systems: implications for the kidney. Kidney Int 2002; 61:1935–46. [DOI] [PubMed] [Google Scholar]
- 36. Rodríguez‐Iturbe B, Pons H, Herrera‐Acosta J et al Role of immunocompetent cells in nonimmune renal diseases. Kidney Int 2001; 59:1626–40. [DOI] [PubMed] [Google Scholar]
- 37. Li L, Okusa MD. Macrophages, dendritic cells, and kidney ischemia–reperfusion injury. Semin Nephrol 2010; 30:268–77. [DOI] [PMC free article] [PubMed] [Google Scholar]
- 38. Nakayama M, Akiba H, Takeda K et al Tim‐3 mediates phagocytosis of apoptotic cells and cross‐presentation. Blood 2009; 113:3821–30. [DOI] [PubMed] [Google Scholar]
- 39. Elliott MR, Ravichandran KS. Clearance of apoptotic cells: implications in health and disease. J Cell Biol 2010; 189:1059–70. [DOI] [PMC free article] [PubMed] [Google Scholar]
- 40. Anderson AC, Anderson DE, Bregoli L et al Promotion of tissue inflammation by the immune receptor Tim‐3 expressed on innate immune cells. Science 2007; 318:1141–3. [DOI] [PubMed] [Google Scholar]
- 41. Schaefer L. Extracellular matrix molecules: endogenous danger signals as new drug targets in kidney diseases. Curr Opin Pharmacol 2010; 10:185–90. [DOI] [PubMed] [Google Scholar]
- 42. El‐Achkar TM, Wu XR, Rauchman M et al Tamm–Horsfall protein protects the kidney from ischemic injury by decreasing inflammation and altering TLR4 expression. Am J Physiol Renal Physiol 2008; 295:F534–44. [DOI] [PMC free article] [PubMed] [Google Scholar]
- 43. Lamkanfi M, Dixit VM. Inflammasomes and their roles in health and disease. Annu Rev Cell Dev Biol 2012; 28:137–61. [DOI] [PubMed] [Google Scholar]
Associated Data
This section collects any data citations, data availability statements, or supplementary materials included in this article.
Supplementary Materials
Additional Supporting Information may be found in the online version of this article at the publisher's website:
Fig. S1. The expression of T cell immunoglobulin domain and mucin domain‐containing molecule‐3 (Tim‐3) on CD3+ T cells and CD11c+ dendritic cells. (a) Representative immunofluorescence staining with anti‐CD3 (original magnification ×400) and anti‐Tim‐3 (original magnification ×400). (b) Representative immunofluorescence staining with anti‐CD11c (original magnification ×400) and anti‐Tim‐3 (original magnification ×400).
Supplementary Figure 1b
Fig. S2. The expression of T cell immunoglobulin domain and mucin domain‐containing molecule‐3 (Tim‐3) in macrophages stably expressing or knock‐downing Tim‐3. (a,b) The mRNA expression of Tim‐3 was detected by quantitative polymerase chain reaction (qPCR) in macrophages stably expressing or knock‐downing Tim‐3. Mean ± standard deviation (error bars) of three separate experiments performed in triplicate. ** P < 0·01 versus NC‐shRNA or vector. (c,d) The protein expression of Tim‐3 was detected by Western blot in macrophages stably expressing or knock‐downing Tim‐3.
Supplementary Figure 2b
Supplementary Figure 2c
Supplementary Figure 2d
Fig. S3. Heat‐map representation of polymerase chain reaction (PCR)‐array analysis.


