Abstract
Background: RCC is a malignant tumor that originates from renal tubular epithelial cells, accounting for nearly 90% of renal malignancies and 3% of adult malignancies. It was reported that more than 30-40% of patients with early localized RCC still have recurrence and metastasis after receiving radical surgery. miRNAs are an endogenous non-coding small RNAs that play an important role in the regulation of tumor cell proliferation, differentiation and apoptosis. Methods: In our study, RT-qPCR, CCK-8 assay, wound scratch assay, transwell assay and flow cytometry assay were designed to identify the expression and functions of miR-18a-5p in RCC. Moreover, we collected the survival data from The Cancer Genome Atlas to predict and clarify the prognostic functions of miR-18a-5p in RCC. The correlation between miR-18a-5p expression and clinicopathological variables or overall survival was analyzed by 42 formalin-fixed paraffin-embedded (FFPE) renal cancer samples. Results: The expression of miR-18a-5p in RCC tissues and cell lines was elevated. Further researches suggested that upregulation of miR-18a-5p had a positive effect on RCC cell proliferation, migration, invasion and inhibition of apoptosis, while down-regulation of miR-18a-5p neutralized the effect. In addition, Data of TCGA and prognostic analysis of FFPE RCC samples revealed that high miR-18a-5p expression patients had significantly poorer survival. Conclusions: These results demonstrated that miR-18a-5p functioned as an oncogene and prognostic biomarker in RCC.
Keywords: MicroRNAs, miR-18a-5p, renal cell carcinoma, oncogene, prognosis biomarker
Introduction
Renal cell carcinoma (RCC) is a malignant tumor that originates from renal tubular epithelial cells, accounting for nearly 90% of renal malignancies and 3% of adult malignancies [1]. Renal clear cell carcinoma (ccRCC), associated with inactivation of the VHL gene, is the most common subtype of RCC [2]. Early RCC is clinically asymptomatic and frequently incidentally found by imaging. 20% to 30% of patients are already experiencing advanced disease or metastasis when they are diagnosed with RCC [3]. At present, the main treatment for RCC is radical resection. However, it was reported that more than 30-40% of patients with early localized RCC still had recurrence and metastasis after receiving radical surgery [4]. Therefore, it’s of great significance to study the molecular mechanism of the occurrence and development of RCC so as to lay the foundation for finding the early diagnosis and prognosis markers of RCC.
MicroRNAs (miRNAs) are an endogenous non-coding small RNAs widely distributed in animal and plant cells. A large number of studies have found that miRNAs play an important role in the occurrence and development of malignant tumors, including the regulation of tumor cell proliferation, differentiation and apoptosis [5,6]. In addition, miRNAs may be tumor markers and targets that have an impact on tumor diagnosis and prognosis.
Recent studies had reported that miR-18a-5p was highly expressed in esophageal cancer, colon cancer, pancreatic cancer and liver cancer tissues [7-10], and played an important role in the proliferation of hepatocellular carcinoma [11]. In addition, it was reported that the high expression of miR-18a-5p in NPC was closely related to the clinicopathological progress of patients [12]. However, the research of miR-18a-5p in RCC had not been reported yet. Therefore, the purpose of this study is to detect the expression of miR-18a-5p in RCC tissues and cells and the effects of miR-18a-5p on the proliferation, migration, invasion and apoptosis of RCC cells. More, the relationship between miR-18a-5p expression and clinical pathological variables or overall survival was determined by TCGA data and further experiments.
Materials and methods
Human tissue samples collection
From January 2015 to May 2016, 42 specimens of RCC and adjacent normal tissues (about 3.0 cm outside the visible RCC lesions) from Peking University Shenzhen Hospital (Shenzhen, China) were collected. This study was reviewed and approved by the Ethics Committee of Peking University Shenzhen Hospital. Informed consent was signed by all participating patients. Surgical excised specimens of RCC tissue and para-cancerous tissue were submerged in RNAlater (Qiagen GmbH, Hilden, Germany) for 30 minutes and stored in a refrigerator at -80°C for protection against RNA degradation. Clinical staging was in accordance with the WHO classification of RCC and the American Cancer Federation staging system. The clinical and pathological features of the patients are shown in Table 1.
Table 1.
Clinicopathological features in RCC patients
| Characteristics | Number of cases |
|---|---|
| Mean age range (years) | 52 (27-78) |
| Sexual distinction | |
| Male/Female | 34/8 |
| Histological type | |
| Clear cell/papillary | 36/6 |
| Tumor stage | |
| T1/T2/T3+T4 | 26/14/2 |
| Fuhrman grade | |
| I/II/III/IV | 26/13/2/1 |
| AJCC clinical stages | |
| I/II/III+IV | 28/13/1 |
pT, primary tumor; AJCC, American Joint Committee on Cancer.
Formalin-fixed paraffin-embedded tissue specimens
The formalin-fixed paraffin-embedded (FFPE) samples of RCC were collected from Peking University Shenzhen Hospital. The FFPE RCC samples were from the patients who underwent an operation at Peking University Shenzhen Hospital between 2010 and 2013. The clinicopathological features of each patients was analyzed accordance with the 2010 American Joint Committee on Cancer staging system (Table 4). The miRNeasy FFPE Kit (Qiagen) was used to extract total RNA of the FFPE samples.
Table 4.
Association between miR-18a-5p expression level1 and Clinical information in FFPE renal cancer samples
| Variable | Total | No. of patients (%) | P-value2 | |
|---|---|---|---|---|
|
| ||||
| High | Low | |||
| Gender | ||||
| Male | 26 | 14 | 12 | 0.751 |
| Female | 16 | 7 | 9 | |
| Age (Years) | ||||
| ≤ 60 | 33 | 16 | 17 | 1.000 |
| > 60 | 9 | 5 | 4 | |
| Tumor size (cm) | ||||
| ≤ 4.0 | 17 | 8 | 9 | 1.000 |
| > 4.0 | 25 | 13 | 12 | |
| Tumor stage | ||||
| I+II | 27 | 12 | 15 | 0.520 |
| III+IV | 15 | 9 | 6 | |
cut-off point: median;
calculated using Fisher’s Exact test or Pearson Chi-square test.
Cell culture and cell transfection
One human embryonic kidney cell line (293-T) and three human renal carcinoma cell lines (7860, ACHN and Caki-1) were used in this study. Cells were cultured in Dulbecco’s modified Eagle’s medium (DMEM; Invitrogen Life Technologies, Inc., Carlsbad, CA, USA), 10% fetal bovine serum (FBS; Invitrogen Life Technologies, Inc), 1% antibiotics (100 U/ml penicillin and 100 mg/ml streptomycin; Gibco, Thermo Fisher Scientific) and 1% glutamine. The cells were placed in a humidified incubator containing 5% carbon dioxide at 37°C for cultivation. For cell transfection, mixed liquor was made up of 200 ul Opti-MEM media (Gibco; Thermo Fisher Scientific, Inc.), 200 pmol synthetic miR-18a-5p mimic(GenePharma, Suzhou, China), inhibitor, negative control (NC) or inhibitor negative control (NC inhibitor) and 5 ul Lipofectamine 2000 (Invitrogen; Thermo Fisher Scientific, Inc.). Followed by the corresponding experimental tests were performed. The sequences are listed in Table 2.
Table 2.
Sequences of primers and microRNAs
| Primer/microRNA | Sequence |
|---|---|
| miR-18a-5p | Forward: 5’-TAAGGTGCATCTAGTGCAGATAG-3’ |
| Reverse: Universal primers (miScript SYBR Green PCR kit) | |
| U6 | Forward: 5’-CTCGCTTCGGCAGCACA-3’ |
| Reverse: 5’-ACGCTTCACGAATTTGCGT-3’ | |
| miR-18a-5p mimic | Forward: 5’-UAAGGUGCAUCUAGUGCAGAUAG-3’ |
| Reverse: 5’-AUCUGCACUAGAUGCACCUUAUU-3’ | |
| miR-18a-5p inhibitor | 5’-CUAUCUGACUAGAUGCACCUUA-3’ |
| NC | Forward: 5’-UUCUCCGAACGUGUCACGUTT-3’ |
| Reverse: 5’-ACGUGACACGUUCGGAGAATT-3’ | |
| NC inhibitor | 5’-CAGUACUUUUGUGUAGUACAA-3’ |
miR, microRNA; NC, negative control; PCR, polymerase chain reaction.
RNA extraction, cDNA synthesis and RT-qPCR
According to the instructions, Trizol was used to extract total RNA from the samples and RNA concentrations were determined (NanoDrop 2000c, Thermo Scientific, USA). Total RNA was purified using the RNeasy Maxi kit (Qiagen GmbH). According to the manufacturer’s protocol, 1 μg of total RNA and the miRNA Reverse Transcription Kit (Qiagen, Germany) was added to the reaction system for reverse transcription on a general PCR machine (BIO-RAD, USA). After that, reverse transcription quantitative real-time polymerase chain reaction (RT-qPCR) was performed to detect the expression level of miR-18a-5p with miScript SYBR®Green PCR kit (Qiagen GmbH) on the Roche Lightcycler 480 Real-Time PCR system (Roche Diagnostics, Basel, Switzerland). The condition for RT-qPCR was set as followed: 95°C for 2 minutes, 40 cycles, 95°C for 10 seconds, 55°C for 30 seconds, 72°C for 30 seconds. U6 snRNA was used as an internal reference gene. miR-18a-5p expression levels were analyzed using the 2-ΔΔCq method [13].
Cell counting kit-8 (CCK-8) assay
CCK-8 assay was designed to evaluate the proliferation of 786-O cells and ACHN cells. Each 96-well plate was divided into four groups according to the experimental requirements and added with 5000 transfected cells/per well. At 0, 24, 48 and 72 hours post-transfection, 10 μl of Cell Counting Kit-8 (US Everbright lnc) was added to the wells and the cells were incubated in the dark at 37°C for 30 minutes in a humidified incubator containing 5% CO2. Subsequently, the OD of each well in different cell groups at an absorbance of 490 nm was determined by using an ELISA microplate reader (Bio-Rad Laboratories, Inc., Hercules, CA, USA).
Wound scratch assay
Wound scratch assay was designed to evaluate the mobility of 786-O and ACHN cells. Approximately 6 × 10⁵ the cells seeded in each well of a 6-well plate and cultured for a further 24 hours. After transfected for 6 h, the cells were scratch perpendicularly with a sterile 200 μl pipette tip so as to draw a straight wound. Afterwards, PBS was used to wash off the removed cells and the left cells was cultured for another 24 hours. The size of the scratch was photographed and recorded with a digital camera system (Olympus Corporation, Tokyo, Japan) at 0 h and 24 h.
Transwell assay
Transwell assay was designed to evaluate the cell migration and invasion ability of 786-O and ACHN cells. Transwell chamber inserts (BD Biosciences, Franklin Lakes, NJ, USA) containing (for invasion) or without Matrigel (BD Biosciences) were used in the transwel assay according to the manufacturer’s protocol. A number of 3 × 10⁴ transfected cells were diluted in 200 ul serum-free DMEM. Different groups of cells were inoculated in the upper chamber and the lower chamber was added DMEM containing 10% FBS medium. Subsequently, 786-O cell culture (36 hours of migration, 48 hours of invasion) and ACHN cell culture (36 hours of migration, 60 hours of invasion) were performed. Cells were observed under a microscope after staining with crystal violet and the number of cells in five different field of view was counted.
Flow cytometry assay
Flow cytometry was designed to evaluate the apoptosis rate of 786-O cells and ACHN cells. A number of 3 × 10⁵ cells were seeded into each well of a 6-well plate. Each experimental group of cells was transfected with 200 pmol of miR-18a-5p mimic, inhibitor, negative control (NC), inhibitor negative control (NC inhibitor). After the cells were transfected for 48 hours, the collected cells were washeds with PBS two time and were blended with 100 μl 1X Binding Buffer. 5 µl of Annexin V-fluorescein isothiocyanate (Invitrogen; Thermo Fisher Scientific, Inc.) and 5 µl of propidium iodide (Invitrogen; Thermo Fisher Scientific, Inc.) were respectively added to the cell resuspending. After staining for 15 minutes at room temperature, 400 μl 1X binding buffer was added to each tubes. The apoptosis rate was analyzed using flow cytometry (EPICS XL 4; Beckman Coulter, Inc., Brea, CA, USA).
Survival analyses with TCGA data
To predict and clarify the prognostic functions of miR-18a-5p in RCC, we collected the survival data from The Cancer Genome Atlas (TCGA https://cancergenome.nih.gov/). miR-18a-5p was subjected to the OncoLnc (http://www.oncolnc.org/) for survival analyses [14]. A number of 506 RCC patients of TCGA were enrolled into our study. The patents were divided into two parts (50%, high expression; 50%, low expression). After that, a Kaplan-Meier analysis was performed.
Statistical analysis
All data are expressed as mean ± standard error. Data is processed using SPSS 19.0 (SPSS, Armonk, NY, USA) software. Paired t-tests were used to compare the significance of miR-18a-5p expression in renal cell carcinoma and paracancerous tissues. Student’s t-test was used to analyze the cell phenotypes. The correlation between miR-18a-5p expression and clinicopathological parameters was analyzed by Student’s t-test, Fisher’s exact test or Pearson chi-square test. Cox proportional hazards regression analysis was used to determine univariate and multivariate levels of miR-18a-5p expression and clinical pathological variables or survival. Survival curves were drawn by using Kaplan-Meier curves and the differences between these curves were assessed by log-rank test. P < 0.05 was considered statistically significant.
Results
miR-18a-5p was upregulated in RCC tissues and cell lines
To further verify the expression level of miR-18a-5p in RCC, we collected 42 cases of RCC tissues and corresponding normal tissues from Peking University Shenzhen Hospital. The results showed that the expression of miR-18a-5p in RCC tissues was significantly up-regulated compared with the normal tissues (P < 0.001, Figure 1B). Similarly, the results of RCC cell lines showed that miR-18a-5p expression levels were significantly up-regulated in 786-O (P < 0.01), ACHN (P < 0.001) and Caki-1 (P < 0.05) cells compared to that in HEK-293T cell (Figure 1C). The significant up-regulation of miR-18a-5p expression in RCC tissues and cell lines suggested that miR-18a-5p may acted as an oncogene in RCC.
Figure 1.
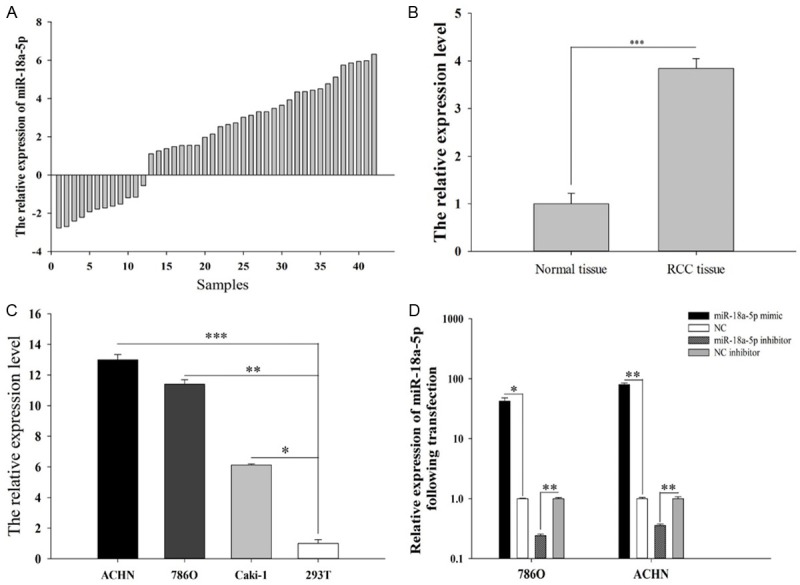
The relative expression of miR-18a-5p in 42 paired tissues [log2(T/N)] (A). The mean expression of miR-18a-5p in RCC tissues and adjacent normal tissues (B). The relative expression levels of miR-18a-5p in 786-O, ACHN, Caki-1 and 293T cell (C). The relative expression levels of miR-18a-5p after transfection with miR-18a-5p mimic, inhibitor, NC and NC inhibitor in 786-O and ACHN cell lines (D). *P < 0.05, **P < 0.01, ***P < 0.001; NC, negative control.
Validation of cell transfection efficiency
We compared the transfection efficiency of the miR-18a-5p mimic or inhibitor with respective NC in the 786-O and ACHN cell lines by performing RT-qPCR. The results (Figure 1D) showed that miR-18a-5p expression in the cell with miR-18a-5p mimic or inhibitor transfection was 42.22 (786-O cells, P < 0.05), 79.71 (ACHN cells, P < 0.01) OR 0.24 (786-O cells, P < 0.01), 0.35 (ACHN cells, P < 0.01) times than that in corresponding NC transfection cell.
miR-18a-5p promoted cell proliferation
CCK-8 assay was designed to evaluate the proliferation of 786-O cells and ACHN cells. The results of ACHN cells showed that the proliferation of miR-18a-5p mimic group (Figure 2A) speeded up by 34.41% (P < 0.001), 45.00% (P < 0.001), 41.56% (P < 0.001) compared with NC at 24, 48 and 72 hours, while the proliferation of miR-18a-5p inhibitor group (Figure 2B) slowed down by 16.55% (P < 0.01), 23.55% (P < 0.001) and 24.95% (P < 0.01) compared with inhibitor NC at 24, 48 and 72 hours. The same results were obtained in786-O cells, which revealed that the proliferation of miR-18a-5p mimic group (Figure 2C) speeded up by 20.65% (P < 0.01), 19.75% (P < 0.001), 24.46% (P < 0.001) compared with NC at 24, 48 and 72 hours, while the proliferation of miR-18a-5p inhibitor group (Figure 2D) slowed down by 10.16% (P < 0.01), 16.09% (P < 0.001), 19.67% (P < 0.01) compared with inhibitor NC at 24, 48 and 72 hours. This experiment showed that the upregulation of miR-18a-5p promoted cell proliferation, while the down-regulation of miR-18a-5p inhibited cell proliferation.
Figure 2.
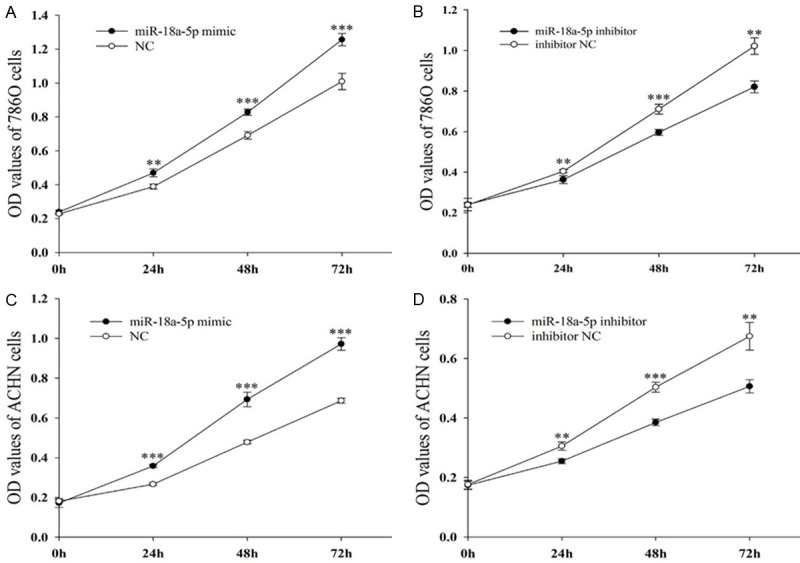
Result of CCK-8 assay. 786-O cells after transfection with miR-18a-5p mimic or NC (A) and miR-18a-5p inhibitor or NC inhibitor (B). ACHN cells after transfection with miR-18a-5p or NC (C) and miR-18a-5p inhibitor or NC inhibitor (D). *P < 0.05, **P < 0.01, ***P < 0.001. NC, negative control; OD, optical density; CCK-8, Cell Counting Kit 8.
miR-18a-5p promoted cell mobility
Wound scratch assay and transwell assay were designed to evaluate the mobility of 786-O cells and ACHN cells. The results of wound scratch assay were shown in Figure 3A. As we can see, the migration ability of miR-18a-5p mimic transfected cells increased by 36.83% (Figure 3B, 786-O, P < 0.05), 44.37% (Figure 3C, ACHN, P < 0.01) compared with NC, while the migration ability of miR-18a-5p inhibitor transfected cells slowed down by 23.74% (Figure 3B, 786-O, P < 0.01), 34.49% (Figure 3C, ACHN, P < 0.01) compared with inhibitor NC. We came to the same conclusion in transwell assay (Figure 4B and 4D), suggesting that up-regulation of miR-18a-5p promotes RCC cell migration. The results of transwell assay were shown in Figure 4A. As we can see, the invision ability of miR-18a-5p mimic transfected cells increased by 60.76% (Figure 4C, 786-O, P < 0.01), 70.55% (Figure 4E, ACHN, P < 0.01) compared with NC, while the invasion ability of miR-18a-5p inhibitor transfected cells slowed down by 38.55% (Figure 4C, 786-O, P < 0.01), 43.07% (Figure 4E, ACHN, P < 0.01) compared with inhibitor NC, which demonstrated that up-regulation of miR-18a-5p promotes RCC cell invasion.
Figure 3.
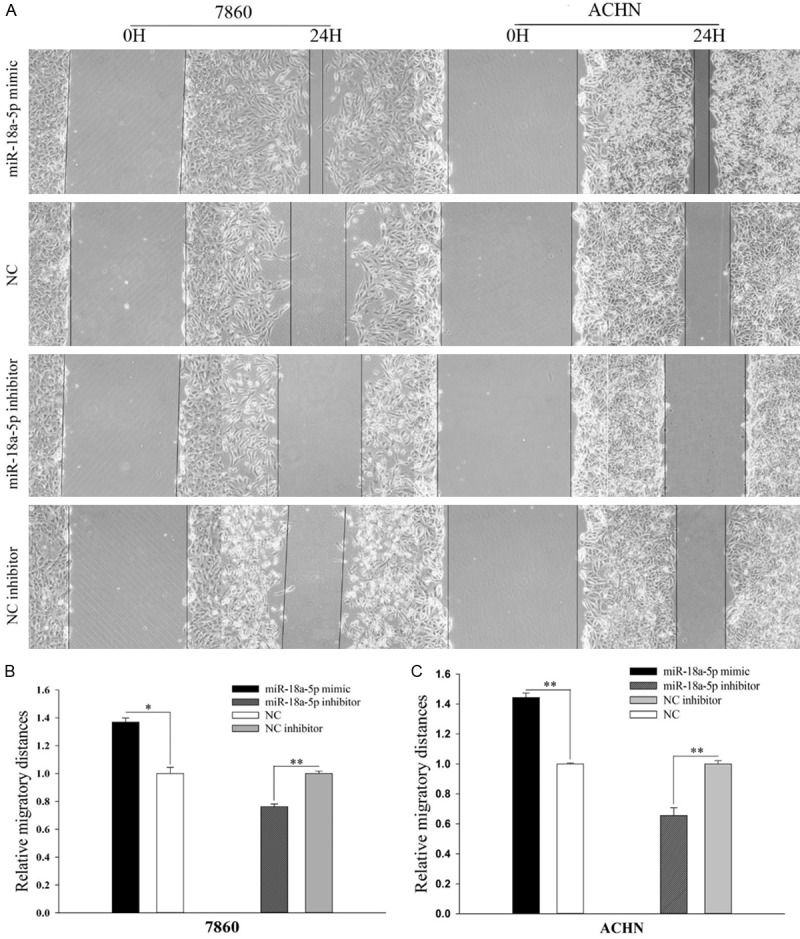
Result of wound healing assay. The wound healing images in 786-O and ACHN cell (A). The relative migratory distances of 786-O (B) and ACHN (C) cells. *P < 0.05, **P < 0.01, ***P < 0.001. NC, negative control.
Figure 4.
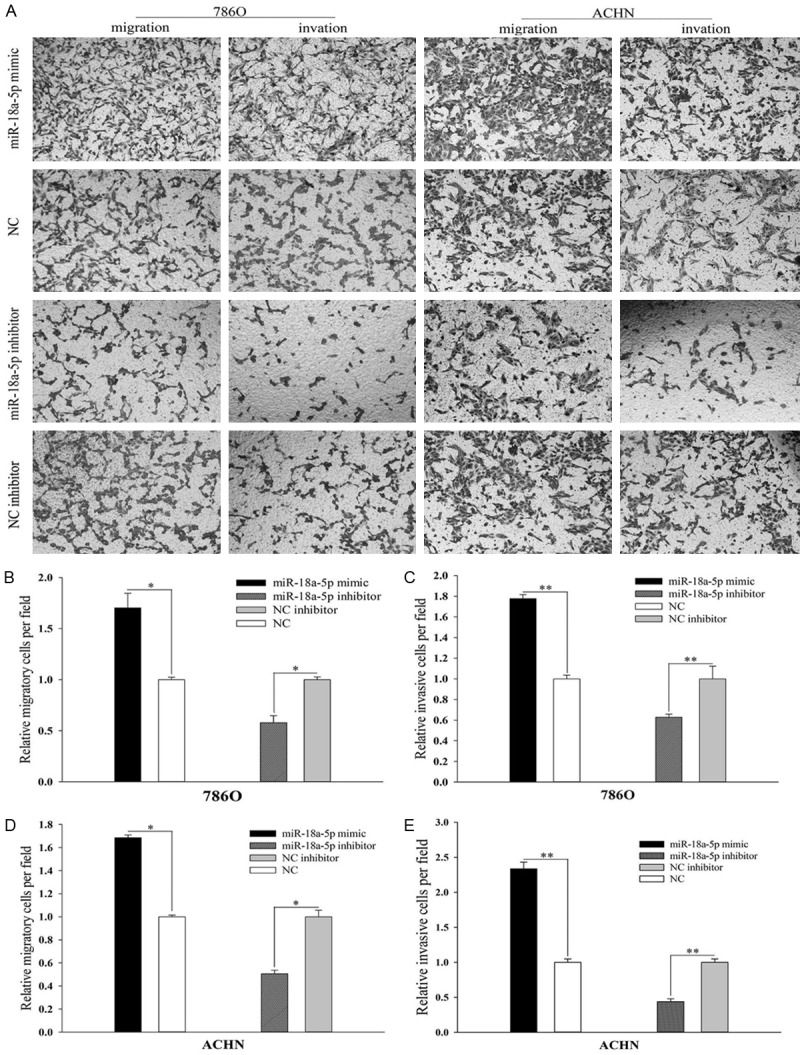
Result of transwell assay. The migratory and invasive images in 786-O and ACHN cell (A). The relative number of the migratory (B) and invasive (C) 786-O cell. The relative number of the migratory (D) and invasive (E) ACHN cell. *P < 0.05, **P < 0.01, ***P < 0.001. NC, negative control.
miR-18a-5p inhibited cell apoptosis
Flow cytometry assay was designed to evaluate the apoptosis of 786-O cells and ACHN cells. The results of 786-O and ACHN cells are shown in Figure 6. The apoptosis rate of miR-18a-5p mimic transfected cells declined by 8.21% (Figure 5B, 786-O, P < 0.05) and 7.36% (Figure 5C, ACHN, P < 0.05) compared with NC. On the contrary, The apoptosis rate of miR-18a-5p inhibitor transfected cells rose by 6.37% (Figure 5B, 786-O, P<0.05) and 6.34% (Figure 5C, ACHN, P < 0.05) compared with inhibitor NC. Experiments showed that upregulation of miR-18a-5p inhibits RCC cell apoptosis.
Figure 6.
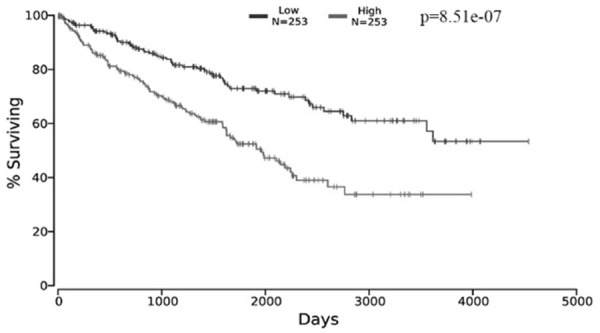
The relationship between the expression of miR-18a-5p and survival. The data was extracted from OncoLnc.
Figure 5.
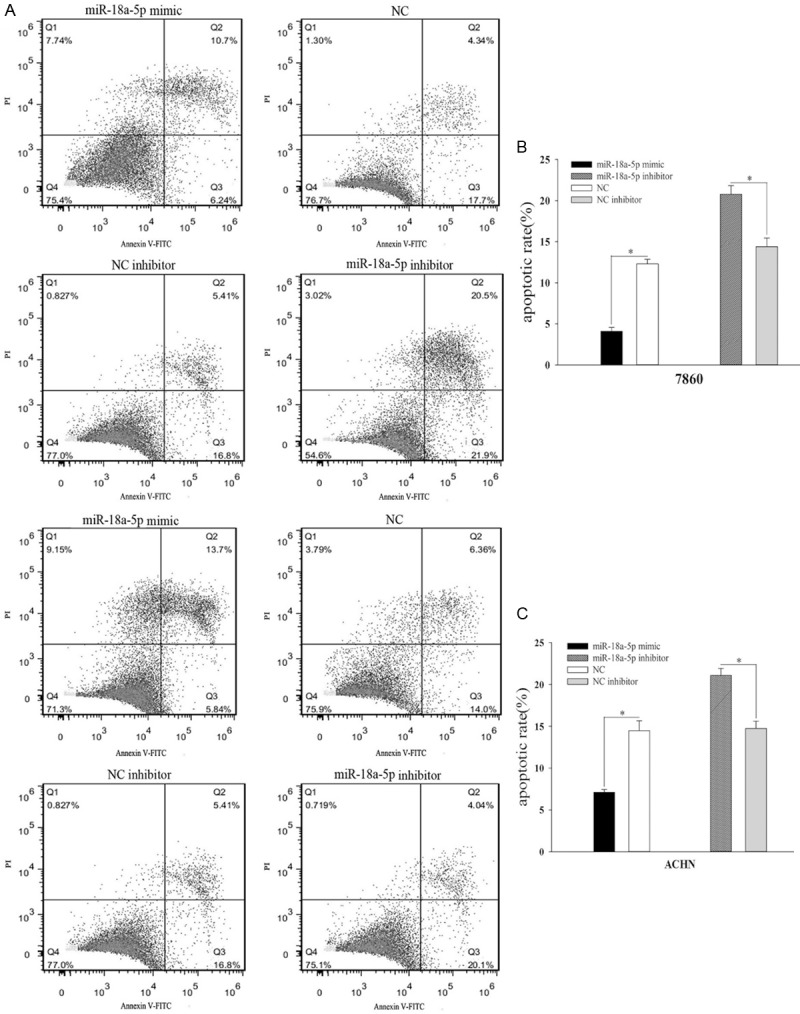
Result of flow cytometry assay. The distribution of 786-O and ACHN cells (A). The relative apoptotic rate of 786-O cell after transfection with miR-18a-5p mimic, inhibitor, NC, or NC inhibitor (B). The relative apoptotic rate of ACHN cell after transfection with miR-18a-5p mimic, inhibitor, NC, or NC inhibitor (C). *P < 0.05, **P < 0.01, ***P < 0.001. NC, negative control.
miR-18a-5p served as a potential independent prognostic marker for RCC
Data of TCGA showed that the RCC patients with high-expression of miR-18a-5p had less survival time with a mean of 1199 days while the RCC patients with low-expression of miR-18a-5p survived longer with a mean of 1502 days (Table 3). Kaplan-Meier survival curves showed that patients with the high-expression of miR-18a-5p had significantly poorer survival (Figure 6, Logrank p-value =8.51e-07), suggesting that mR-18a-5p was likely to be a potential prognostic marker for RCC. The results of FFPE RCC samples are shown in Table 4, no significant correlation was found between the expression of miR-18a-5p with other clinicopathologic variables, including sex, age, tumor size and tumor stage. The survival curves of Cox proportional hazards regression analysis are presented in Table 5. As shown in Figure 7A, the overall survival of high miR-18a-5p expression patients was significantly lower than that of low miR-18a-5p expression patients in univariate analysis (HR=0.195, 95% CI=0.041-0.921, P=0.039, Table 5). As shown in Figure 7B, after controlling for sex, age, tumor size, and tumor stage, we found that patients with low miR-18a-5p expression still had significantly better survival than patients with high miR-18a-5p expression in multivariate analysis that (HR=0.175, 95% CI=0.032-0.953, P=0.044, Table 5). Kaplan-Meier survival curves revealed that high miR-18a-5p expression patients had significantly poor survival than the patient with low miR-18a-5p expression (Figure 7C, P=0.021). These results demonstrated that miR-18a-5p may served as a potential independent prognostic marker for RCC.
Table 3.
The mean expression of miR-18a-5p and mean survival day of the RCC patients
| Group | Mean expression | Mean survival day |
|---|---|---|
| Low expression (n=253) | 3.34 | 1502 |
| High expression (n=253) | 10.57 | 1199 |
The data was extracted from OncoLnc.
Table 5.
miR-18a-5p expression and patients’ survival
| Variable | Univariate analysis | Multivariate analysis | ||
|---|---|---|---|---|
|
| ||||
| HR (95% CI) | P-value | HR (95% CI) | P-value | |
| Gender (Female vs Male) | 0.713 (0.184-2.762) | 0.624 | 1.091 (0.253-4.698) | 0.907 |
| Age (≤ 60 y vs > 60 y) | 3.409 (0.956-12.158) | 0.059 | 0.614 (0.153-2.467) | 0.492 |
| Tumor size (≤ 4.0 cm vs > 4.0) | 0.629 (0.181-2.188) | 0.466 | 3.536 (0.856-14.605) | 0.081 |
| Tumor stage (I+II vs III+IV) | 9.167 (1.940-43.313) | 0.055 | 0.097 (0.017-0.551) | 0.068 |
| miR-18a-5p (low vs high) | 0.195 (0.041-0.921) | 0.039 | 0.175 (0.032-0.953) | 0.044 |
HR, Hazard ratio; 95% CI, 95% Confidence interval.
Figure 7.
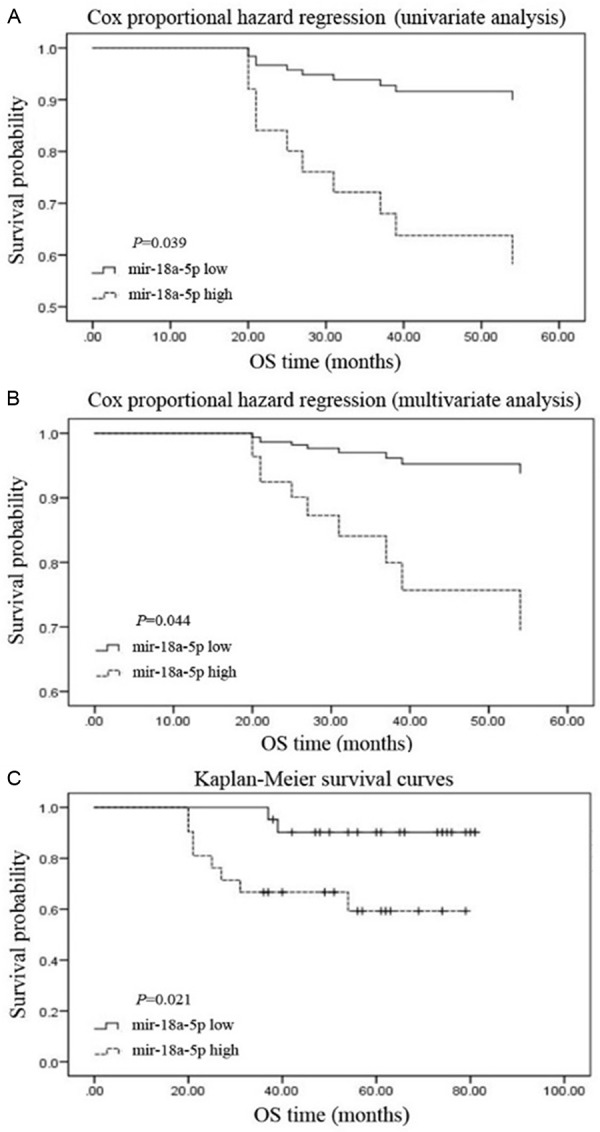
Result of prognostic analysis by FFPE RCC samples. The relationship between the expression of miR-18a-5p and survival in the univariate (A) and multivariate (B) analysis. The relationship between the expression of miR-18a-5p and survival in the Kaplan-Meier survival curves (C). *P<0.05, **P<0.01, ***P<0.001. NC, negative control.
Discussion
RCC is one of the most common urological tumors with increasing morbidity and mortality year by year [15]. The treatment of advanced RCC is limited, and its curative effect is not good [16]. The main reasons are that not very sensitive to the adjuvant therapy such as radiotherapy, chemotherapy, immune and endocrine therapy, and targeted therapy is effective for individual patients [17,18]. At present, the majority of RCC patients are advanced patients, most of which relapse and are presented with metastasis after operation [19]. Therefore, it is of great importance to study the mechanism of RCC carcinogenesis and development so as to seek reliable and effective molecular targets and biomarkers for the early diagnosis, clinical treatment and prognosis of RCC.
miRNAs are endogenous non-coding RNAs with the average length of about 22 nucleotides that regulate gene expression at post-transcriptional level and are widely found in nematodes, fruit flies, plants and mammals [20-22]. miRNAs, highly evolutionarily conserved, are completely or incompletely paired with the 3’UTR of the target gene mRNA so as to inhibit their translation and consequently regulate cell proliferation and differentiation, individual development and the body’s physiological functions [23-25]. miRNAs play an essential role in genesis and development of cancers.
In recent years, more and more microRNAs had been found to be abnormally expressed in RCC tissues and cells. They function as oncogenes or tumor suppressor genes and regulate the proliferative activity, apoptosis and distant metastasis [26]. Juan et al [27] found that 9 miRNAs were up-regulated and 26 miRNAs were down-regulated in 28 RCC cases tissues by using RT-qPCR. Results of Yi et al [28] revealed that 38 miRNAs were upregulated and 48 miRNAs were downregulated in 30 cases of RCC. Another study revealed that miR-141/200c was most significantly down-regulated in RCC [29]. Similar results were observed in Jung et al [30] study, which suggested that miR-155 was up-regulated and miR-141 was down-regulated in RCC, and combination of them can accurately diagnose RCC. These studies suggest that miRNAs may have an important connection with the occurrence and development of RCC.
A large number of recent studies had shown that abnormally expressed miRNAs can be used as an early diagnosis and prognostic marker of RCC. For example, Zaman et al [31] found that the expression of miR-21 was significantly up-regulated in 54 RCC cases and the patients with increased expression of miR-21 was associated with poor 5-year survival. Moreover, combination of miR-378 and miR-210 was able to diagnose RCC with 80% sensitivity and 78% specificity and over-expression of miR-378 showed positive correlation with disease-free survival and clinical stage, demonstrated that miR-378 and miR-210 may function as powerful diagnostic and prognostic markers for RCC [32].
Previous studies have reported that miR-18a-5p played crucial roles in other types of cancers. In hepatocellular carcinoma (HCC), elevated expression of miR-18a had a positive effect on the cell proliferation and migration, while reduced expression of miR-18a reversed the effect [11]. Another study about miR-18a-5p in HCC showed that miR-18a promoted the development of HCC by preventing Estrogen Receptor-α [10]. What’s more, serum miR-18a expression levels in patients with HBV-related HCC was significantly higher than that in the control group, suggesting that serum miR-18a may functioned as a noninvasive marker for HBV-related HCC screening [33]. In colorectal cancers, miR-18a was found to weaken cellular repair of DNA double-strand breaks through directly inhibiting ATM, demonstrating that miR-18a functioned as a crucial enzyme in DNA damage repair [7]. Results of Luo et al [12] miR-18a acted as an oncogene in nasopharyngeal carcinoma (NPC) and promoted the growth, migration and invasion of NPC cell by targeting Dicer, suggesting that miR-18a may be a promising target for NPC therapy. In addition, plasma miR-18a was recommended as a promising biomarker for the diagnosis of esophageal squamous cell carcinoma and pancreatic cancer [8,9]. Tao et al [34] had reported that miR-18a inhibited Dicer expression and cell growth in bladder cancer.
At present, there is no report on the effect of miR-18a-5p on RCC. Scilicet, our study is the first study to explore the expression and the functions of miR-18a-5p in RCC. In this study, RT-qPCR was used to detect the expression of miR-18a-5p in RCC tissues and cell lines. At the same time, CCK-8 assay, transwell assay, wound healing assay and flow cytometry assay were also used to observe the effect of miR-18a-5p on the functions in RCC cells. The results of the study indicated that miR-18a-5p expression was increased in RCC tissues and ACHN, 786-O and Caki-1 cell as compared to paired kidney normal tissues and HEK-293T cell. Upregulation of miR-18a-5p had a positive effect on RCC cell proliferation, migration, invasion and inhibition of apoptosis, while down-regulation of miR-18a-5p neutralized the effect. In addition, Data of TCGA and prognostic analysis of FFPE RCC samples revealed that high miR-18a-5p expression patients had significantly poorer survival, suggesting that miR-18a-5p functioned as a potential prognostic marker for RCC. The limitation of our study is that the potential mechanism of miR-18a-5p in RCC needs to be further elucidated.
Conclusion
In summary, results of present study revealed that the expression of miR-18a-5p in RCC tissues and cell lines was elevated. Further researches suggested that upregulation of miR-18a-5p had a positive effect on RCC cell proliferation, migration, invasion and inhibition of apoptosis, while down-regulation of miR-18a-5p neutralized the effect. In addition, Data of TCGA and prognostic analysis of FFPE RCC samples revealed that high miR-18a-5p expression patients had significantly poorer survival. These results demonstrated that miR-18a-5p functioned as an oncogene and prognostic biomarker in RCC.
Acknowledgements
This study was supported by Science and Technology Development Fund Project of Shenzhen (no. JCYJ20170307111334308), Clinical Research Project of Shenzhen Health Commission (no. SZLY2018023) and the Fund of ‘San-ming’ Project of Medicine in Shenzhen (no. SZSM201612066).
Disclosure of conflict of interest
None.
References
- 1.Rini BI, Campbell SC, Escudier B. Renal cell carcinoma. Lancet. 2009;373:1119–1132. doi: 10.1016/S0140-6736(09)60229-4. [DOI] [PubMed] [Google Scholar]
- 2.Cohen HT, McGovern FJ. Renal-cell carcinoma. N Engl J Med. 2005;353:2477–2490. doi: 10.1056/NEJMra043172. [DOI] [PubMed] [Google Scholar]
- 3.Gupta K, Miller JD, Li JZ, Russell MW, Charbonneau C. Epidemiologic and socioeconomic burden of metastatic renal cell carcinoma (mRCC): a literature review. Cancer Treat Rev. 2008;34:193–205. doi: 10.1016/j.ctrv.2007.12.001. [DOI] [PubMed] [Google Scholar]
- 4.Nerich V, Hugues M, Paillard MJ, Borowski L, Nai T, Stein U, Nguyen Tan Hon T, Montcuquet P, Maurina T, Mouillet G, Kleinclauss F, Pivot X, Limat S, Thiery-Vuillemin A. Clinical impact of targeted therapies in patients with metastatic clear-cell renal cell carcinoma. Onco Targets Ther. 2014;7:365–374. doi: 10.2147/OTT.S56370. [DOI] [PMC free article] [PubMed] [Google Scholar]
- 5.Croce CM, Calin GA. miRNAs, cancer, and stem cell division. Cell. 2005;122:6–7. doi: 10.1016/j.cell.2005.06.036. [DOI] [PubMed] [Google Scholar]
- 6.Chen CZ, Li L, Lodish HF, Bartel DP. MicroRNAs modulate hematopoietic lineage differentiation. Science. 2004;303:83–86. doi: 10.1126/science.1091903. [DOI] [PubMed] [Google Scholar]
- 7.Wu CW, Dong YJ, Liang QY, He XQ, Ng SS, Chan FK, Sung JJ, Yu J. MicroRNA-18a attenuates DNA damage repair through suppressing the expression of ataxia telangiectasia mutated in colorectal cancer. PLoS One. 2013;8:e57036. doi: 10.1371/journal.pone.0057036. [DOI] [PMC free article] [PubMed] [Google Scholar]
- 8.Hirajima S, Komatsu S, Ichikawa D, Takeshita H, Konishi H, Shiozaki A, Morimura R, Tsujiura M, Nagata H, Kawaguchi T, Arita T, Kubota T, Fujiwara H, Okamoto K, Otsuji E. Clinical impact of circulating miR-18a in plasma of patients with oesophageal squamous cell carcinoma. Br J Cancer. 2013;108:1822–1829. doi: 10.1038/bjc.2013.148. [DOI] [PMC free article] [PubMed] [Google Scholar]
- 9.Morimura R, Komatsu S, Ichikawa D, Takeshita H, Tsujiura M, Nagata H, Konishi H, Shiozaki A, Ikoma H, Okamoto K, Ochiai T, Taniguchi H, Otsuji E. Novel diagnostic value of circulating miR-18a in plasma of patients with pancreatic cancer. Br J Cancer. 2011;105:1733–1740. doi: 10.1038/bjc.2011.453. [DOI] [PMC free article] [PubMed] [Google Scholar]
- 10.Liu WH, Yeh SH, Lu CC, Yu SL, Chen HY, Lin CY, Chen DS, Chen PJ. MicroRNA-18a prevents estrogen receptor-alpha expression, promoting proliferation of hepatocellular carcinoma cells. Gastroenterology. 2009;136:683–693. doi: 10.1053/j.gastro.2008.10.029. [DOI] [PubMed] [Google Scholar]
- 11.Liu L, Cai X, Liu E, Tian X, Tian C. MicroRNA-18a promotes proliferation and metastasis in hepatocellular carcinoma via targeting KLF4. Oncotarget. 2017;8:68263–68269. doi: 10.18632/oncotarget.19293. [DOI] [PMC free article] [PubMed] [Google Scholar]
- 12.Luo Z, Dai Y, Zhang L, Jiang C, Li Z, Yang J, McCarthy JB, She X, Zhang W, Ma J, Xiong W, Wu M, Lu J, Li X, Li X, Xiang J, Li G. miR-18a promotes malignant progression by impairing microRNA biogenesis in nasopharyngeal carcinoma. Carcinogenesis. 2013;34:415–425. doi: 10.1093/carcin/bgs329. [DOI] [PubMed] [Google Scholar]
- 13.Livak KJ, Schmittgen TD. Analysis of relative gene expression data using real-time quantitative PCR and the 2(-Delta Delta C(T)) Method. Methods. 2001;25:402–408. doi: 10.1006/meth.2001.1262. [DOI] [PubMed] [Google Scholar]
- 14.Anaya J. OncoLnc: linking TCGA survival data to mRNAs, miRNAs, and lncRNAs. Peer J. 2016:11. [Google Scholar]
- 15.Ye D, Eto M, Chung JS, Kimura G, Chang WC, Chang YH, Pang ST, Lee JL, Niu Y, Gurney H, Uemura H. Use of targeted therapies for advanced renal cell carcinoma in the Asia-Pacific region: opinion statement from China, Japan, Taiwan, Korea, and Australia. Clin Genitourin Cancer. 2014;12:225–233. doi: 10.1016/j.clgc.2014.01.007. [DOI] [PubMed] [Google Scholar]
- 16.Carlo MI, Voss MH, Motzer RJ. Checkpoint inhibitors and other novel immunotherapies for advanced renal cell carcinoma. Nat Rev Urol. 2016;13:420–431. doi: 10.1038/nrurol.2016.103. [DOI] [PMC free article] [PubMed] [Google Scholar]
- 17.Pengcheng S, Ziqi W, Luyao Y, Xiangwei Z, Liang L, Yuwei L, Lechen L, Wanhai X. MicroRNA-497 suppresses renal cell carcinoma by targeting VEGFR-2 in ACHN cells. Biosci Rep. 2017:37. doi: 10.1042/BSR20170270. [DOI] [PMC free article] [PubMed] [Google Scholar]
- 18.Wei C, Wang S, Ye Z, Chen Z. Efficacy of targeted therapy for advanced renal cell carcinoma: a systematic review and meta-analysis of randomized controlled trials. Int Braz J Urol. 2018;44:219–237. doi: 10.1590/S1677-5538.IBJU.2017.0315. [DOI] [PMC free article] [PubMed] [Google Scholar]
- 19.Zhao W, Zhou J, Deng Z, Gao Y, Cheng Y. SPOP promotes tumor progression via activation of beta-catenin/TCF4 complex in clear cell renal cell carcinoma. Int J Oncol. 2016;49:1001–1008. doi: 10.3892/ijo.2016.3609. [DOI] [PubMed] [Google Scholar]
- 20.Gozuacik D, Akkoc Y, Ozturk DG, Kocak M. Autophagy-regulating microRNAs and cancer. Front Oncol. 2017;7:65. doi: 10.3389/fonc.2017.00065. [DOI] [PMC free article] [PubMed] [Google Scholar]
- 21.Jee D, Yang JS, Park SM, Farmer DT, Wen J, Chou T, Chow A, McManus MT, Kharas MG, Lai EC. Dual strategies for argonaute2-mediated biogenesis of erythroid miRNAs underlie conserved requirements for slicing in mammals. Mol Cell. 2018;69:265–278. e266. doi: 10.1016/j.molcel.2017.12.027. [DOI] [PMC free article] [PubMed] [Google Scholar]
- 22.Zhang Y, Yun Z, Gong L, Qu H, Duan X, Jiang Y, Zhu H. Comparison of miRNA evolution and function in plants and animals. Microrna. 2018;7:4–10. doi: 10.2174/2211536607666180126163031. [DOI] [PubMed] [Google Scholar]
- 23.Fabbri M, Calin GA. Epigenetics and miRNAs in human cancer. Adv Genet. 2010;70:87–99. doi: 10.1016/B978-0-12-380866-0.60004-6. [DOI] [PubMed] [Google Scholar]
- 24.Lionetti M, Agnelli L, Mosca L, Fabris S, Andronache A, Todoerti K, Ronchetti D, Deliliers GL, Neri A. Integrative high-resolution microarray analysis of human myeloma cell lines reveals deregulated miRNA expression associated with allelic imbalances and gene expression profiles. Genes Chromosomes Cancer. 2009;48:521–531. doi: 10.1002/gcc.20660. [DOI] [PubMed] [Google Scholar]
- 25.Calin GA, Sevignani C, Dumitru CD, Hyslop T, Noch E, Yendamuri S, Shimizu M, Rattan S, Bullrich F, Negrini M, Croce CM. Human microRNA genes are frequently located at fragile sites and genomic regions involved in cancers. Proc Natl Acad Sci U S A. 2004;101:2999–3004. doi: 10.1073/pnas.0307323101. [DOI] [PMC free article] [PubMed] [Google Scholar]
- 26.Croce CM. Causes and consequences of microRNA dysregulation in cancer. Nat Rev Genet. 2009;10:704–714. doi: 10.1038/nrg2634. [DOI] [PMC free article] [PubMed] [Google Scholar]
- 27.Juan D, Alexe G, Antes T, Liu H, Madabhushi A, Delisi C, Ganesan S, Bhanot G, Liou LS. Identification of a microRNA panel for clear-cell kidney cancer. Urology. 2010;75:835–841. doi: 10.1016/j.urology.2009.10.033. [DOI] [PubMed] [Google Scholar]
- 28.Yi Z, Fu Y, Zhao S, Zhang X, Ma C. Differential expression of miRNA patterns in renal cell carcinoma and nontumorous tissues. J Cancer Res Clin Oncol. 2010;136:855–862. doi: 10.1007/s00432-009-0726-x. [DOI] [PubMed] [Google Scholar]
- 29.Nakada C, Matsuura K, Tsukamoto Y, Tanigawa M, Yoshimoto T, Narimatsu T, Nguyen LT, Hijiya N, Uchida T, Sato F, Mimata H, Seto M, Moriyama M. Genome-wide microRNA expression profiling in renal cell carcinoma: significant down-regulation of miR-141 and miR-200c. J Pathol. 2008;216:418–427. doi: 10.1002/path.2437. [DOI] [PubMed] [Google Scholar]
- 30.Jung M, Mollenkopf HJ, Grimm C, Wagner I, Albrecht M, Waller T, Pilarsky C, Johannsen M, Stephan C, Lehrach H, Nietfeld W, Rudel T, Jung K, Kristiansen G. MicroRNA profiling of clear cell renal cell cancer identifies a robust signature to define renal malignancy. J Cell Mol Med. 2009;13:3918–3928. doi: 10.1111/j.1582-4934.2009.00705.x. [DOI] [PMC free article] [PubMed] [Google Scholar]
- 31.Zaman MS, Shahryari V, Deng G, Thamminana S, Saini S, Majid S, Chang I, Hirata H, Ueno K, Yamamura S, Singh K, Tanaka Y, Tabatabai ZL, Dahiya R. Up-regulation of microRNA-21 correlates with lower kidney cancer survival. PLoS One. 2012;7:e31060. doi: 10.1371/journal.pone.0031060. [DOI] [PMC free article] [PubMed] [Google Scholar]
- 32.Fedorko M, Stanik M, Iliev R, Redova-Lojova M, Machackova T, Svoboda M, Pacik D, Dolezel J, Slaby O. Combination of MiR-378 and MiR-210 serum levels enables sensitive detection of renal cell carcinoma. Int J Mol Sci. 2015;16:23382–23389. doi: 10.3390/ijms161023382. [DOI] [PMC free article] [PubMed] [Google Scholar]
- 33.Li L, Guo Z, Wang J, Mao Y, Gao Q. Serum miR-18a: a potential marker for hepatitis B virus-related hepatocellular carcinoma screening. Dig Dis Sci. 2012;57:2910–2916. doi: 10.1007/s10620-012-2317-y. [DOI] [PubMed] [Google Scholar]
- 34.Tao J, Wu D, Li P, Xu B, Lu Q, Zhang W. microRNA-18a, a member of the oncogenic miR-17-92 cluster, targets Dicer and suppresses cell proliferation in bladder cancer T24 cells. Mol Med Rep. 2012;5:167–172. doi: 10.3892/mmr.2011.591. [DOI] [PubMed] [Google Scholar]


