Abstract
Objectives: Accumulating evidence suggests that long non-coding RNA (lncRNA) may affect hepatocellular carcinoma (HCC) progression. However, the mechanism remains unclear. Previous studies have shown that exosomes may promote tumor progression by transporting proteins. Our study aimed to determine the prognostic value of lncRNAs in HCC and the underlying mechanism. Methods: A dataset comprising a HCC cohort of 364 patients from The Cancer Genome Atlas (TCGA) was analyzed to identify lncRNAs with prognostic value. Co-expression and competing endogenous RNA (ceRNA) networks were constructed to investigate the mechanism of exosome-related lncRNAs. To confirm the bioinformatics analysis results, 95 pairs of clinical samples were evaluated by digoxigenin-labeled chromogenic in situ hybridization (CISH). Results: Five lncRNAs (CTD-2116N20.1, AC012074.2, RP11-538D16.2, LINC00501 and RP11-136I14.5) with significant differences were identified (P<0.001). A prognostic nomogram was constructed with a C-index of 0.701. The co-expression and ceRNA networks showed possible mechanisms for CTD-2116N20.1 and RP11-538D16.2. The CISH results confirmed that CTD-2116N20.1 and RP11-538D16.2 were correlated with a poor prognosis for HCC patients. Conclusion: Our findings provide an independent and effective prognostic model to predict the survival rate of HCC patients. RP11-538D16.2 and CTD-2116N20.1 are highlighted as important exosome-related lncRNAs.
Keywords: Hepatocellular carcinoma (HCC), long non-coding RNA (lncRNA), nomogram, exosome, bioinformatics analysis
Introduction
Hepatocellular carcinoma (HCC) is one of the most prevalent cancers and a frequent cause of cancer-related death worldwide [1]. Although many molecular mechanisms of HCC and targeted therapies have been studied in recent years [2-4], no effective systemic chemotherapy exists [5]. Tumor recurrence and metastasis, which usually arise within 2 years after resection, result in a poor prognosis [6]. The underlying molecular mechanisms that mediate recurrence and metastasis remain largely unclear. The construction of an appropriate survival prediction model will help improve the overall prognosis of HCC patients.
Long non-coding RNAs (lncRNAs) are important regulators that affect chromatin reprogramming, cis-regulation at enhancers, and the posttranscriptional regulation of mRNA processing [7,8]. However, the role of lncRNAs in HCC metastasis is unclear. Exosomes, which are tiny membrane-bound vesicles that carry small molecules such as protein and RNA, can be released by cancer cells and normal cells [9-12]. Accumulating evidence suggests that exosomes may play important roles in tumor metastasis and recurrence [13,14]. Additionally, the modulatory function of exosomes is mediated through the horizontal transfer of RNA and protein [15]. Therefore, we hypothesized that lncRNAs affect tumor progression through exosomes.
In this study, datasets in The Cancer Genome Atlas (TCGA) and ExoCarta were analyzed. A survival prediction nomogram was established with a C-index of 0.701. A functional analysis and Kaplan-Meier (KM) curves indicated that CTD-2116N20.1 and RP11-538D16.2 are functionally important lncRNAs. We constructed a competing endogenous RNA (ceRNA) network to demonstrate the potential molecular mechanism. Digoxigenin (DIG)-labeled chromogenic in situ hybridization (CISH) of 95 pairs of clinical samples confirmed that CTD-2116N20.1 and RP11-538D16.2 are correlated with a poor prognosis for HCC patients.
Materials and methods
LncRNA expression profiles and HCC patient clinical information
The lncRNA expression data and corresponding HCC patient clinical information used in this study were obtained from TCGA, a public database. Individuals with repeat IDs or a survival time equal to 0 were excluded. Three hundred sixty-four HCC patients were included in this study. LncRNA expression levels and corresponding clinical data for 50 samples of normal liver tissue were included as the control group. All TCGA lncRNA expression data and clinical information for both HCC patients and normal individuals were downloaded from the Genomic Data Commons Data Portal (https://portal.gdc.cancer.gov/).
Identification of prognostic lncRNAs associated with OS in patients with HCC
Differentially expressed lncRNAs in HCC patients were identified using edge R/R (version 3.34). We excluded lncRNAs with an expression value of 0 in more than 30% of samples. Variation in lncRNA expression levels between HCC tissues and normal liver tissues was evaluated as the FC (fold change). The utilized edgeR package is based on negative binomial distributions, empirical Bayes estimation, exact tests, generalized linear models (GLMs) and quasi-likelihood tests [16,17]. LncRNAs with a logFC ≥1.0 or logFC ≤-1.0 and P<0.05 were selected as statistically significant hits. Univariate Cox proportional regression analysis was used to identify prognostic lncRNAs by evaluating the associations between lncRNA expression levels and overall survival (OS) at P<0.001.
Construction of the lncRNA-based risk score and OS prediction nomogram
Multivariate Cox proportional regression analysis was conducted to establish a risk score model with the identified lncRNAs. The lncRNA-based risk score model was defined as the linear combination of the expression values of the prognostic lncRNAs and the multivariable Cox regression coefficients as the weight. According to the median risk score derived from the TCGA dataset, patients with HCC in this study were classified into a high-risk group and a low-risk group. Univariate regression was used to identify clinical risk factors, and multivariate Cox regression was conducted to develop an OS prediction model. The RMS/R (version 3.34) package was used to establish the OS prediction nomogram.
Functional enrichment analysis
The Pearson correlation coefficient was utilized to evaluate the co-expression relationships between lncRNAs and mRNAs. mRNAs with R square values >0.4 were selected as potential targets of regulation. Gene ontology (GO) and Kyoto Encyclopedia of Genes and Genomes (KEGG) analyses were used to annotate biological functions and molecular processes for lncRNA target genes. DAVID, a bioinformatics tool (http://david.abcc.ncifcrf.gov/, version 6.8) and recognized bioinformatics resource [18], was used to analyze the biological functions of the identified lncRNAs. The GO terms and KEGG pathways with P values corrected for a false discovery rate (FDR) <0.05 were considered significantly enriched functional annotations.
Co-expression network with proteins in exosomes
Data on protein expression levels in exosomes were obtained from ExoCarta (http://exocarta.org/), a public database. We used the Pearson correlation coefficient to evaluate the relationship between prognostic lncRNAs and mRNAs encoding exosomal proteins. A co-expression network was constructed with Cytoscape (version 3.5.1) software, an open source platform that can help visualize complex networks and integrate these networks with any type of attributed data. All data on the expression levels of exosomal proteins were downloaded from ExoCarta (http://exocarta.org/download/).
Construction of ceRNA network
CTD-2116N20.1 and RP11-538D16.2 were distinguished from other identified lncRNAs for their significant differences at the expression level and in the KM curves. To identify the microRNAs (miRNAs) targeted by CTD-2116N20.1 and RP11-538D16.2, we searched the miRcode database (http://www.mircode.org), which contains putative miRNA target sites in the long non-coding transcriptome [19]. MiRNAs targeted by lncRNAs and mRNAs are listed. Cytoscape software (version 3.5.1) was used to construct the ceRNA network.
Digoxigenin-labeled chromogenic in situ hybridization
To validate CTD-2116N20.1 and RP11-538D16.2 expression in HCC, DIG-labeled CISH was performed on 95 pairs of tumor and para-carcinoma tissues. Probes were designed as follows with DIG tags at the 5’ and 3’ ends: CTD-2116N20.1, 5’-ATGGGCAGAATAGAGTTGACAGGA-3’; and RP11-538D16.2, 5’-CAAGGGTCTGCCCGCCTGTCTG-3’. The samples were fixed using 4% paraformaldehyde (DEPC, Servicebio) for 2-12 h. Paraffin sections were prepared to perform the hybridizations. Then, the sections were placed in boiling water for 15 min and cooled at room temperature. The specimens were incubated at 37°C for 30 min in 20 µg/ml Proteinase K (Servicebio) and then rinsed three times in PBS (Servicebio). Prehybridization was conducted at 37°C for 1 h in hybridization buffer (Servicebio). Then, the prehybridization buffer was replaced with fresh hybridization buffer containing 8 ng/ml of the corresponding probe, and the specimens were incubated at 37°C overnight. The washed specimens were incubated at room temperature in blocking serum containing BSA for 30 min and then incubated at 37°C for 40 min with anti-DIG/AP antibody (Jackson). The color was developed using BCIP/NBT (Boster). The specimens were stained with nuclear fast red (Servicebio) to visualize nuclei. The stained specimens were mounted in Neutral Balsam (Sinopharm Chemical Reagent Co., Ltd) and examined by bright field microscopy.
Results
Identification of prognostic lncRNA biomarkers associated with the OS of HCC patients
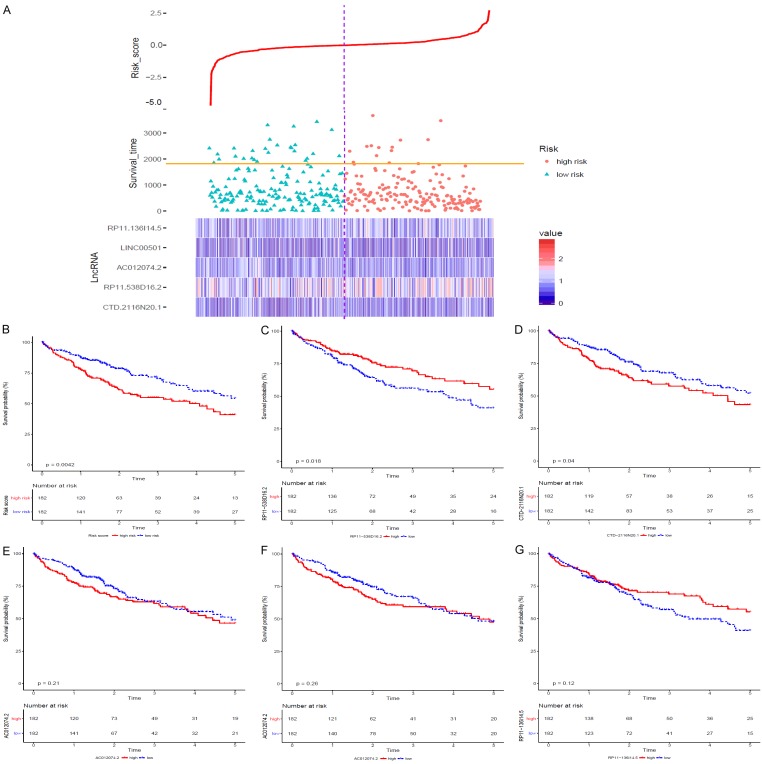
The lncRNA expression data and corresponding clinical information for 373 patients with HCC and 50 normal liver tissue specimens were downloaded from the TCGA. Individuals with repeat IDs or a survival time equal to 0 were eliminated, and 364 patients with HCC were included in our study. Three hundred sixty-two up-regulated lncRNAs and 69 down-regulated lncRNAs were filtered with logFC ≥1.0 or logFC ≤-1.0. Univariate Cox proportional regression analysis was conducted with OS as the dependent variable and P<0.001. Five prognostic lncRNAs, namely, CTD-2116N20.1, AC012074.2, RP11-538D16.2, LINC00501 and RP11-136I14.5, were identified separately. KM analysis was performed for each lncRNA, and the KM curves are shown in Figure 1C-G.
Figure 1.
According to the median risk score, 364 patients with HCC were classified into the high-risk (n=182) and low-risk (n=182) groups. (A) Shows the distribution of overall survival times and risk scores for the HCC patients. The heat map shows the differential expression of the identified lncRNAs between the high-risk and low-risk groups. (B) Shows the KM curve of the risk score, and (C-G) show the individual KM curves of the five identified lncRNAs.
Construction of the lncRNA-based risk score
To develop an OS prediction model, these five lncRNAs were fitted into a multivariate Cox proportional regression with OS as the dependent variable to evaluate the relative contribution of each lncRNA to the prediction of OS. Then, a lncRNA-based risk score was developed by integrating the expression data for these five lncRNAs with corresponding coefficients derived from the above multivariate regression analysis as follows: Risk score =(0.0542×CTD-2116N20.1 expression value) + (0.0223×AC012074.2 expression value) + (-0.0004×RP11-538D16.2 expression value) + (0.0136×LINC00501 expression value) + (-0.035×RP11-136I14.5 expression value). The risk score was calculated for all 364 patients with HCC in this study with the lncRNA-based risk score model. According to the median risk score, all 364 patients with HCC were classified into the high-risk (n=182) or low-risk group (n=182) (Figure 1A). The clinical characteristics of the patients with HCC in the high-risk and low-risk groups are summarized in Table 1. KM analysis was performed to evaluate the difference in OS between the high-risk and low-risk groups (P=0.0042; Figure 1B).
Table 1.
Clinical Characteristics of the TCGA HCC Cohort
| Clinical factors group | Survival risk | Total (n=364) | P value | |
|---|---|---|---|---|
|
| ||||
| Low risk (n=182) | High risk (n=182) | |||
| Sex | ||||
| Female (F) | 67 | 52 | 119 | 0.1185 |
| Male (M) | 116 | 129 | 245 | |
| Age, mean, SD (months) | 60.5 | 58.81 | 0.2388 | |
| History | ||||
| Viral infection (HBV + HCV) | 77 | 74 | 151 | 0.8194 |
| Alcohol consumption | 35 | 41 | 76 | |
| Hemochromatosis | 3 | 2 | 5 | |
| Non-alcoholic fatty liver | 7 | 5 | 12 | |
| Tumor pathologic stage | ||||
| Stage I-II | 131 | 122 | 253 | 0.1066 |
| Stage III-IV | 36 | 51 | 87 | |
| Tumor size | ||||
| T1-T2 | 140 | 130 | 270 | 0.1149 |
| T3-T4 | 38 | 53 | 91 | |
| Tumor metastasis | ||||
| M0 | 123 | 138 | 261 | 0.6095 |
| M1 | 2 | 1 | 3 | |
| Tumor nodes | ||||
| N0 | 116 | 131 | 247 | 1 |
| N1 | 2 | 2 | 4 | |
| Child-Pugh classification | ||||
| A | 112 | 103 | 215 | 0.05078 |
| B | 16 | 5 | 21 | |
| C | 1 | 0 | 1 | |
| Grade | ||||
| G1 | 37 | 18 | 55 | 0.000002679 |
| G2 | 99 | 75 | 174 | |
| G3 | 37 | 81 | 118 | |
| G4 | 4 | 8 | 12 | |
| Race | ||||
| American Indian or Alaskan | 1 | 0 | 1 | 0.01645 |
| Asian | 63 | 91 | 154 | |
| Black or African American | 11 | 6 | 17 | |
| White | 100 | 81 | 174 | |
| AFP at procurement, mean | 4019.664 | 22502.338 | 0.211 | |
| DFS, months, SD | 21.42 | 18.9 | 0.2701 | |
| OS, months, SD | 29.2 | 24.2 | 0.04051 | |
Abbreviation: AFP, alpha-fetoprotein; DFS, disease-free survival; OS, overall survival.
Establishment of OS prediction nomogram
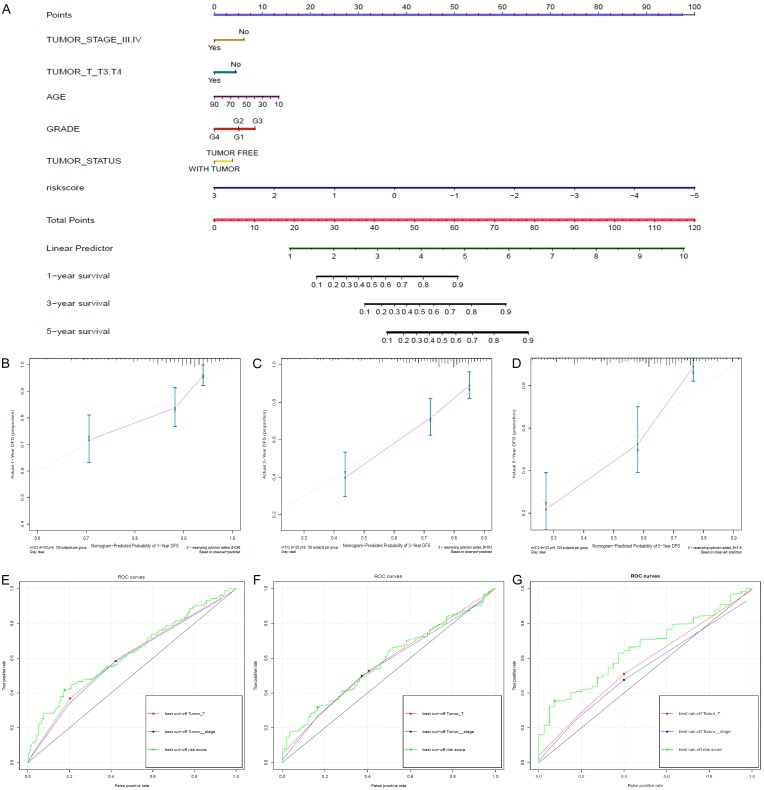
Univariate regression analysis was performed with OS as the dependent variable to identify clinical risk factors. Pathologic stage and pathologic T stage were validated as clinical parameters with P<0.05. Multivariable Cox regression combining pathologic stage, pathologic T stage and lncRNA-based risk score was conducted, and an OS prediction nomogram was established to predict the 1-year, 3-year and 5-year OS of patients with HCC (Figure 2A). To improve the accuracy of our model, the clinical variables of age, grade and tumor status were included based on the results of other studies and clinical experience [20,21]. The predictive ability of the OS nomogram was analyzed, and calibration curves were generated (Figure 2B-D). The C-index of our nomogram was 0.701, which suggested good predictive ability. Additionally, ROC curves of the risk score, pathologic stage and pathologic T stage were constructed (Figure 2E, 2F). The AUCs for the lncRNA-based risk score for the 1-year, 3-year and 5-year OS prediction models were 0.63, 0.58 and 0.65, respectively.
Figure 2.
A. Shows the OS prediction nomogram of the HCC patients. The risk factors include tumor stage ≥III, T stage ≥T3, grade 4 disease, older age, higher risk score and with-tumor status. B-D. Show the individual consistency curves for 1-year, 3-year and 5-year survival. The C-index of our nomogram is 0.701, suggesting good predictive ability. E-G. Show the individual ROC curves of the risk score, pathologic stage and pathologic T stage for the 1-year, 3-year and 5-year survival prediction models. The AUCs of the lncRNA-based risk score for the 1-year, 3-year and 5-year OS prediction models are 0.63, 0.58 and 0.65, respectively.
GO term and KEGG pathway analysis of the five lncRNAs
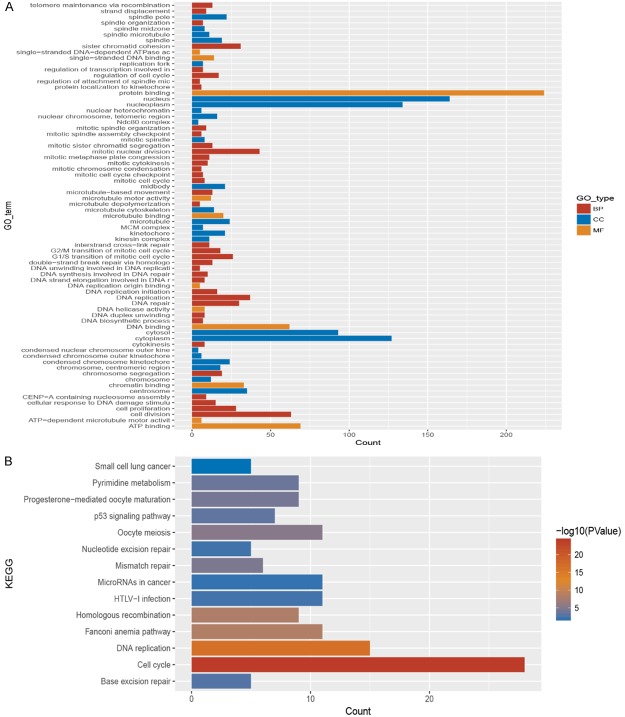
To determine the biological implications of the five selected lncRNAs, KEGG pathway and GO term analyses were performed; the list of enriched target genes from these analyses is presented in Figure 3. The KEGG pathway analysis results showed that these five lncRNAs were associated with cell cycle, DNA replication, miRNAs in cancer and the p53 signaling pathway. The GO term enrichment indicated that the selected five lncRNAs were associated with cell cycle processes such as protein binding, DNA replication, mitosis, cell proliferation and cell division. Prognostic lncRNAs may affect the prognosis of patients with HCC by inducing tumor cell proliferation. To further explore the correlations between the selected lncRNAs and gene expression, a co-expression network was constructed.
Figure 3.
GO term and KEGG pathway analyses were conducted, and the results are provided in this figure. The five selected lncRNAs are associated with cell cycle processes, such as protein binding, DNA replication, mitosis, cell proliferation and cell division.
Co-expression network involving prognostic lncRNAs and exosomal protein expression levels
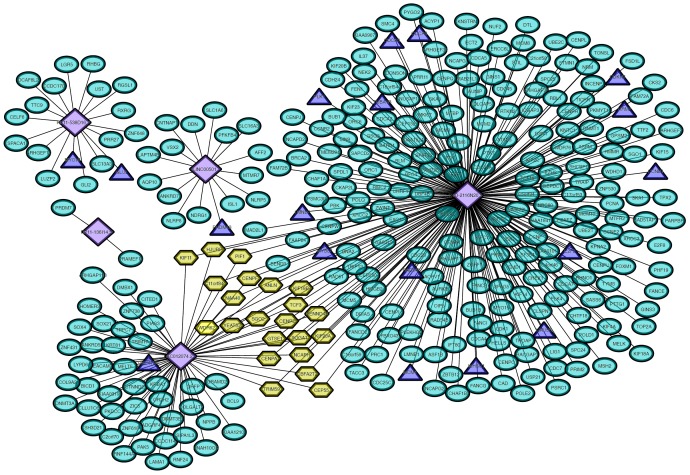
The Pearson correlation coefficient was used to evaluate the relationship between prognostic lncRNAs and mRNAs encoding exosomal proteins. A co-expression network was established (Figure 4). CTD-2116N20.1 qualified as the most important lncRNA and regulated the following proteins: CCNB1, CDCA3, CDCA8, CDKN3, E2F2, HAUS5, LMNB2, MCM4, MYBL2, PLK1, RAD54L, RRM2, TUBA1B and WHSC1. RP11-538D16.2 was associated with the protein expression levels of GLUL and MYO16. LINC00501 may regulate the exosome-related protein PRDM13, and AC012074.2 was related to the protein UNC199B.
Figure 4.
A co-expression network of the prognostic lncRNAs and the expression levels of proteins in exosomes was established. Purple rhombuses represent the identified lncRNAs. Green ovals represent the proteins targeted by the GO term and KEGG pathway analyses. Exosomal proteins confirmed by both functional enrichment analysis and ExoCarta are indicated in blue triangles.
ceRNA network linking exosome-related lncRNAs, miRNAs and exosomal proteins
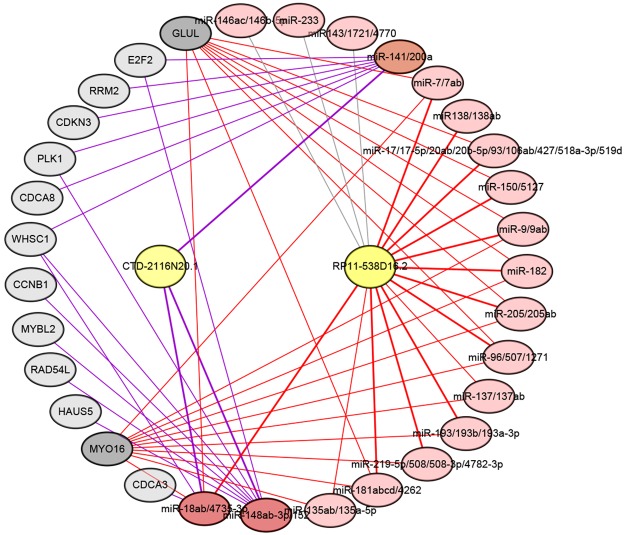
Based on significant differences at the expression level and in the KM analysis, CTD-2116N20.1 and RP11-538D16.2 were selected as critical exosome-related lncRNAs. To explore the mechanism by which exosome-related lncRNAs regulate proteins in exosomes, a ceRNA network was constructed using miRcode (Figure 5). MiRNAs targeted by lncRNAs and mRNAs are listed in Tables S1 and S2. The ceRNA network results suggest that CTD-2116N20.1 may regulate 14 proteins in exosomes by destabilizing miR-141/200a, miR-148ab-3p/152 and miR-18ab/4735-3p. In addition, RP11-538D16.2 can modulate GLUL and MYO16 by destabilizing miR-7/7ab, miR-9/9ab, miR-96/507/1271, miR-18ab/4735-3p, miR-135ab/135a-5p, miR-137/137ab, miR-181abcd/4262, miR-205/205ab, miR-182, miR-150/5127, miR-17/17-5p/20ab/20b-5p/93/106ab/427/518a-3p/519d, miR-193/193b/193a-3p and miR-219-5p/508/508-3p/4782-3p.
Figure 5.
A ceRNA network was constructed using matching data from miRcode. Yellow ovals represent underlying exosome-related lncRNAs. Pink ovals represent miRNAs targeted by lncRNAs and mRNAs. The CTD-2116N20.1 pathways are connected by purple lines, and the RP11-538D16.2 pathways are connected by red lines.
Digoxigenin-labeled chromogenic in situ hybridization
To determine whether CTD-2116N20.1 and RP11-538D16.2 are differentially expressed in tumor and para-carcinoma tissues, we performed CISH on 95 pairs of clinical samples. Clinical characteristics are summarized in Table S3. These two lncRNAs were significantly overexpressed in tumor tissues. CTD-2116N20.1 was overexpressed in 48 tumor tissues and 13 para-carcinoma tissues (Figure 6A). RP11-538D16.2 was overexpressed in 58 tumor tissues and 20 para-carcinoma tissues (Figure 6B). KM analysis was performed to evaluate the differences in the disease-free survival (DFS) and OS of patients in the high-expression and low-expression groups (Figure 6C-F). Patients with overexpression of either CTD-2116N20.1 or RP11-538D16.2 had a shorter OS and DFS (P<0.05).
Figure 6.
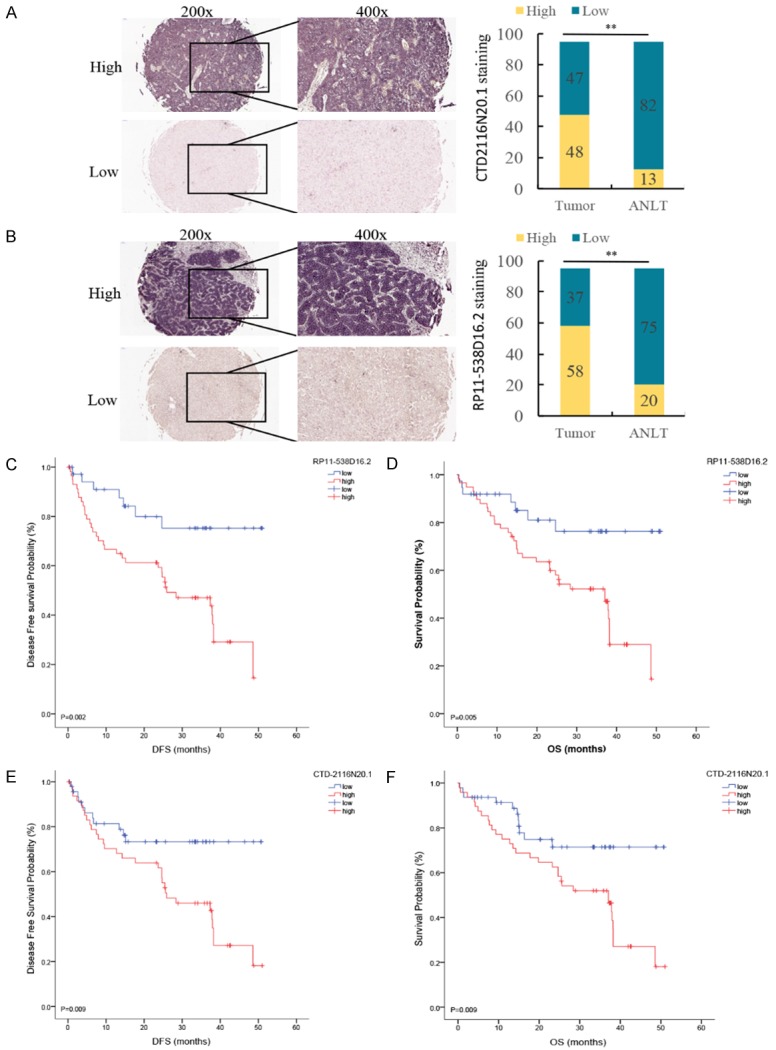
CISH was performed on 95 pairs of clinical samples. A. Shows that CTD-2116N20.1 was overexpressed in 48 tumor tissues and 13 para-carcinoma tissues. B. Shows that RP11-538D16.2 was overexpressed in 58 tumor tissues and 20 para-carcinoma tissues. C and D. Indicate that overexpression of RP11-538D16.2 is related to worse DFS and OS. E and F. Indicate that overexpression of CTD-2116N20.1 is related to worse DFS and OS.
Discussion
In this study, lncRNA expression data and corresponding clinical information for a HCC cohort were analyzed. Five lncRNAs (CTD-2116N20.1, AC012074.2, RP11-538D16.2, LINC00501 and RP11-136I14.5) were identified as prognostic factors whose expression levels were associated with OS. These lncRNAs were annotated with GENCODE (http://www.gencodegenes.org/) and NONCODE (http://www.noncode.org/). Then, a lncRNA-based risk score was constructed. The KM curve suggested a significant difference in OS between the high-risk and low-risk groups. An OS prediction nomogram was developed by combination with the clinical dataset. The AUCs of the lncRNA-based risk scores for the 1-year, 3-year and 5-year OS prediction models were 0.63, 0.58 and 0.65, respectively.
Functional enrichment analysis suggested that these lncRNAs may regulate cell cycle processes, including protein binding, DNA replication, mitosis, cell proliferation and cell division. To explore the correlation between these lncRNAs and exosomes, a co-expression network was constructed using the dataset in ExoCarta. CTD-2116N20.1 qualified as the most critical lncRNA and was suggested to regulate the following proteins: CCNB1, CDCA3, CDCA8, CDKN3, E2F2, HAUS5, LMNB2, MCM4, MYBL2, PLK1, RAD54L, RRM2, TUBA1B and WHSC1. To further explore the biological implications, we analyzed these proteins and found that all of them were related to cell proliferation and tumor metastasis. Previous studies have reported that these proteins promote tumor cell proliferation and induce chemotherapeutic drug resistance in HCC patients [22-31]. RP11-538D16.2 is another critical lncRNA that may regulate MYO16 and GLUL. MYO16 affects cell cycle by regulating subcellular motor function and decreasing protein phosphatase catalytic activity [32]. GLUL is involved in mediating oncogenesis in various kinds of cancer [33,34].
Notably, ceRNAs, which are transcripts that can regulate each other at the post-transcription level by competing for shared miRNAs, link the functions of protein-coding mRNAs and non-coding RNAs in tumors [35]. Previous studies have shown that lncRNAs are generally susceptible to regulation by ceRNA interactions [36,37]. Therefore, the important lncRNAs identified herein may regulate protein coding in exosomes through ceRNA interactions. To explore the mechanism by which lncRNAs regulate exosome protein coding, a ceRNA network was constructed. Based on significant differences in both the expression level and KM analysis, CTD-2116N20.1 and RP11-538D16.2 were selected as critical exosome-related lncRNAs. The results of the ceRNA network analysis are summarized in Figure 5. MiR-141/200a and miR-148ab-3p/152 are reportedly related to cell invasion in different kinds of cancer [38,39]. Moreover, miR-182 promotes HCC cell proliferation and invasion [40]. Furthermore, miR-7/7ab regulates cell proliferation [41], and miR-181abcd/4262 interacts with genes in cancer-related signaling pathways [42]. We performed CISH on 95 pairs of clinical samples, and the results confirmed the overexpression of CTD-2116N20.1 and RP11-538D16.2 in tumors. Clinical analysis suggested that these lncRNAs are correlated with a poor prognosis for HCC patients. CTD-2116N20.1 and RP11-538D16.2 are critical lncRNAs that affect HCC progression by regulating exosomal proteins.
Due to a lack of sufficient data, DFS was not analyzed as a dependent variable. Because of the limited size of the dataset and large differences in the expression levels of the prognostic lncRNAs, the grade score in the nomogram was inconsistent with the clinical logic. However, the OS prediction nomogram had good predictive ability, with a C-index of 0.701. KM analysis of the CISH results combined with the clinical data showed that patients overexpressing RP11-538D16.2 had a worse prognosis, which was contrary to our bioinformatics analysis results. This discrepancy was probably due to the TCGA database, wherein differences in lncRNA expression levels were compared between tumor tissues and normal liver tissues. Differences between individuals may affect the results of the KM analysis.
In summary, five prognostic lncRNAs associated with significant differences in OS were identified. Biological implications were analyzed using KEGG and GO pathway analyses. The enrichment results indicated that these lncRNAs correlate with cell cycle. A co-expression network of the prognostic lncRNAs and exosomal protein expression levels was generated. Finally, CTD-2116N20.1 and RP11-538D16.2 were distinguished from other lncRNAs. According to the bioinformatics analysis and our CISH results, both CTD-2116N20.1 and RP11-538D16.2 lead to a poor prognosis in patients with HCC by regulating the expression levels of proteins in exosomes. A ceRNA network was constructed to describe the possible mechanisms through which CTD-2116N20.1 and RP11-538D16.2 regulate exosomal proteins.
Acknowledgements
This study was supported by the National Nature Foundation of China (grant 81670592); The Nature Science Foundation of Guangdong Province, China (grant 2016A030313242); The Medical Scientific Research Foundation of Guangdong Province China (grant A2016033); The Science and Technology Program of Guangzhou, China (grant 201804020075); and the Fundamental Research Funds for the Central Universities (grant 17ykjc9).
Disclosure of conflict of interest
None.
Abbreviations
- lncRNA
long non-coding RNA
- HCC
hepatocellular carcinoma
- TCGA
The Cancer Genome Atlas
- CISH
chromogenic in situ hybridization
- FC
fold change
- GLM
generalized linear models
- GO
gene ontology (GO)
- KEGG
Kyoto Encyclopedia of Genes and Genomes
- FDR
false discovery rate
- BCIP/NBT
5-bromo-4-chloro-3-indolyl phosphate/nitroblue tetrazolium
- OS
overall survival
- DFS
disease-free survival
- ceRNA
competing endogenous RNA
- DIG
digoxigenin
Supporting Information
References
- 1.Ferlay J, Shin HR, Bray F, Forman D, Mathers C, Parkin DM. Estimates of worldwide burden of cancer in 2008: GLOBOCAN 2008. Int J Cancer. 2010;127:2893–2917. doi: 10.1002/ijc.25516. [DOI] [PubMed] [Google Scholar]
- 2.Zheng G, Zhao R, Xu A, Shen Z, Chen X, Shao J. Co-delivery of sorafenib and siVEGF based on mesoporous silica nanoparticles for ASGPR mediated targeted HCC therapy. Eur J Pharm Sci. 2018;111:492–502. doi: 10.1016/j.ejps.2017.10.036. [DOI] [PubMed] [Google Scholar]
- 3.Wu L, Nguyen LH, Zhou K, de Soysa TY, Li L, Miller JB, Tian J, Locker J, Zhang S, Shinoda G, Seligson MT, Zeitels LR, Acharya A, Wang SC, Mendell JT, He X, Nishino J, Morrison SJ, Siegwart DJ, Daley GQ, Shyh-Chang N, Zhu H. Precise let-7 expression levels balance organ regeneration against tumor suppression. Elife. 2015;4:e09431. doi: 10.7554/eLife.09431. [DOI] [PMC free article] [PubMed] [Google Scholar]
- 4.Shen Z, Li B, Liu Y, Zheng G, Guo Y, Zhao R, Jiang K, Fan L, Shao J. A self-assembly nanodrug delivery system based on amphiphilic low generations of PAMAM dendrimers-ursolic acid conjugate modified by lactobionic acid for HCC targeting therapy. Nanomedicine. 2018;14:227–236. doi: 10.1016/j.nano.2017.10.007. [DOI] [PubMed] [Google Scholar]
- 5.Forner A, Llovet JM, Bruix J. Hepatocellular carcinoma. Lancet. 2012;379:1245–1255. doi: 10.1016/S0140-6736(11)61347-0. [DOI] [PubMed] [Google Scholar]
- 6.Llovet JM, Schwartz M, Mazzaferro V. Resection and liver transplantation for hepatocellular carcinoma. Semin Liver Dis. 2005;25:181–200. doi: 10.1055/s-2005-871198. [DOI] [PubMed] [Google Scholar]
- 7.Ulitsky I, Bartel DP. lincRNAs: genomics, evolution, and mechanisms. Cell. 2013;154:26–46. doi: 10.1016/j.cell.2013.06.020. [DOI] [PMC free article] [PubMed] [Google Scholar]
- 8.George J, Patel T. Noncoding RNA as therapeutic targets for hepatocellular carcinoma. Semin Liver Dis. 2015;35:63–74. doi: 10.1055/s-0034-1397350. [DOI] [PMC free article] [PubMed] [Google Scholar]
- 9.Melo SA, Luecke LB, Kahlert C, Fernandez AF, Gammon ST, Kaye J, LeBleu VS, Mittendorf EA, Weitz J, Rahbari N, Reissfelder C, Pilarsky C, Fraga MF, Piwnica-Worms D, Kalluri R. Glypican-1 identifies cancer exosomes and detects early pancreatic cancer. Nature. 2015;523:177–182. doi: 10.1038/nature14581. [DOI] [PMC free article] [PubMed] [Google Scholar]
- 10.Thery C, Zitvogel L, Amigorena S. Exosomes: Composition, biogenesis and function. Nat Rev Immunol. 2002;2:569–579. doi: 10.1038/nri855. [DOI] [PubMed] [Google Scholar]
- 11.Tkach M, Thery C. Communication by extracellular vesicles: where we are and where we need to Go. Cell. 2016;164:1226–1232. doi: 10.1016/j.cell.2016.01.043. [DOI] [PubMed] [Google Scholar]
- 12.Sohn W, Kim J, Kang SH, Yang SR, Cho JY, Cho HC, Shim SG, Paik YH. Serum exosomal microRNAs as novel biomarkers for hepatocellular carcinoma. Exp Mol Med. 2015;47:e184. doi: 10.1038/emm.2015.68. [DOI] [PMC free article] [PubMed] [Google Scholar]
- 13.Rao Q, Zuo B, Lu Z, Gao X, You A, Wu C, Du Z, Yin H. Tumor-derived exosomes elicit tumor suppression in murine hepatocellular carcinoma models and humans in vitro. Hepatology. 2016;64:456–472. doi: 10.1002/hep.28549. [DOI] [PubMed] [Google Scholar]
- 14.Kogure T, Lin WL, Yan IK, Braconi C, Patel T. Intercellular nanovesicle-mediated microRNA transfer: a mechanism of environmental modulation of hepatocellular cancer cell growth. Hepatology. 2011;54:1237–1248. doi: 10.1002/hep.24504. [DOI] [PMC free article] [PubMed] [Google Scholar]
- 15.Skog J, Wurdinger T, van Rijn S, Meijer DH, Gainche L, Sena-Esteves M, Curry WT, Carter BS, Krichevsky AM, Breakefield XO. Glioblastoma microvesicles transport RNA and proteins that promote tumour growth and provide diagnostic biomarkers. Nat Cell Biol. 2008;10:1470–6. doi: 10.1038/ncb1800. [DOI] [PMC free article] [PubMed] [Google Scholar]
- 16.Chen Y, Lun A, Smyth GK. From reads to genes to pathways: differential expression analysis of RNA-Seq experiments using Rsubread and the edgeR quasi-likelihood pipeline. F1000Res. 2016;5:1438. doi: 10.12688/f1000research.8987.1. [DOI] [PMC free article] [PubMed] [Google Scholar]
- 17.Robinson MD, McCarthy DJ, Smyth GK. edgeR: a Bioconductor package for differential expression analysis of digital gene expression data. Bioinformatics. 2010;26:139–140. doi: 10.1093/bioinformatics/btp616. [DOI] [PMC free article] [PubMed] [Google Scholar]
- 18.Huang da W, Sherman BT, Lempicki RA. Bioinformatics enrichment tools: paths toward the comprehensive functional analysis of large gene lists. Nucleic Acids Res. 2009;37:1–13. doi: 10.1093/nar/gkn923. [DOI] [PMC free article] [PubMed] [Google Scholar]
- 19.Jeggari A, Marks DS, Larsson E. miRcode: a map of putative microRNA target sites in the long non-coding transcriptome. Bioinformatics. 2012;28:2062–2063. doi: 10.1093/bioinformatics/bts344. [DOI] [PMC free article] [PubMed] [Google Scholar]
- 20.Faber W, Stockmann M, Schirmer C, Mollerarnd A, Denecke T, Bahra M, Klein F, Schott E, Neuhaus P, Seehofer D. Significant impact of patient age on outcome after liver resection for HCC in cirrhosis. Eur J Surg Oncol. 2014;40:208–213. doi: 10.1016/j.ejso.2013.10.018. [DOI] [PubMed] [Google Scholar]
- 21.Han DH, Choi GH, Kim KS, Choi JS, Park YN, Kim SU, Park JY, Ahn SH, Han KH. Prognostic significance of the worst grade in hepatocellular carcinoma with heterogeneous histologic grades of differentiation. J Gastroenterol Hepatol. 2013;28:1384–1390. doi: 10.1111/jgh.12200. [DOI] [PubMed] [Google Scholar]
- 22.Zhang JM, Li HD, Huang ZZ, He YF, Zhou XQ, Huang TY, Dai PJ, Duan DP, Ma XJ, Yin QB, Wang XJ, Liu H, Chen SZ, Zou F, Chen XM. Hypoxia attenuates Hsp90 inhibitor 17-DMAGinduced cyclin B1 accumulation in hepatocellular carcinoma cells. Cell Stress Chaperon. 2016;21:339–348. doi: 10.1007/s12192-015-0664-2. [DOI] [PMC free article] [PubMed] [Google Scholar]
- 23.Lawo S, Bashkurov M, Mullin M, Ferreria MG, Kittler R, Habermann B, Tagliaferro A, Poser I, Hutchins JR, Hegemann B, Pinchev D, BuchholZ F, Peters JM, Hyman AA, Gingras AC, Pelletier L. HAUS, the 8-Subunit human augmin complex, regulates centrosome and spindle integrity. Curr Biol. 2009;19:816–826. doi: 10.1016/j.cub.2009.04.033. [DOI] [PubMed] [Google Scholar]
- 24.Hegele RA, Cao HN, Liu DM, Costain GA, Charlton-Menys V, Rodger NW, Durrington PN. Sequencing of the reannotated LMNB2 gene reveals novel mutations in patients with acquired partial lipodystrophy. Am J Hum Genet. 2006;79:383–389. doi: 10.1086/505885. [DOI] [PMC free article] [PubMed] [Google Scholar]
- 25.Nakajima T, Yasui K, Zen K, Inagaki Y, Fujii H, Minami M, Tanaka S, Taniwaki M, Itoh Y, Arii S, Inazawa J, Okanoue T. Activation of B-Myb by E2F1 in hepatocellular carcinoma. Hepatol Res. 2008;38:886–895. doi: 10.1111/j.1872-034X.2008.00324.x. [DOI] [PubMed] [Google Scholar]
- 26.Yu RJ, Li CY, Lin XM, Chen Q, Li J, Song L, Lin L, Liu JN, Zhang Y, Kong WC, Ouyang XN, Chen X. Clinicopathologic features and prognostic implications of MYBL2 protein expression in pancreatic ductal adenocarcinoma. Pathol Res Pract. 2017;213:964–968. doi: 10.1016/j.prp.2017.04.024. [DOI] [PubMed] [Google Scholar]
- 27.Song H, Zhang Y, Liu N, Zhang DD, Wan C, Zhao S, Kong Y, Yuan LD. Let-7b inhibits the malignant behavior of glioma cells and glioma stem-like cells via downregulation of E2F2. J Physiol Biochem. 2016;72:733–744. doi: 10.1007/s13105-016-0512-6. [DOI] [PubMed] [Google Scholar]
- 28.Giaginis C, Vgenopoulou S, Vielh P, Theocharis S. MCM proteins as diagnostic and prognostic tumor markers in the clinical setting. Histol Histopathol. 2010;25:351–370. doi: 10.14670/HH-25.351. [DOI] [PubMed] [Google Scholar]
- 29.Tatsumi R, Ishimi Y. An MCM4 mutation detected in cancer cells affects MCM4/6/7 complex formation. J Biochem. 2017;161:259–268. doi: 10.1093/jb/mvw065. [DOI] [PubMed] [Google Scholar]
- 30.Song B, Liu XS, Rice SJ, Kuang S, Elzey BD, Konieczny SF, Ratliff TL, Hazbun T, Chiorean EG, Liu X. Plk1 phosphorylation of orc2 and hbo1 contributes to gemcitabine resistance in pancreatic cancer. Mol Cancer Ther. 2013;12:58–68. doi: 10.1158/1535-7163.MCT-12-0632. [DOI] [PMC free article] [PubMed] [Google Scholar]
- 31.Lu CH, Zhang J, He S, Wan CH, Shan AD, Wang YY, Yu LT, Liu GL, Chen K, Shi J, Zhang YX, Ni RZ. Increased alpha-Tubulin1b expression indicates poor prognosis and resistance to chemotherapy in hepatocellular carcinoma. Digest Dis Sci. 2013;58:2713–2720. doi: 10.1007/s10620-013-2692-z. [DOI] [PubMed] [Google Scholar]
- 32.Kengyel A, Becsi B, Konya Z, Sellers JR, Erdodi F, Nyitrai M. Ankyrin domain of myosin 16 influences motor function and decreases protein phosphatase catalytic activity. Eur Biophys J Biophy. 2015;44:207–218. doi: 10.1007/s00249-015-1015-z. [DOI] [PMC free article] [PubMed] [Google Scholar]
- 33.Lin YY, Yu MW, Lin SM, Lee SD, Chen CL, Chen DS, Chen PJ. Genome-wide association analysis identifies a GLUL haplotype for familial hepatitis B virus-related hepatocellular carcinoma. Cancer. 2017;123:3966–3976. doi: 10.1002/cncr.30851. [DOI] [PubMed] [Google Scholar]
- 34.Wang YY, Fan SH, Lu J, Zhang ZF, Wu DM, Wu ZY, Zheng YL. GLUL promotes cell proliferation in breast cancer. J Cell Biochem. 2017;118:2018–2025. doi: 10.1002/jcb.25775. [DOI] [PubMed] [Google Scholar]
- 35.Qi XL, Zhang DH, Wu N, Xiao JH, Wang X, Ma W. ceRNA in cancer: possible functions and clinical implications. J Med Genet. 2015;52:710–718. doi: 10.1136/jmedgenet-2015-103334. [DOI] [PubMed] [Google Scholar]
- 36.Guttman M, Donaghey J, Carey BW, Garber M, Grenier JK, Munson G, Young G, Lucas AB, Ach R, Bruhn L, Yang XP, Amit I, Meissner A, Regev A, Rinn JL, Root DE, Lander ES. lincRNAs act in the circuitry controlling pluripotency and differentiation. Nature. 2011;477:295–300. doi: 10.1038/nature10398. [DOI] [PMC free article] [PubMed] [Google Scholar]
- 37.Cesana M, Cacchiarelli D, Legnini I, Santini T, Sthandier O, Chinappi M, Tramontano A, Bozzoni I. A long noncoding RNA controls muscle differentiation by functioning as a competing endogenous RNA. Cell. 2011;147:358–369. doi: 10.1016/j.cell.2011.09.028. [DOI] [PMC free article] [PubMed] [Google Scholar]
- 38.Rasheed SA, Teo CR, Beillard EJ, Voorhoeve PM, Casey PJ. MicroRNA-182 and microRNA-200a control G-protein subunit alpha-13 (GNA13) expression and cell invasion synergistically in prostate cancer cells. J Biol Chem. 2013;288:7986–7995. doi: 10.1074/jbc.M112.437749. [DOI] [PMC free article] [PubMed] [Google Scholar]
- 39.Aure MR, Leivonen SK, Fleischer T, Zhu Q, Overgaard J, Alsner J, Tramm T, Louhimo R, Alnaes GI, Perala M, Busato F, Touleimat N, Tost J, Borresen-Dale AL, Hautaniemi S, Troyanskaya OG, Lingjaerde OC, Sahlberg KK, Kristensen VN. Individual and combined effects of DNA methylation and copy number alterations on miRNA expression in breast tumors. Genome Biol. 2013;14:R126. doi: 10.1186/gb-2013-14-11-r126. [DOI] [PMC free article] [PubMed] [Google Scholar]
- 40.Wang TH, Yeh CT, Ho JY, Ng KF, Chen TC. OncomiR miR-96 and miR-182 promote cell proliferation and invasion through targeting ephrinA5 in hepatocellular carcinoma. Mol Carcinogen. 2016;55:366–375. doi: 10.1002/mc.22286. [DOI] [PubMed] [Google Scholar]
- 41.Wang Y, Liu JY, Liu CY, Naji A, Stoffers DA. MicroRNA-7 regulates the mTOR pathway and proliferation in adult pancreatic beta-cells. Diabetes. 2013;62:887–895. doi: 10.2337/db12-0451. [DOI] [PMC free article] [PubMed] [Google Scholar]
- 42.Wuchty S, Arjona D, Bozdag S, Bauer PO. Involvement of microRNA families in cancer. Nucleic Acids Res. 2012;40:8219–8226. doi: 10.1093/nar/gks627. [DOI] [PMC free article] [PubMed] [Google Scholar]
Associated Data
This section collects any data citations, data availability statements, or supplementary materials included in this article.


