Abstract
Background: This study is to investigate the effect of Egr1 on the mineralization and accumulation of chondrocyte extracellular matrix. Methods: The femoral heads of patients of various heights were collected. Egr1 knockout mice were used. Their limb lengtha nd body weight were assessed. The bone characteristics were detected by micro-CT scan and histological staining. Immature murine articular chondrocytes (iMACs) were isolated. Gross morphology was observed by histological staining. Relevant mRNA and protein expression were detected by qRT-PCR and Western blot, respectively. the related proteins were observed by immunohistochemical staining and immunofluorescence assay. Chromatin immunoprecipitation and reporter gene assay were also used. TUNEL was used to detect apoptosis. Results: It was found that shorter patients had reduced Egr1 expression levels in the hypertrophic cartilage zone of the femoral head. In addition, Egr1 knockout mice exhibited reduced body size. Micro-CT analysis showed that these mice also had reduced bone volume. Safranin-O staining showed that the extracellular matrix of these mice exhibited a relatively limited degree of mineralization, and TUNEL staining showed reduced cell apoptosis levels. After transfecting the iMACs with dominant-negative Egr1 adenoviruses to inhibit Egr1, the enzymes of Adamst4, Adamst5, Mmp3 and Mmp13 were significantly upregulated. ChIP and luciferase assays revealed that Egr1 might regulate the chondrocyte extracellular matrix by the PPARγ/RUNX2 signaling pathways. Conclusion: Egr1 has an important regulatory effect on the dynamic equilibrium of the chondrocyte extracellular matrix, which may be achieved through the PPARγ/RUNX2 signaling pathways.
Keywords: Egr1, PPARγ, RUNX2, immature murine articular chondrocytes, MMPs, extracellular matrix
Introduction
The skeleton of vertebrates is primarily composed of bone and cartilage. Most bones, including the long bones of the limbs, are formed through endochondral ossification [1-3]. In this process, chondrocytes replicate and secrete extracellular matrix, which enlarges the cartilage. Chondrocytes located in the core region of the cartilage will stop replicating, undergo hypertrophy, and secrete collagen X [1,4,5]. The enlargement of these hypertrophic chondrocytes is the primary factor responsible for bone growth [3,6]. Meanwhile, these hypertrophic cells also play an important regulatory role in balance of the bone metabolism. Hypertrophic chondrocytes induce mineralization of the surrounding matrix and secrete factors such as VEGF, which induce vascularization [4,7]. They also induce adjoining peri-chondrocytes to differentiate into osteoblasts, which secrete bone matrix and form a bone collar [1,3,4]. Next, hypertrophic chondrocytes will undergo apoptosis and the cartilage matrix will provide support for osteoblasts and blood vessels. Thus, the primary ossification centeris formed and from this center the resulting bone (cancellous bone) is generated [2,4]. Chondrocyte cells have unique morphologies, and the matrix they secrete is rich ofcollagen II and the proteoglycan aggrecan [8]. Matrix metalloproteinases (MMPs), including MMP3 and MMP13, and aggrecanases (ADAMTS-4 and ADAMTS-5), participate in the degradation and remodeling of the chondrocyte extracellular matrix [8,9]. The dynamic equilibrium of the chondrocyte extracellular matrix plays a key role in endochondral ossification and the development of bones.
Early growth response protein 1 (Egr1), also known as NGFI-A, Zif268, Krox-24 and TIS8, is one of the classic zinc finger transcription factors. It is the product of the immediate early genes [10,11] and can mediate cellular responses to environmental stimuli, such asmitogenic stimuli and stress signals [12,13]. It plays an important role in cell differentiation, proliferation, apoptosis, and inflammation [14-17]. Our previous study showed that Egr1 activation was able to decrease the insulin sensitivity of adipocytes by increasing hepatic gluconeogenesis, thus aggravating the progression of type 2 diabetes [18]. Wu et al. found that miR-192 could prevent tumor angiogenesis by suppressing the expression of Egr1 and HOXB9, demonstrating that Egr1 may play a role in the formation of blood vessels in tumor tissues [19]. Egr1 also plays a significant role in the homeostasis of skeletal system. For example, Gaut et al. reported that Egr1 overexpression prevented downregulation of tendon genes such as Scx and Tnmd in an environment free from mechanical signals, and promoted tendon and ligament healing [20]. Nuttall et al. found that Egr1 was down-regulated more than six-fold in human osteoarthritis cartilage samples compared to normal tissues [21]. It has been suggested that Egr1 may participate in the synthesis and degradation of chondrocyte extracellular matrix [22]. However, the role of Egr1 in the mineralization and accumulation of the chondrocyte extracellular matrix, and in skeletal development is still unclear.
Herein, we first analyzed the expression levels of Egr-1 in cartilage from clinical patients with different heights. Then, the role and mechanism of Egr-1 in the mineralization and accumulation of the chondrocyte extracellular matrix were investigated and discussed.
Materials and methods
Human tissue samples
A total of 10 male patients who was suffering from necrosis of the femoral head subsequent to injury were enrolled (Table 1). According to the average male height of China (167.1 cm published by National Health and Family Planning Commission of the People’s Republic of China) (http://www.nhfpc.gov.cn/zwgk/jdjd/201506/4505528e65f3460fb88685081ff158a2.shtml), the patients were divided into normal group (172.0 ± 1.42 cm) and short group (162.0 ± 1.48 cm). Further inclusion criteria were male, age between 40-70 years old and prepared for total femoral head arthroplasty. Exclusion criteria were: (1) Diagnosed with hypertension and diabetes mellitus; (2) Received glucocorticoid hormone therapy within 3 months; (3) Infections; (4) Diagnosed with autoimmune disease. After total hip arthroplasty, the non-wearing area cartilage of femoral head were obtained and stained with Safranin-O/fast green, hematoxylin-eosin (H&E) and Toluidine blue, respectively. Prior written and informed consent was obtained from every patient and the study was approved by the ethics review board of Nanjing University.
Table 1.
Patient demographics
| Normal group (n=5) | Short group (n=5) | p value | |
|---|---|---|---|
| Age (year) | 62.00 ± 6.6 | 57.67 ± 3.7 | 0.6 |
| Gender | Male | Male | |
| Height (cm) | 172.0 ± 1.42 | 162.0 ± 1.48 | 0.002 |
| Weight (kg) | 77.50 ± 6.8 | 56.50 ± 4.6 | 0.04 |
| Body mass index | 26.11 ± 1.8 | 21.46 ± 1.4 | 0.1 |
Animals and sampling
C57/Bl6J (B6) male mice were purchased from the Model Animal Research Center of Nanjing University (Nanjing, China). Egr1 knockout (KO) male mice were produced as described previously [23]. All of the mice were housed in a 12-h light/dark cycle in a temperature- and humidity-controlled environment and were fed with a standard diet (65% carbohydrate, 4% fat, 24% protein). All mice used in this study were 20 weeks old male. Totally, six wild type (WT) mice and six Egr1 KO mice were used in this study. At the end of the feeding period, mice were anesthetized with halothane and tissues were harvested for analysis as described below. Body weight and the length of limbs were measured immediately. All animal experiments were conducted according to the ethical guidelines of Nanjing University.
Microcomputed tomography (micro-CT) analysis
The left femora dissected from Egr1 KO or WT mice were fixed with 4% paraformaldehyde (PFA) overnight, and washed by PBS, then scanned by a micro-CT scanner (SkyScan, Aarselaar, Belgium). X-ray voltage and current were set to 80 kV and 80 μA, respectively, with a resolution of 18 μm per pixel. Cross-sectional images of the mid-diaphysis of femur were used to perform the three-dimensional histomorphometric analysis of trabecular bones. For the distal femur, the region of interest (ROI) selected for analysis was 5% of the femoral length from 0.05 mm below the growth plate and this ROI was used to determine bone mineral density, trabecular bone volume per tissue volume, trabecular number, trabecular separation and trabecular thickness. For cortical bones, the ROI selected for analysis was of 10% of the femoral length in the mid-diaphysis of the femur and this ROI was used to determine the cortical thickness.
Safranin-O/fast greenstaining, HE staining and TUNEL labeling
The dissected right femora of patients and the femoral head cartilage of mice were fixed in 4% PFA overnight, decalcified in 5% EDTA in PBS for 2 weeks, and then embedded in paraffin wax after dehydration. The samples were coronally cut into 5 µm serial sections and then stained with Safranin-O/fast green or H&E as previously described [24,25]. For TUNEL labeling, the PFA-fixed paraffin-embedded sections were prepared and labeled according to the In Situ Cell Death Detection Kit (Roche) protocol.
Immunohistochemical staining and immunofluorescence assay
Bone sections were deparaffinized in xylene and rehydrated through graded ethanol, and then incubated in 3% H2O2 for 10 min. Antigen-retrieval was performed by heating the sections for 9 min in EDTA buffer (pH=6.0). The slides were incubated with the specific primary antibodies for Caspase 3 (Cell Signaling Technology, USA), Egr1 (Santa Cruz, CA, USA), PPARγ (Santa Cruz, CA, USA) and RUNX2 (Santa Cruz, CA, USA) overnight at 4°C. The tissue slides were then incubated with secondary antibody of goat anti-rabbit IgG (HRP-labeled) (Santa Cruz, CA, USA), developed by 3,3’-diaminobenzidine and counterstained with haematoxylin. For the immunofluorescence assay, the sections were incubated with specific primary antibodies for Egr-1 (Santa Cruz, CA, USA) and then incubated with a peroxidase-conjugated anti-fluorescein antibody (Cell Signaling Technology, Massachusetts, USA). The above stained sections were then viewed using an Olympus BX51 phase contrast light microscope (Olympus Corporation, Japan) and photographed using an Olympus CC12 camera and Image-Pro Plus software (version 6.1; Media Cybernetics, Inc., Bethesda, MD).
Western blot
The femoral heads were homogenized and lysed in RIPA buffer. Total proteins were collected by centrifugation at 4°C for 15 min at 13,000×g. Then, total proteins were subjected to 10% SDS-PAGE and transferred onto PVDF membranes (Bio-Rad, Richmond, CA). The membranes were blocked in 4% non-fat milk. The primary antibodies of Egr1, PPARγ and RUNX2 were added and incubated at 4°C for overnight (Santa Cruz Biotech). Then, the membranes were incubated with horseradish peroxidase-conjugated secondary antibodies.
Isolation and culture of immature murine articular chondrocytes (iMACs)
The iMACs were isolated as previously described [26]. Briefly, femoral heads and tibial plateaus from 12male mice (C57Bl/6 mice, ages 6 days) were dissected and incubated for 45 minutes with collagenase D (3 mg/ml in Dulbecco’s modified Eagle’s medium, DMEM) at 37°C in 5% CO2. And the cartilage pieces were incubated overnight with collagenase D (0.5 mg/ml) at 37°C. The resulting chondrocytes were suspended in culture medium (DMEM-Glutamax containing 1 g/L glucose, Gibco) plus 10% fetal calf serum (FCS) and antibiotics. The chondrocytes were then seeded in 10-cm dishes (designated passage 0, P0).
Adenovirus infection
Dominant-negative Egr1 adenovirus (DnEgr1) was constructed as described previously [27]. The iMACs were infected with dominant-negative Egr1 adenovirus or Ad-eGFP in serum-free medium for 6 h and the medium was then supplemented with 2% fetal bovine serum to maintain cell survival for another 24 h.
Treatment with PPARγ inhibitor
The primary chondrocyte was treated with 50 mmol/L PPARγ inhibitor, T0070907 (Cayman, Michigan) or DMSO for 18 h. After that, total RNA was isolated as described below.
Real-time quantitative reverse transcription PCR (qRT-PCT)
Total RNA from treated cells was isolated using Trizolreagent (TaKaRa) and reversely transcribed into cDNA. The qRT-PCR performed on an ABI Viia 7 machine (Applied Biosystems, Carlsbad, CA) using SYBR-Green master mix (TaKaRa). Primer sequences were shown in Table 2. The following PCR procedure was used: 2 min activation of the HotGoldStar Taq enzyme (TaKaRa) at 95°C and 40 cycles of amplification: 5 s denaturation at 95°C, 30 s annealing at 60°C, 15 s elongation at 72°C. The relative expression level of each gene was calculated using the 2-ΔCT method and all of the quantitation was independent, conducted in triplicate, and normalized to an endogenous GAPDH control.
Table 2.
Primer sequences
| Gene symbol | 5’-Forward primer-3’ | 5’-Reverse primer-3’ |
|---|---|---|
| Caspase 3 | ATGGAGAACAACAAAACCTCAGT | TTGCTCCCATGTATGGTCTTTAC |
| Caspase 6 | GGAAGTGTTCGATCCAGCCG | GGAGGGTCAGGTGCCAAAAG |
| Caspase 8 | TGCTTGGACTACATCCCACAC | TGCAGTCTAGGAAGTTGACCA |
| Egr1 | TCGGCTCCTTTCCTCACTCA | CTCATAGGGTTGTTCGCTCGG |
| ADAMTS4 | ATGGCCTCAATCCATCCCAG | GCAAGCAGGGTTGGAATCTTTG |
| ADAMTS5 | CCCAGGATAAAACCAGGCAG | CGGCCAAGGGTTGTAAATGG |
| MMP3 | ACATGGAGACTTTGTCCCTTTTG | TTGGCTGAGTGGTAGAGTCCC |
| MMP13 | CTTCTTCTTGTTGAGCTGGACTC | CTGTGGAGGTCACTGTAGACT |
| PPAR-gamma | GGAAGACCACTCGCATTCCTT | GTAATCAGCAACCATTGGGTCA |
| Runx2 | ATGCTTCATTCGCCTCACAAA | GCACTCACTGACTCGGTTGG |
| GAPDH | AGGTCGGTGTGAACGGATTTG | TGTAGACCATGTAGTTGAGGTCA |
Chromatin immunoprecipitation (ChIP) assay
At 48 h after adenovirus infection, chromatin lysates of iMACs were prepared. The lysate was pre-cleared with Protein-A/G agarose beads, and then immunoprecipitated with antibodies against the corresponding protein or control mouse IgG (Santa Cruz Biotech) in the presence of BSA and salmon sperm DNA. Beads were extensively washed before reverse cross-linking, and the bound DNA was purified using a PCR purification kit (Qiagen). Subsequently, the purified DNA was analyzed by PCR or qRT-PCR using primers flanking the GC element in the mice RUNX2 promoter.
Dual luciferase reporter assay
The iMACs cells were plated into 24-well plates at a concentration of 4×10⁴ cells per well. After 12 hours, the plasmid (240 ng pcDNA3.0 + 250 ng Runx2-pGL3 + 10 ng renilla or 240 ng pcDNA3.0-Egr1 + 250 ng Runx2-pGL3 + 10 ng renilla) was transfected into the cells. After 72 hours of transfection, luciferase activity was measured using the Dual-Glo® Luciferase Assay System (E1910, Promega, Madison, USA).
Statistical analysis
All the experiments were performed in triplicate. The data are presented as mean ± standard deviation (SD). Comparison among groups was performed with one-way ANOVA. A P<0.05 was considered statistically significant.
Results
Reduced Egr1 expression in cartilage of short patients
The femoral heads were collected from patients with hip replacement operation. The demographic data showed no significant difference between normal group and short group except the height (P=0.002) and weight (P=0.04, Table 1). The accumulation of the chondrocyte extracellular matrix in the non-wearing areas was observed. The superficial zone chondrocytes of short group exhibited a gross morphology that was not noticeably different from those of the normal group (Figure 1A and 1B). However, the cells in transition zone were larger and disordered in short group (Figure 1C). Immunofluorescent staining showed that short patients had reduced Egr1 expression in the hypertrophic cartilage zone of the femoral heads (Figure 1D). This suggests that Egr1 may play a role in regulating the accumulation of the chondrocyte extracellular matrix.
Figure 1.
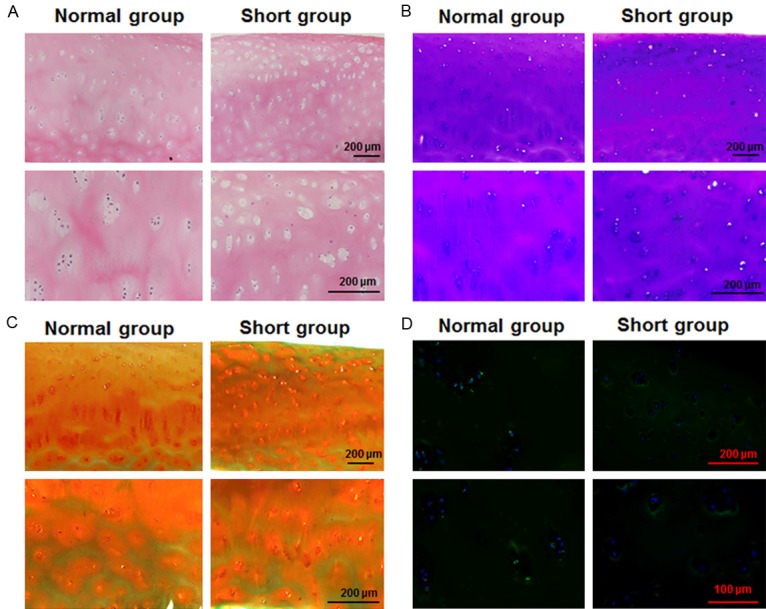
Analysis of femoral cartilage morphology and Egr1 expression in the cartilage of patients. Microscopic appearance of the femoral head cartilage of patients suffering from necrosis of the femoral head was observed. Paraffin-embedded sections were stained with (A) H&E, (B) Toluidine blue or (C) Safranine-O. Magnification was 100× and 200×. (D) Representative sections from patient cartilage were probed for Egr1 by immunofluorescence. Magnification was 200× and 400× (Normal height patient N=5, shorter height patient N=5).
Egr1 KO mice shows lower body weight and shorter limb length
The gross morphological indicators of Egr1 KO and WT mice were assessed. It was found that the body size and weight of KO mice were relatively small (Figure 2A) and had a relatively short limb length at 20 weeks (Figure 2B). And, the difference in weight and femur length was significant (Figure 2C and 2D). These results indicate that Egr1 may play a role in regulating skeletal development in mice.
Figure 2.
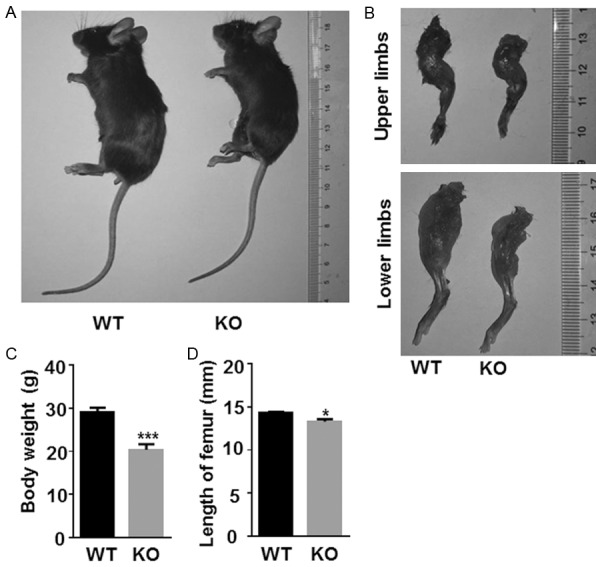
Egr1 KO mice showed lower body weight and shorter limb length. Representative (A) body size and (B) the length of upper and lower limbs of WT and Egr1 KO mice were assessed. The (C) Body weight and (D) the length of femur of 20-week-old Egr1 WT and KO mice were shown. (WT, n=6; Egr1 KO, n=6) (*P<0.05; **P<0.01; ***P<0.001).
Egr1 KO mice shows reduced bone volume
To further analyze the differences in the femurs between Egr1 KO and WT mice, a micro-CT scan was performed. The 3D image reconstruction showed obviously lower density in some trabecular bone regions of the Egr1 KO mice (Figure 3A). The bone mineral density and the bone volume fraction of the femur in Egr1 KO mice were significantly lower compared to the Egr1 WT group (P<0.05) (Figure 3B and 3C). After assessing trabecular bone microstructure, it was found that the trabecular thickness of Egr1 KO mice was significantly decreased than that of the Egr1 WT mice (Figure 3D). However, there was no statistically significant difference in femoral trabecular number, trabecular separation or the cortical thickness between the two groups (Figure 3E-G). These results show that the Egr1 KO mice have significantly lower bone volume compared to Egr1 WT mice.
Figure 3.
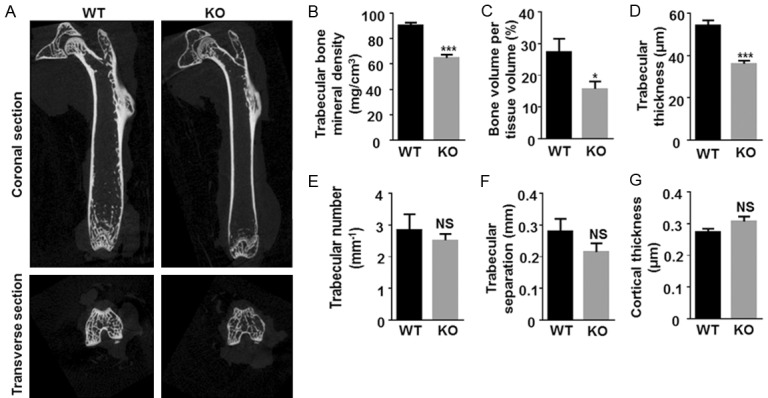
Analysis of bone characteristics of Egr1 WT and KO mice. (A) Representative images of micro-CT analysis of femur showed reduced bone volume of Egr1 KO mice. The (B) bone mineral density, (C) bone volume per tissue volume, (D) trabecular thickness, (E) trabecular number, (F) trabecular separation and (G) cortical thickness of the femur of 20-week-old Egr1 WT and KO mice were shown. (WT, n=6; KO, n=6) (*P<0.05; **P<0.01; ***P<0.001).
Egr1 KO mice shows relatively limited chondrocyte extracellular matrix mineralization
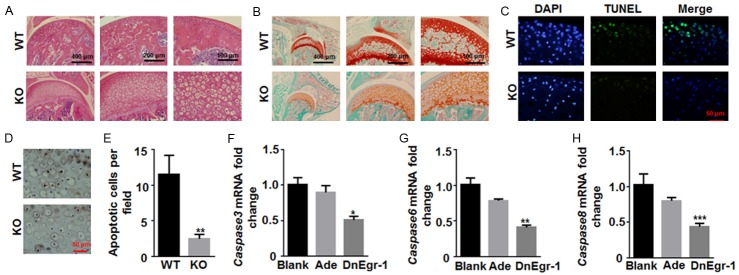
Then, a systematic morphological assessment of the articular cartilage of Egr1 KO and WT mice was performed. H&E and Safranin-O staining revealed morphological abnormalities in the subchondral bone cells of the Egr1 KO mice (Figure 4A and 4B). In Egr1 KO mice, the number of hypertrophic chondrocyte was greater, and the hypertrophic chondrocytes were arranged in an irregular, scattered manner (Figure 4A). The extracellular matrix was hard to be stained with Safranin-O and showed a limited degree of mineralization (Figure 4B). TUNEL staining revealed reduced levels of chondrocyte apoptosis in Egr1 KO mice (Figure 4C) and there was significant difference in apoptotic cells between Egr1 WT and KO mice (P<0.05) (Figure 4E). The low apoptosis rate was also confirmed by the lower expression of caspase-3 in Egr1 KO mice (Figure 4D). In addition, by infecting iMACs with DnEgr1 virus to suppress Egr1 expression, the mRNA expression of caspase-3, caspase-6, and caspase-8 in the cells was also significantly downregulated (Figure 4F-H). These results indicate that Egr1 KO in mice results in less chondrocyte extracellular matrix mineralization by inhibiting chondrocyte apoptosis.
Figure 4.
Egr1 KO mice showed relatively limited chondrocyte extracellular matrix mineralization. Microscopic appearance of the femoral head cartilage of Egr1 KO and WT mice was observed. Paraffin-embedded sections were stained with (A) H&E and (B) Safranine-O. Magnification was 100×, 200× and 400×, respectively. (C) Representative sections from Egr1 KO and WT mice cartilage were stained with TUNEL (WT, n=6; KO, n=6). (D) Immunohistochemical staining for the cleaved Caspase 3 in the cartilage of Egr1 KO and WT mice. (E) Apoptotic cells per field were counted from 5 slides (10 fields in each slide). The mRNA expression of (F) Caspase 3, (G) Caspase 6 and (H) Caspase 8 in iMACs transfected with dominant-negative Egr1 (DnEgr1) virus was detected by qRT-PCR. (*P<0.05; **P<0.01; ***P<0.001).
Suppressing Egr1 in primary chondrocytes upregulates enzyme genes related to chondrocyte extracellular matrix degradation
To detect the expression of enzyme genes related to the degradation of the extracellular matrix secreted by chondrocytes after Egr1 suppression, qRT-PCR was performed. As expected, Egr1 expression in iMACs was significantly suppressed by DnEgr1 virus transfection (Figure 5A). Adamts4 and Adamts5 are two members of the Zn2+-dependent, secreted matrix metalloproteinases (MMPs) family, and they are important enzymes found in the cartilage matrix that can degrade proteoglycans [28]. After Egr1 expression suppression, the iMACs showed significantly higher levels of Adamts4 mRNA (Figure 5B) and Adamts5 mRNA (Figure 5C) (P<0.05). At the same time, the levels of Mmp13 (Figure 5D) and Mmp3 mRNA (Figure 5E) were also significantly upregulated (P<0.05). These results suggest that suppressing Egr1 expression in iMACs can strongly promote the secretion of related metalloproteinases, thus promoting the degradation of the chondrocyte extracellular matrix.
Figure 5.
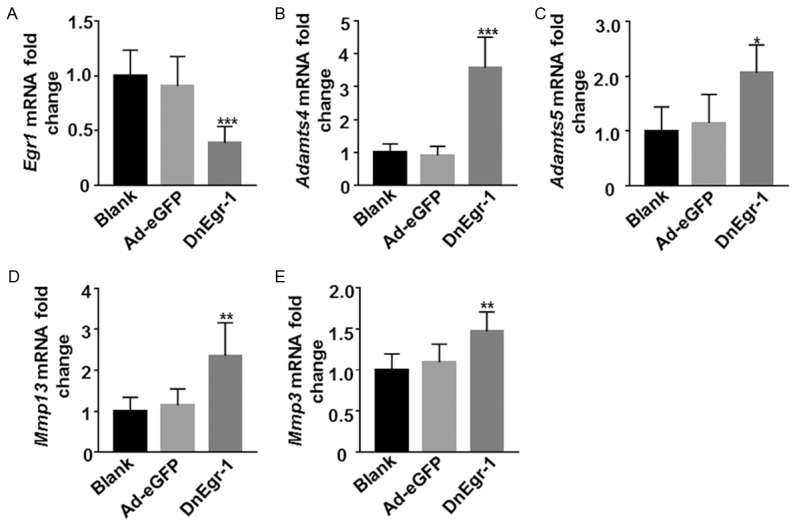
Suppressing Egr1 in primary chondrocytes upregulatedenzyme genes related to chondrocyte extracellular matrix degradation. The iMACs were infected with adenoviruses (Ade) or dominant-negative Egr1 (DnEgr1). The mRNA levels were detected by qRT-PCR. Quantitative results were shown. A. Egr1 mRNA. B. Adamts4 mRNA. C. Adamts5 mRNA. D. Mmp13 mRNA. E. Mmp3 mRNA. Each target gene was normalized to GAPDH (*P<0.05; **P<0.01; ***P<0.001).
Egr1/PPARγ/RUNX2 signaling pathways participate in the regulation of the chondrocyte extracellular matrix
In order to investigate the mechanisms underlying the effects of Egr1 on extracellular matrix mineralization, the levels of key proteins in the Egr1/PPARγ/RUNX2 signaling pathways were analyzed. High expression of Egr1 was detected in WT chondrocyte (Figure 6A), which resulted in lower PPARγ and higher RUNX2 expression (Figure 6B and 6C). However, PPARγ was increased in Egr1 KO mice (Figure 6B) whereas RUNX2 expressionwas decreased in Egr1 KO mice (Figure 6C). These results were also confirmed by Western blot (Figure 6D). The luciferase reporter assay revealed that RUNX2 promoter activity was markedly decreased after trasfection of pcDNA3.0-Egr1 (Figure 6E). However, the ChIP assay showed that Egr1 did not bind to the promoter region of RUNX2 (Figure 6F). These results also suggest that Egr1 may not achieve its effect by direct binding to RUNX2. Further analysis showed that higher PPARγ expression was detected in dominant-negative Egr1 adenovirus transfected iMACs cell (Figure 6G). These results above suggest Egr1 KO may inhibit RUNX2 expression indirectly through upregulated PPARγ. Thus, we treated the primary chondrocytes with T0070907, a PPARγ inhibitor. The significantly higher Runx2 mRNA was detected (Figure 6H). Meanwhile, the expression of Mmp3 and Adamts 4 mRNA significantly decreasd in the primary chondrocytes treated with T0070907 (Figure 6I and 6K), while that of Mmp13 mRNA had no significant changes (Figure 6J).
Figure 6.
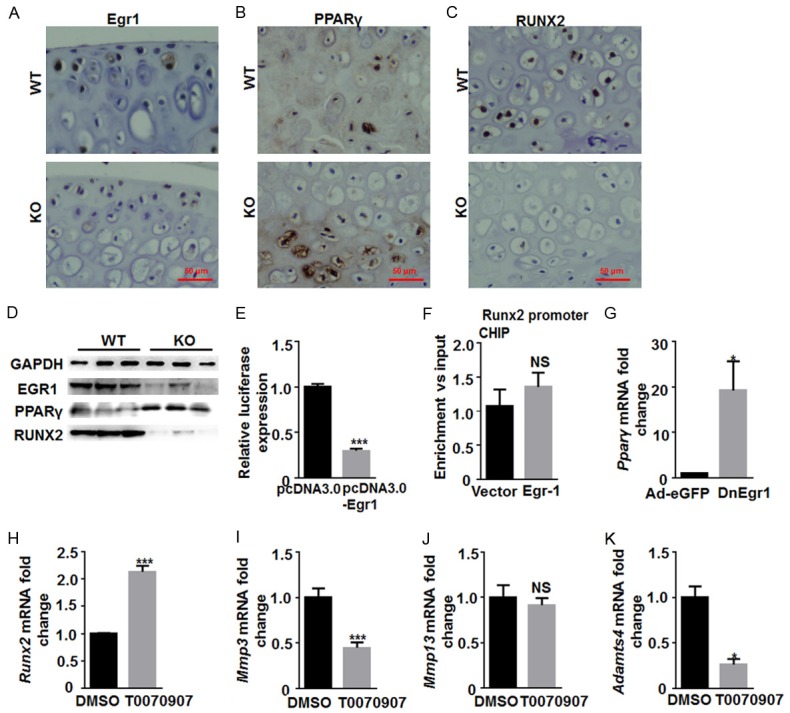
Egr1/PPARγ/RUNX2 signaling pathways participate in the regulation of the chondrocyte extracellular matrix. Representative images of the immunohistochemical staining for (A) Egr1, (B) PPARγ and (C) Runx2 in the Egr1 KO and WT mice cartilage. (D) Western blot was used to analyze the Egr1, PPARγ and Runx2 protein expression in the Egr1 KO and WT mice. GAPDH was used as control. (E) A luciferase reporter gene assay for the detection of Egr1 effect on Runx2. (F) Chromatin immunoprecipitation was performed in iMACs using antibodies of Egr1 to examine the direct interaction between Egr1 and Runx2. Precipitated DNA was analyzed by real-time PCR. (G) qRT-PCR analysis of PPARγ mRNA was performed after transfected DnEgr1 virus into iMACs. The mRNA expression of (H) Runx2, (I) Mmp3, (J) Mmp13 and (K) ADAMTS like 4 in iMACs were analyzed by qRT-PCR after treated with PPARγ inhibitors, T0070907 or DMSO. (*P<0.05; **P<0.01; ***P<0.001).
Taken together, these results illustrate that the Egr1/PPARγ/RUNX2 signaling pathwaymay participate in the regulation of the chondrocyte extracellular matrix.
Discussion
The body height depends mainly on the length of the spine and long bone, whose growth is mainly through endochondral ossification. In this study, the expression of Egr1 in the short group was lower. And the Egr1-KO mice showed relatively lower body weight, shorter limb length and reduced bone volume. Moreover, Egr1-KO mice also showed lower chondrocyte apoptosis rate, which induced the limited chondrocyte extracellular matrix mineralization. Thus, this study suggests that Egr1 has an important regulatory effect on the dynamic equilibrium of the chondrocyte extracellular matrix.
Egr1 is an important transcription factor that primarily participates in cell differentiation, proliferation, apoptosis, inflammation, and other processes [19,22,29-31]. In this study, reduced Egr1 expression was found in the chondrocyte extracellular matrix in the non-wearing areas of the femoral head of relatively shorter patients. We also observed that Egr1 KO mice exhibited reduced body size and femur length at adulthood. Thus, we speculate that Egr1 might play a role in the regulation of limb length.
A research by Chen et al. found that ERK1 and ERK2 were able to disrupt endochondral bone formation by influencing chondrocyte terminal differentiation and reducing the secretion of factors such as MMP13 and osteopontin, resulting in the reduced limb length in mice [32]. In this research, suppressing the Egr1 gene in iMACs caused an increased expression of secreted enzymes that related to extracellular matrix degradation, such as Adamts4, Adamts5, Mmp3 and Mmp13. Morphological abnormalities in the subchondral bone cells of Egr1 KO mice were observed. A research by Dalcq et al. [10] also demonstrated the importance of Egr1 in cartilage development. They found that Follistatin A expression was increased in Egr1 KO zebrafish, which inhibited BMP signaling and ultimately affected cartilage development in the pharyngeal region [10]. These findings suggest that Egr1 may affect the chondrocyte proliferation in the period of endochondral ossification, which may regulate the limb length.
RUNX2 has a major effect on chondrocyte differentiation and chondrocyte extracellular matrix deposition [33,34]. Yoshida et al. found that RUNX2 and RUNX3 might be involved in the development of limb (29). When RUNX2/3 genes were knocked out, reduced chondrocyte proliferation and hypertrophy were observed, leading to decreased Indian hedgehog (IHH) expression and reduced limb length [35]. Komori et al. revealed that RUNX2, CBFA1 and PEBP2αA might play a major role during chondrocyte terminal differentiation [36]. Additionally, RUNX2 and AP-1 could regulate MMP13 expression together, thus influencing the process of cartilage matrix degradation during endochondral bone formation [37,38]. In this study, we found that RUNX2 expression was noticeably reduced in Egr1 KO mice. However, ChIP and luciferase reporter assays revealed that Egr1 did not directly regulate RUNX2 expression. Thus, indirect regulation might be achieved through the use of additional factors. Some researchers have demonstrated that PPARγ has a similar effect on the regulation of cartilage metabolism. For example, Vasheghani et al. found that cartilage-specific PPARγ KO mice exhibited aggravated progression of spontaneous osteoarthritis [39]. In addition, Monemdjou et al. observed reduced limb length, reduced body weight and slow skeletal development in cartilage-specific PPARγ KO mice [22]. In this study, we observed a noticeable increase in PPARγ expression when suppressed Egr1 expression in primary chondrocytes, suggesting that Egr1 may have an inhibitory effect on PPARγ. These findings are consistent with the ones by Zhou et al., which reported that PPARγ expression in hepatic stellate cells was inhibited when using Egr1 expression was upregulated [40]. In addition, when we inhibited PPARγ expression in iMACs using the inhibitor T0070907, RUNX2 expression was markedly increased, while Mmp3 and Adamts4 mRNA expression was noticeably reduced. These results indicated that PPARγ might participate in the regulation of chondrocyte extracellular matrix by inhibiting RUNX2 expression.
Conclusion
Egr1 KO mice showed relatively shorter limb length and reduced bone volume. PPARγ upregulation inhibited RUNX2 expression, leading to the promotion of MMPs family members, disturbing the normal apoptosis of chondrocyte and finally decreasing the equilibrium of chondrocyte extracellular matrix (Figure 7). These findings improve our understanding about endochondral bone development abnormalities and the role of Egr1 in regulating this physiological process.
Figure 7.
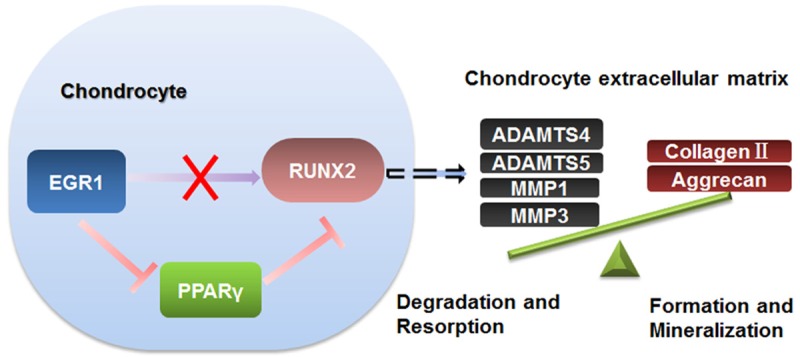
A model for the dynamic equilibrium regulation of chondrocyte extracellular matrix by Egr1. In the process of cartilage enlargement, knockout of Egr1 in chondrocytes disrupts the dynamic equilibrium of chondrocyte extracellular matrix. The inhibition of Egr1 on PPARγ and the inhibition of PPARγ on RUNX2 were relieved, which lead to upregulation of the enzyme genes related to chondrocyte extracellular matrix degradation and affect skeletal development.
Acknowledgements
This work was supported by the Chinese National Science Foundation (31371373, 31771572), the Nature Science Foundation of Jiangsu Province (BK20151395), the Open Fund of State Key Laboratory of Natural Medicines (No. SKLNMKF201811) Supported by the Fundamental Research Funds for the Central Universities (021414380330) Six talent peaks project in Jiangsu Province (yy-014), the Projects of International Cooperation and Exchanges NS-FC (81420108021), National Key Technology Support Program (2015BAI08B02), Excellent Young Scholars NSFC (81622033), Jiangsu Provincial Key Medical Center Foundation, Jiangsu Provincial Medical Talent Foundation and Jiangsu Provincial Medical Outstanding Talent Foundation. This work was also supported by Liver Disease Collaborative Research Platform, Medical School of Nanjing University and Translational Medicine Core Facilities, Medical School of Nanjing University.
Disclosure of conflict of interest
None.
Abbreviations
- Egr1
Early growth response protein 1
- PPARγ
peroxisome proliferator-activated receptor γ
- RUNX2
Runt-related transcription factor 2
- iMACs
Immature murine articular chondrocytes
- MMPs
Matrix metalloproteinases
- ADAM
Aggrecanases
- BMD
Bone mineral density
- BV/TV
Bone volume per tissue volume
- Tb. N
Trabecular number
- Tb. Sp
Trabecular separation
- Tb. Th
Trabecular thickness
- Ct. Th
Cortical thickness
- PFA
Paraformaldehyde
- EDTA
Ethylene Diamine Tetraacetic Acid
- Qpcr
Quantitative PCR
- ECM
Extracellular matrix
References
- 1.Berendsen AD, Olsen BR. Bone development. Bone. 2015;80:14–18. doi: 10.1016/j.bone.2015.04.035. [DOI] [PMC free article] [PubMed] [Google Scholar]
- 2.Colnot CI, Helms JA. A molecular analysis of matrix remodeling and angiogenesis during long bone development. Mech Dev. 2001;100:245–250. doi: 10.1016/s0925-4773(00)00532-3. [DOI] [PubMed] [Google Scholar]
- 3.Kronenberg HM. Developmental regulation of the growth plate. Nature. 2003;423:332–336. doi: 10.1038/nature01657. [DOI] [PubMed] [Google Scholar]
- 4.Provot S, Schipani E. Molecular mechanisms of endochondral bone development. Biochem Biophys Res Commun. 2005;328:658–665. doi: 10.1016/j.bbrc.2004.11.068. [DOI] [PubMed] [Google Scholar]
- 5.Wei X, Hu M, Mishina Y, Liu F. Developmental regulation of the growth plate and cranial synchondrosis. J Dent Res. 2016;95:1221–1229. doi: 10.1177/0022034516651823. [DOI] [PMC free article] [PubMed] [Google Scholar]
- 6.Tamamura Y, Otani T, Kanatani N, Koyama E, Kitagaki J, Komori T, Yamada Y, Costantini F, Wakisaka S, Pacifici M, Iwamoto M, Enomoto-Iwamoto M. Developmental regulation of Wnt/beta-catenin signals is required for growth plate assembly, cartilage integrity, and endochondral ossification. J Biol Chem. 2005;280:19185–19195. doi: 10.1074/jbc.M414275200. [DOI] [PubMed] [Google Scholar]
- 7.Gerber HP, Vu TH, Ryan AM, Kowalski J, Werb Z, Ferrara N. VEGF couples hypertrophic cartilage remodeling, ossification and angiogenesis during endochondral bone formation. Nat Med. 1999;5:623–628. doi: 10.1038/9467. [DOI] [PubMed] [Google Scholar]
- 8.Aigner T, Soder S, Gebhard PM, McAlinden A, Haag J. Mechanisms of disease: role of chondrocytes in the pathogenesis of osteoarthritis--structure, chaos and senescence. Nat Clin Pract Rheumatol. 2007;3:391–399. doi: 10.1038/ncprheum0534. [DOI] [PubMed] [Google Scholar]
- 9.Stamenkovic I. Extracellular matrix remodelling: the role of matrix metalloproteinases. J Pathol. 2003;200:448–464. doi: 10.1002/path.1400. [DOI] [PubMed] [Google Scholar]
- 10.Dalcq J, Pasque V, Ghaye A, Larbuisson A, Motte P, Martial JA, Muller M. RUNX3, EGR1 and SOX9B form a regulatory cascade required to modulate BMP-signaling during cranial cartilage development in zebrafish. PLoS One. 2012;7:e50140. doi: 10.1371/journal.pone.0050140. [DOI] [PMC free article] [PubMed] [Google Scholar]
- 11.Spaapen F, van den Akker GG, Caron MM, Prickaerts P, Rofel C, Dahlmans VE, Surtel DA, Paulis Y, Schweizer F, Welting TJ, Eijssen LM, Voncken JW. The immediate early gene product EGR1 and polycomb group proteins interact in epigenetic programming during chondrogenesis. PLoS One. 2013;8:e58083. doi: 10.1371/journal.pone.0058083. [DOI] [PMC free article] [PubMed] [Google Scholar]
- 12.Gashler A, Sukhatme VP. Early growth response protein 1 (Egr-1): prototype of a zinc-finger family of transcription factors. Prog Nucleic Acid Res Mol Biol. 1995;50:191–224. doi: 10.1016/s0079-6603(08)60815-6. [DOI] [PubMed] [Google Scholar]
- 13.Lim CP, Jain N, Cao X. Stress-induced immediate-early gene, egr-1, involves activation of p38/JNK1. Oncogene. 1998;16:2915–2926. doi: 10.1038/sj.onc.1201834. [DOI] [PubMed] [Google Scholar]
- 14.Lejard V, Blais F, Guerquin MJ, Bonnet A, Bonnin MA, Havis E, Malbouyres M, Bidaud CB, Maro G, Gilardi-Hebenstreit P, Rossert J, Ruggiero F, Duprez D. EGR1 and EGR2 involvement in vertebrate tendon differentiation. J Biol Chem. 2011;286:5855–5867. doi: 10.1074/jbc.M110.153106. [DOI] [PMC free article] [PubMed] [Google Scholar]
- 15.Abdel-Malak NA, Mofarrahi M, Mayaki D, Khachigian LM, Hussain SN. Early growth response-1 regulates angiopoietin-1-induced endothelial cell proliferation, migration, and differentiation. Arterioscler Thromb Vasc Biol. 2009;29:209–216. doi: 10.1161/ATVBAHA.108.181073. [DOI] [PubMed] [Google Scholar]
- 16.Levkovitz Y, Baraban JM. A dominant negative inhibitor of the Egr family of transcription regulatory factors suppresses cerebellar granule cell apoptosis by blocking c-Jun activation. J Neurosci. 2001;21:5893–5901. doi: 10.1523/JNEUROSCI.21-16-05893.2001. [DOI] [PMC free article] [PubMed] [Google Scholar]
- 17.Pawlinski R, Pedersen B, Kehrle B, Aird WC, Frank RD, Guha M, Mackman N. Regulation of tissue factor and inflammatory mediators by Egr-1 in a mouse endotoxemia model. Blood. 2003;101:3940–3947. doi: 10.1182/blood-2002-07-2303. [DOI] [PubMed] [Google Scholar]
- 18.Yu X, Shen N, Zhang ML, Pan FY, Wang C, Jia WP, Liu C, Gao Q, Gao X, Xue B, Li CJ. Egr-1 decreases adipocyte insulin sensitivity by tilting PI3K/Akt and MAPK signal balance in mice. EMBO J. 2011;30:3754–3765. doi: 10.1038/emboj.2011.277. [DOI] [PMC free article] [PubMed] [Google Scholar]
- 19.Wu SY, Rupaimoole R, Shen F, Pradeep S, Pecot CV, Ivan C, Nagaraja AS, Gharpure KM, Pham E, Hatakeyama H, McGuire MH, Haemmerle M, Vidal-Anaya V, Olsen C, Rodriguez-Aguayo C, Filant J, Ehsanipour EA, Herbrich SM, Maiti SN, Huang L, Kim JH, Zhang X, Han HD, Armaiz-Pena GN, Seviour EG, Tucker S, Zhang M, Yang D, Cooper LJ, Ali-Fehmi R, Bar-Eli M, Lee JS, Ram PT, Baggerly KA, Lopez-Berestein G, Hung MC, Sood AK. A miR-192-EGR1-HOXB9 regulatory network controls the angiogenic switch in cancer. Nat Commun. 2016;7:11169. doi: 10.1038/ncomms11169. [DOI] [PMC free article] [PubMed] [Google Scholar]
- 20.Gaut L, Robert N, Delalande A, Bonnin MA, Pichon C, Duprez D. EGR1 regulates transcription downstream of mechanical signals during tendon formation and healing. PLoS One. 2016;11:e0166237. doi: 10.1371/journal.pone.0166237. [DOI] [PMC free article] [PubMed] [Google Scholar]
- 21.Wang FL, Connor JR, Dodds RA, James IE, Kumar S, Zou C, Lark MW, Gowen M, Nuttall ME. Differential expression of egr-1 in osteoarthritic compared to normal adult human articular cartilage. Osteoarthritis Cartilage. 2000;8:161–169. doi: 10.1053/joca.1999.0295. [DOI] [PubMed] [Google Scholar]
- 22.Rockel JS, Bernier SM, Leask A. Egr-1 inhibits the expression of extracellular matrix genes in chondrocytes by TNFalpha-induced MEK/ERK signalling. Arthritis Res Ther. 2009;11:R8. doi: 10.1186/ar2595. [DOI] [PMC free article] [PubMed] [Google Scholar]
- 23.Wu X, Cheng J, Li P, Yang M, Qiu S, Liu P, Du J. Mechano-sensitive transcriptional factor Egr-1 regulates insulin-like growth factor-1 receptor expression and contributes to neointima formation in vein grafts. Arterioscler Thromb Vasc Biol. 2010;30:471–476. doi: 10.1161/ATVBAHA.109.184259. [DOI] [PubMed] [Google Scholar]
- 24.Glasson SS, Chambers MG, Van Den Berg WB, Little CB. The OARSI histopathology initiative - recommendations for histological assessments of osteoarthritis in the mouse. Osteoarthritis Cartilage. 2010;18(Suppl 3):S17–23. doi: 10.1016/j.joca.2010.05.025. [DOI] [PubMed] [Google Scholar]
- 25.Fischer AH, Jacobson KA, Rose J, Zeller R. Hematoxylin and eosin staining of tissue and cell sections. CSH Protoc. 2008;2008 doi: 10.1101/pdb.prot4986. pdb.prot4986. [DOI] [PubMed] [Google Scholar]
- 26.Gosset M, Berenbaum F, Thirion S, Jacques C. Primary culture and phenotyping of murine chondrocytes. Nat Protoc. 2008;3:1253–1260. doi: 10.1038/nprot.2008.95. [DOI] [PubMed] [Google Scholar]
- 27.Ehrengruber MU, Muhlebach SG, Sohrman S, Leutenegger CM, Lester HA, Davidson N. Modulation of early growth response (EGR) transcription factor-dependent gene expression by using recombinant adenovirus. Gene. 2000;258:63–69. doi: 10.1016/s0378-1119(00)00445-5. [DOI] [PubMed] [Google Scholar]
- 28.Glasson SS, Askew R, Sheppard B, Carito B, Blanchet T, Ma HL, Flannery CR, Peluso D, Kanki K, Yang Z, Majumdar MK, Morris EA. Deletion of active ADAMTS5 prevents cartilage degradation in a murine model of osteoarthritis. Nature. 2005;434:644–648. doi: 10.1038/nature03369. [DOI] [PubMed] [Google Scholar]
- 29.Fu M, Zhang J, Lin Y, Zhu X, Ehrengruber MU, Chen YE. Early growth response factor-1 is a critical transcriptional mediator of peroxisome proliferator-activated receptor-gamma 1 gene expression in human aortic smooth muscle cells. J Biol Chem. 2002;277:26808–26814. doi: 10.1074/jbc.M203748200. [DOI] [PubMed] [Google Scholar]
- 30.Li L, Zhao LM, Dai SL, Cui WX, Lv HL, Chen L, Shan BE. Periplocin extracted from cortex periplocae induced apoptosis of gastric cancer cells via the ERK1/2-EGR1 pathway. Cell Physiol Biochem. 2016;38:1939–1951. doi: 10.1159/000445555. [DOI] [PubMed] [Google Scholar]
- 31.Trinh NT, Yamashita T, Ohneda K, Kimura K, Salazar GT, Sato F, Ohneda O. Increased expression of EGR-1 in diabetic human adipose tissue-derived mesenchymal stem cells reduces their wound healing capacity. Stem Cells Dev. 2016;25:760–773. doi: 10.1089/scd.2015.0335. [DOI] [PMC free article] [PubMed] [Google Scholar]
- 32.Chen Z, Yue SX, Zhou G, Greenfield EM, Murakami S. ERK1 and ERK2 regulate chondrocyte terminal differentiation during endochondral bone formation. J Bone Miner Res. 2015;30:765–774. doi: 10.1002/jbmr.2409. [DOI] [PMC free article] [PubMed] [Google Scholar]
- 33.Fujita T, Azuma Y, Fukuyama R, Hattori Y, Yoshida C, Koida M, Ogita K, Komori T. Runx2 induces osteoblast and chondrocyte differentiation and enhances their migration by coupling with PI3K-Akt signaling. J Cell Biol. 2004;166:85–95. doi: 10.1083/jcb.200401138. [DOI] [PMC free article] [PubMed] [Google Scholar]
- 34.Stricker S, Fundele R, Vortkamp A, Mundlos S. Role of Runx genes in chondrocyte differentiation. Dev Biol. 2002;245:95–108. doi: 10.1006/dbio.2002.0640. [DOI] [PubMed] [Google Scholar]
- 35.Doerks T, Copley RR, Schultz J, Ponting CP, Bork P. Systematic identification of novel protein domain families associated with nuclear functions. Genome Res. 2002;12:47–56. doi: 10.1101/gr.203201. [DOI] [PMC free article] [PubMed] [Google Scholar]
- 36.Komori T. Regulation of bone development and extracellular matrix protein genes by RUNX2. Cell Tissue Res. 2010;339:189–195. doi: 10.1007/s00441-009-0832-8. [DOI] [PubMed] [Google Scholar]
- 37.Inada M, Wang Y, Byrne MH, Rahman MU, Miyaura C, Lopez-Otin C, Krane SM. Critical roles for collagenase-3 (Mmp13) in development of growth plate cartilage and in endochondral ossification. Proc Natl Acad Sci U S A. 2004;101:17192–17197. doi: 10.1073/pnas.0407788101. [DOI] [PMC free article] [PubMed] [Google Scholar]
- 38.Hess J, Porte D, Munz C, Angel P. AP-1 and Cbfa/runt physically interact and regulate parathyroid hormone-dependent MMP13 expression in osteoblasts through a new osteoblast-specific element 2/AP-1 composite element. J Biol Chem. 2001;276:20029–20038. doi: 10.1074/jbc.M010601200. [DOI] [PubMed] [Google Scholar]
- 39.Vasheghani F, Monemdjou R, Fahmi H, Zhang Y, Perez G, Blati M, St-Arnaud R, Pelletier JP, Beier F, Martel-Pelletier J, Kapoor M. Adult cartilage-specific peroxisome proliferator-activated receptor gamma knockout mice exhibit the spontaneous osteoarthritis phenotype. Am J Pathol. 2013;182:1099–1106. doi: 10.1016/j.ajpath.2012.12.012. [DOI] [PubMed] [Google Scholar]
- 40.Zhou Y, Jia X, Zhou M, Liu J. Egr-1 is involved in the inhibitory effect of leptin on PPARgamma expression in hepatic stellate cell in vitro. Life Sci. 2009;84:544–551. doi: 10.1016/j.lfs.2009.01.018. [DOI] [PubMed] [Google Scholar]


