Abstract
The fact that one-quarter of Medicare spending in the United States occurs in the last year of life is commonly interpreted as waste. But this interpretation presumes knowledge of who will die when. Here, we analyze how spending is distributed by predicted mortality, based on a machine learning model of annual mortality risk built using Medicare claims. Death is highly unpredictable. Less than 5 percent of spending is accounted for by individuals with predicted mortality above 50 percent. The simple fact that we spend more on the sick—both on those who recover and those who die—accounts for 30 to 50 percent of the concentration of spending on the dead. Our results suggest we spend on the ex-post dead but not necessarily on the ex-ante “hopeless.”
One Sentence Summary:
The US spends a lot on people in the last year of life—but prospectively, high mortality risk people account for little spending.
Main Text:
Only 5 percent of Medicare beneficiaries in the United States die each year, but one-quarter of Medicare spending occurs in the last 12 months of life (1). This fact is frequently touted as evidence of obvious waste and inefficiency. For example, in the New Yorker we read that “for most people, death comes only after long medical struggle with an incurable condition—advanced cancer, progressive organ failure, or the multiple debilities of very old age. In all such cases, death is certain, but the timing isn’t” (2). Likewise, the New York Times asks, “Does it make sense that older adults in their last year of life consume more than a quarter of Medicare’s expenditures…? Are there limits to what Medicare should spend on a therapy prolonging someone’s life by a month or two?” (3). In this view, a large share of healthcare dollars is wasted on small marginal gains for those certain to die shortly (4, 5).
These common interpretations of end-of-life spending flirt with a statistical fallacy: those who end up dying are not the same as those who were sure to die. Ex post, spending could appear concentrated on the dead, simply because we spend more on sicker individuals who have higher mortality—even if we never spent money on those certain to die within the year.
Empirically this suggests using predicted mortality, rather than ex-post mortality, to assess end-of-life spending. To this end, we draw on rich data from a random sample of almost six million Medicare enrollees. We apply machine learning techniques to generate a prediction of each individual’s probability of death in the next 12 months. We then analyze spending by predicted mortality as well as by ex-post mortality.
The conceptual distinction between the ex-post dead and ex-ante dead has been noted previously (6, 7); see also (8) for early empirical analysis. Others have attempted to predict mortality in the Medicare population and have observed that substantial prognostic uncertainty is a challenge for medical care (9–12). Our study combines these themes and examines end-of-life spending from an ex-ante perspective.
We use Medicare claims data for a 20 percent random sample of enrollees. Our main analysis focuses on enrollees alive on January 1, 2008 and continuously enrolled in Medicare in 2007 and all months of 2008 in which they are alive. We observe age, gender, race, Medicaid coverage (a proxy for socio-economic status), all Medicare claims for inpatient care, outpatient care and physician services, and all recorded health diagnoses. The Supplementary Materials (13) (Section A) provide more details.
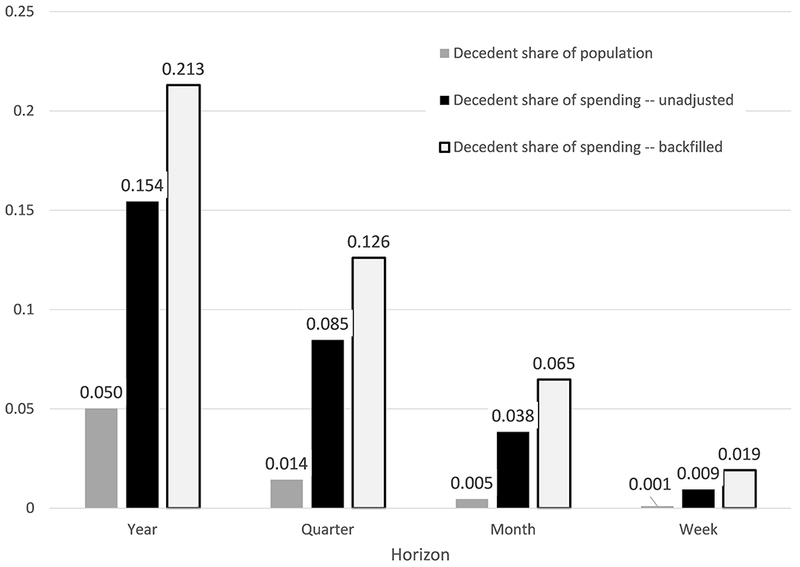
Figure 1 reproduces well-known facts about the concentration of spending at the end of life. We report results for two spending measures. The first – which we refer to as “backfilling” – follows the approach of the end-of-life literature (14). For survivors it measures spending over the relevant time interval from January 1, 2008 forward; for decedents it measures spending starting from the date of death in 2008 and going backward over the same length of time. Using this approach, we estimate that the 5 percent of Medicare beneficiaries who died accounted for 21 percent of Medicare spending, closely matching prior estimates (14).
Fig. 1.

Concentration of spending on the ex-post dead. Figure shows mortality rates and decedent share of total Medicare spending for various time intervals after January 1, 2008. Data are for the entire baseline sample (N=5,631,168). Spending for survivors is measured in the time interval since January 1, 2008. For decedents, we report two spending measures: “Backfilled” measures spending looking backwards from the date of death for the length of the relevant interval (for example for the one-year measure, we measure spending over the 12 months prior to death); “unadjusted” measures spending looking forward over the relevant time interval since January 1, 2008.
This standard analysis suffers from two related biases: we do not know who will die in a given time interval, or when within that interval they will die. We therefore also analyze what we refer to as “unadjusted spending” in which we measure spending on all individuals – both survivors and decedents – looking forward from January 1, 2008. Now the 5 percent of enrollees who die within the year account for only 15 percent of spending in that year. But even this analysis assumes we knew who will die in the next year, an assumption we now investigate.
Our baseline analysis generates annual mortality predictions from the vantage point of January 1, 2008, using data on enrollee demographics, healthcare utilization over the prior 12 months – including the level and nature of care and its trajectory – and health diagnoses and their trajectory over the prior 12 months. This produces thousands of potential predictors. We use an ensemble (of random forest, gradient boosting, and LASSO) – a standard and popular machine learning technique – to generate mortality predictions. To avoid over-fitting, we randomly split the data into a “training” subsample – where we develop the prediction algorithm – and a “test” subsample where we apply the resulting algorithm to generate predicted mortalities. All subsequent results are for this “test” subsample, which is one-third of our original sample. The Supplementary Materials (13) (Section B) describes in detail how we construct the potential mortality predictors and the prediction algorithm. It shows that predicted mortality varies in sensible ways with individual characteristics, and that our algorithm’s performance is comparable to other recent mortality prediction endeavors.
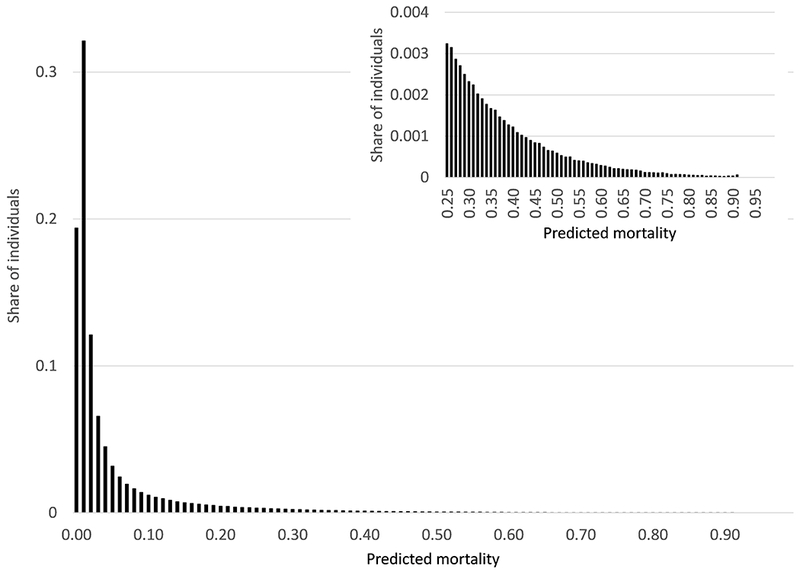
Figure 2 shows the distribution of annual mortality predictions and illustrates one of our key findings: there is no sizable mass of people for whom “death is certain” (or even near-certain) within the year. The 95th percentile of predicted annual mortality is only about 25 percent. Less than 10 percent of those who end up dying within the year have an annual mortality probability above 50 percent.
Fig. 2.

Distribution of predicted mortality. Figure shows distribution of predicted annual mortality from January 1, 2008. Data are from the test subsample (N=1,877,168).
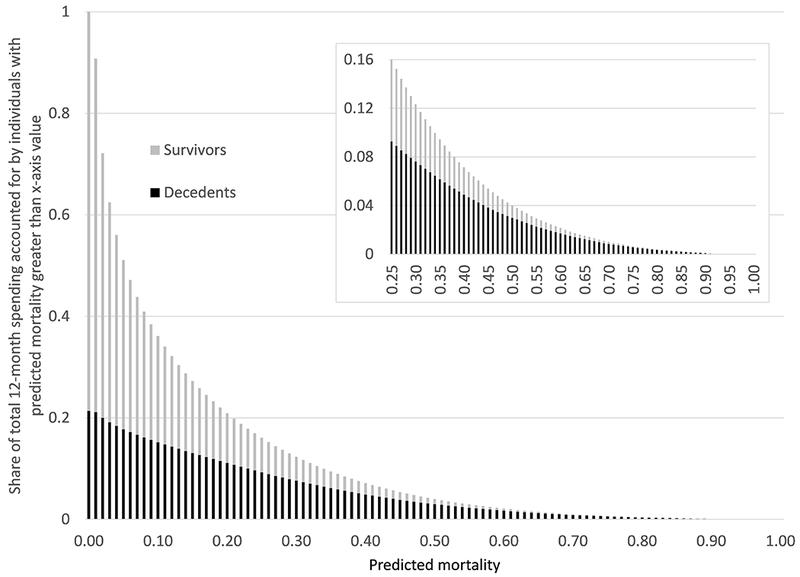
Figure 3 shows that, relatedly, individuals with high predicted mortality account for only a small share of total spending. For example, the highest risk percentile – those with predicted mortality above 46 percent – accounts for under 5 percent of total spending, and 45 percent of these individuals are survivors. In order to capture a group of decedents who account for at least 5 percent of total spending, we must set a threshold of predicted mortality of 39 percent or higher. These results are based on the “backfilled” measure of decedent spending; using the unadjusted measure, spending on decedents is even lower, so that a smaller share of spending above each mortality prediction threshold is accounted for by decedents.
Fig. 3.

Concentration of spending by ex-ante mortality. For each level of predicted annual mortality (x-axis), figure shows share of total annual Medicare spending accounted for by individuals with predicted mortality of that value or greater. Each bar stacks the share accounted for by decedents (black) and for survivors (gray), so that the height of the bar represents total annual Medicare spending accounted for by individuals (decedents and survivors) with predicted mortality of that value or greater. All results use the “backfilled” measure of decedent spending. All data are from the test subsample.
A natural question is whether these results could change if we had better predictions, for example using higher quality data such as electronic medical records. The available evidence, while limited, suggests that relative to using only (detailed) claims data, the incremental predictive power obtained from electronic medical records (15, 16) or subjective physician predictions (17, 18) is relatively small. Moreover, such data are arguably less relevant for national policy, which needs to be based on standardized, nationally available data.
There is also the possibility of better prediction algorithms. Indeed, some cutting edge machine learning papers (19, 20) do better in select patient groups. To study how a hypothetical, better predictor might plausibly affect our results, we produce an artificial ‘oracle’ predictor by adjusting predicted probabilities towards realized outcomes (i.e., increasing predictions for the dead and lowering them for survivors); our hypothetical “predictor” is thus a weighted average of our actual predictor and the realized outcome (death or not). If we put a weight of 0.1 on the realized outcome, this generates an AUC of 0.963 – a level of algorithm performance well above any in the literature – but our results do not qualitatively change: individuals with predicted mortality above 47 percent still only account for 5 percent of total spending. This happens because, at low baseline mortality rates (i.e. annual mortality rate of 5%), models can be extremely good at identifying those at high risk (i.e., AUC can be extremely high), but the highest percentiles can still have modest absolute rates of predicted mortality (e.g., under 50 percent). As a result, there is little concentration of spending on individuals with high absolute rates of predicted mortality. The Supplementary Materials (13) (Section C) provide more details
Nor do our conclusions change when we view the prediction task from an arguably more “decision relevant” time point: when potentially costly medical treatment decisions are made, at hospital admission. In the Supplementary Materials (13) (Section D) we re-estimate the prediction algorithm to generate 12-month mortality predictions at the time of hospital admission for the subsample of individuals admitted to the hospital during 2008. We use the same predictors – now measured in the 12 months prior to admission – as well as the admitting diagnosis. Even from the vantage point of admission to the hospital – where annual mortality is about 20 percent – the 95th percentile of annual death probabilities is still only 67 percent. Less than 4 percent of those who end up dying in the subsequent year have a predicted mortality above 80 percent at the time of admission. Even if we zoom in further on the sub-sample who enters the hospital with metastatic cancer – 63 percent die over the subsequent 12 months, but they account for only 7 percent of annual Medicare deaths – we find that only 12 percent of decedents have an annual predicted mortality of more than 80 percent. Qualitatively similar findings hold if we look at mortality in the month – rather than year - after hospital admission.
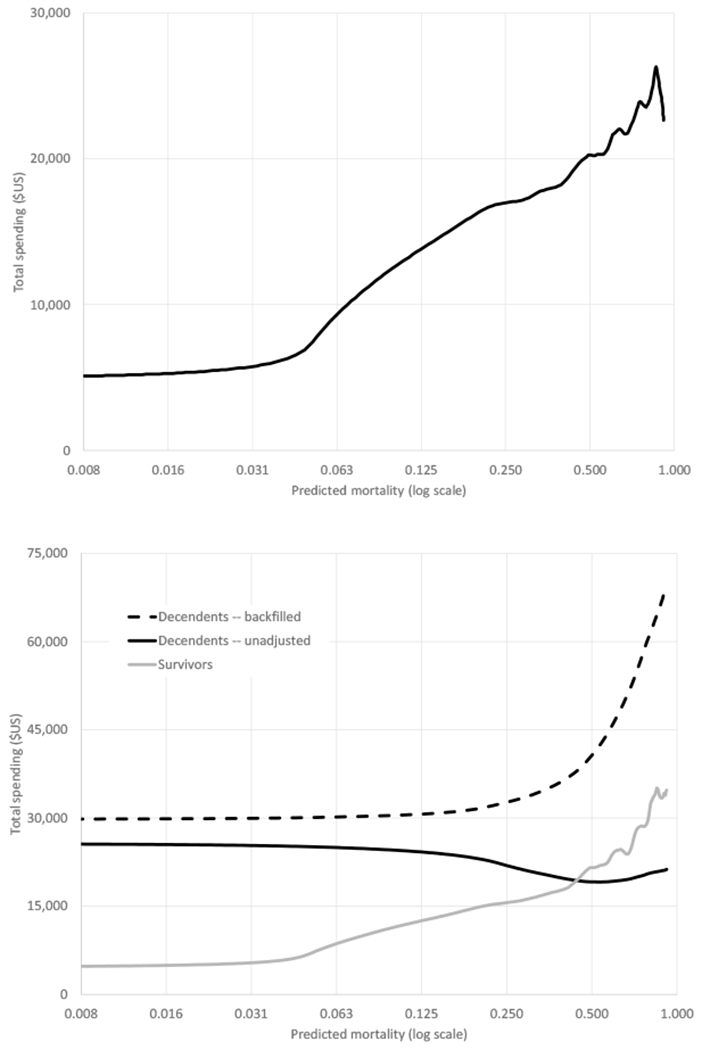
Figure 4 shows the distribution of spending by predicted mortality and illustrates another key finding: a large share of the concentration of spending at the end of life can be explained by the concentration of spending on the sick. Decedents have higher predicted mortality than survivors and, as the top panel of Figure 4 shows, spending is increasing in predicted mortality. This simple observation goes a long way toward explaining the concentration of spending at the ex-post end of life.
Fig. 4.

Spending by predicted mortality (log scale). Top panel shows kernel density of total Medicare spending in the 12 months after January 1, 2008, against predicted annual mortality (log scale). Bottom panel presents kernel density of Medicare spending separately for survivors and decedents. Spending measures are as defined in Fig. 1. All data are from the test subsample.
The bottom panel of Figure 4 shows the relationship between spending and predicted mortality separately for subsequent decedents and survivors. Using these estimates, we find that survivors randomly sampled from the decedents’ distribution of predicted mortality spend about twice as much as a randomly sampled survivor. As a result, 30 to 50 percent of the concentration of spending on decedents relative to survivors would be eliminated (depending on whether the unadjusted or backfilled spending measure was used), simply by accounting for the fact that spending is higher on those with higher mortality risk. The Supplementary Materials (13) (Section E) provide more details.
However, the bottom panel of Figure 4 also shows that even for individuals with the same predicted mortality probability, spending is elevated for those who subsequently die, particularly for individuals with the lowest predicted mortality. This may be because of ex-ante differences across patients that our current prediction algorithm does not incorporate, or it may be related to the process by which individuals die or even the basic mechanics of death. More work is needed to fully understand why death remains expensive, even conditional on mortality risk.
In sum, although spending on the ex-post dead is very high, we find there are only few individuals for whom, ex-ante, death is near-certain. Moreover, a substantial component of the concentration of spending at the end of life is mechanically driven by the fact that those who end up dying are sicker, and spending, naturally, is higher for sicker individuals. Of course, we do not – and cannot – rule out individual cases where treatment is performed on an individual for whom death is near-certain. But our findings indicate that such individuals are not a meaningful share of decedents.
These findings suggest that a focus on “end-of-life spending” is not, by itself, a useful way to identify wasteful spending. Instead, researchers must engage in the challenging but important work of identifying the impact of specific healthcare interventions and procedures on survival rates, and on the quality of life for very sick patients; such research should focus not just on averages but also on potentially heterogeneous impacts across different individuals (21–23).
Supplementary Material
Acknowledgments
We are grateful to Paul Friedrich, Diego Hernandez, Alex Olssen, and Andelyn Russell for superb research assistance, and to Jonathan Skinner, Heidi Williams, participants in the Stanford brown bag lunch, and participants in the NBER Aging conference for helpful comments.
Funding: Einav and Finkelstein gratefully acknowledge support from the National Institute on Aging (R01 AG032449) and Obermeyer acknowledges support from the Office of the Director of National Institutes of Health (DP5 OD012161) and the National Institute for Health Care Management.
Footnotes
Author contributions: All authors participated in design of the study, analysis and interpretation of data, and the drafting and critical revision of the manuscript.
Competing interests: Authors declare no competing interests.
Data and materials availability: The data used in this paper can be accessed through a standard application process described here: http://www.resdac.org. Analysis code is available at http://web.stanford.edu/~leinav/pubs/Science2018_Programs.zip
Supplementary Materials:
Materials and Methods
Figures S1-S9
Tables S1-S6
References (24-41)
References and Notes:
- 1.Riley GF, Lubitz JD, Long-Term Trends in Medicare Payments in the Last Year of Life. Health Serv Res 45, 565–576 (2010). [DOI] [PMC free article] [PubMed] [Google Scholar]
- 2.Gawande A, Go Letting. The New Yorker (2010), (available at https://www.newyorker.com/magazine/2010/08/02/letting-go-2).
- 3.Porter E, Rationing Health Care More Fairly. The New York Times (2012), (available at https://www.nytimes.com/2012/08/22/business/economy/rationing-health-care-more-fairly.html). [Google Scholar]
- 4.Emanuel EJ, Emanuel LL, The Economics of Dying -- The Illusion of Cost Savings at the End of Life. N Engl J Med 330, 540–544 (1994). [DOI] [PubMed] [Google Scholar]
- 5.Medicare Payment Advisory Commission, “Report to Congress : Select Medicare Issues -- Improving Care at the End of Life” (1991).
- 6.Scitovsky AA, “The High Cost of Dying”: What Do the Data Show? Milbank Q 83, 825–841 (2005). [DOI] [PMC free article] [PubMed] [Google Scholar]
- 7.Newhouse JP, An iconoclastic view of health cost containment. Health Aff (Millwood). 12 Suppl, 152–171 (1993). [DOI] [PubMed] [Google Scholar]
- 8.Detsky AS, Stricker SC, Mulley AG, Thibault GE, Prognosis, survival, and the expenditure of hospital resources for patients in an intensive-care unit. N. Engl. J. Med 305, 667–672 (1981). [DOI] [PubMed] [Google Scholar]
- 9.Desai MM, Bogardus ST, Williams CS, Vitagliano G, Inouye SK, Development and validation of a risk-adjustment index for older patients: the high-risk diagnoses for the elderly scale. J Am Geriatr Soc 50, 474–481 (2002). [DOI] [PubMed] [Google Scholar]
- 10.Gagne JJ, Glynn RJ, Avorn J, Levin R, Schneeweiss S, A combined comorbidity score predicted mortality in elderly patients better than existing scores. J Clin Epidemiol 64, 749–759 (2011). [DOI] [PMC free article] [PubMed] [Google Scholar]
- 11.Makar M, Ghassemi M, Cutler DM, Obermeyer Z, Short-term Mortality Prediction for Elderly Patients Using Medicare Claims Data. Int J Mach Learn Comput 5, 192–197 (2015). [DOI] [PMC free article] [PubMed] [Google Scholar]
- 12.Yourman LC, Lee SJ, Schonberg MA, Widera EW, Smith AK, Prognostic indices for older adults: a systematic review. JAMA. 307, 182–192 (2012). [DOI] [PMC free article] [PubMed] [Google Scholar]
- 13.Einav L, Finkelstein A, Mullainathan S, Obermeyer Z, Supplementary Materials to: Predictive modeling of US healthcare spending in late life. [DOI] [PMC free article] [PubMed]
- 14.Hogan C, Lunney J, Gabel J, Lynn J, Medicare beneficiaries’ costs of care in the last year of life. Health Aff (Millwood). 20, 188–195 (2001). [DOI] [PubMed] [Google Scholar]
- 15.Inouye SK et al. , Burden of illness score for elderly persons: risk adjustment incorporating the cumulative impact of diseases, physiologic abnormalities, and functional impairments. Med Care. 41, 70–83 (2003). [DOI] [PubMed] [Google Scholar]
- 16.Zeltzer D et al. , Prediction Accuracy with Electronic Medical Records versus Administrative Claims Data (under review). [DOI] [PubMed]
- 17.Glare P et al. , A systematic review of physicians’ survival predictions in terminally ill cancer patients. BMJ. 327, 195–198 (2003). [DOI] [PMC free article] [PubMed] [Google Scholar]
- 18.Lakin JR et al. , Estimating 1-Year Mortality for High-Risk Primary Care Patients Using the “Surprise” Question. JAMA Intern Med 176, 1863–1865 (2016). [DOI] [PMC free article] [PubMed] [Google Scholar]
- 19.Elfiky A, Pany M, Parikh R, Obermeyer Z, A machine learning approach to predicting short-term mortality risk in patients starting chemotherapy. bioRxiv, 204081 (2017). [DOI] [PMC free article] [PubMed]
- 20.Rajkomar A et al. , Scalable and accurate deep learning for electronic health records. arXiv:1801.07860[cs] (2018). [DOI] [PMC free article] [PubMed]
- 21.Aldridge MD, Kelley AS, The Myth Regarding the High Cost of End-of-Life Care. Am J Public Health. 105, 2411–2415 (2015). [DOI] [PMC free article] [PubMed] [Google Scholar]
- 22.Kelley AS et al. , Identifying Older Adults with Serious Illness: A Critical Step toward Improving the Value of Health Care. Health Serv Res 52, 113–131 (2017). [DOI] [PMC free article] [PubMed] [Google Scholar]
- 23.Kelley AS, Bollens-Lund E, Covinsky KE, Skinner JS, Morrison RS, Prospective Identification of Patients at Risk for Unwarranted Variation in Treatment. J Palliat Med 21, 44–54 (2018). [DOI] [PMC free article] [PubMed] [Google Scholar]
- 24.How to Identify Hospital Claims for Emergency Room Visits in the Medicare Claims Data | ResDAC, (available at https://www.resdac.org/resconnect/articles/144).
- 25.Tabak YP, Sun X, Nunez CM, Johannes RS, Using electronic health record data to develop inpatient mortality predictive model: Acute Laboratory Risk of Mortality Score (ALaRMS). Journal of the American Medical Informatics Association. 21, 455–463 (2014). [DOI] [PMC free article] [PubMed] [Google Scholar]
- 26.Silva Á, Cortez P, Santos MF, Gomes L, Neves J, Mortality assessment in intensive care units via adverse events using artificial neural networks. Artificial Intelligence in Medicine. 36, 223–234 (2006). [DOI] [PubMed] [Google Scholar]
- 27.Pope GC et al. , Risk Adjustment of Medicare Capitation Payments Using the CMS-HCC Model. Health Care Financ Rev 25, 119–141 (2004). [PMC free article] [PubMed] [Google Scholar]
- 28.Pozzolo AD, Caelen O, Johnson RA, Bontempi G, in 2015 IEEE Symposium Series on Computational Intelligence (2015), pp. 159–166. [Google Scholar]
- 29.Finkelstein A, Gentzkow M, Hull P, Williams H, Adjusting Risk Adjustment – Accounting for Variation in Diagnostic Intensity. N Engl J Med 376, 608–610 (2017). [DOI] [PMC free article] [PubMed] [Google Scholar]
- 30.Avati A et al. , Improving Palliative Care with Deep Learning. arXiv:1711.06402 [cs, stat] (2017) (available at http://arxiv.org/abs/1711.06402). [DOI] [PMC free article] [PubMed]
- 31.Finkelstein A, Gentzkow M, Williams H, Sources of Geographic Variation in Health Care: Evidence From Patient Migration*. The Quarterly Journal of Economics. 131, 1681–1726 (2016). [DOI] [PMC free article] [PubMed] [Google Scholar]
- 32.Song Y et al. , Regional Variations in Diagnostic Practices. N Engl J Med 363, 45–53 (2010). [DOI] [PMC free article] [PubMed] [Google Scholar]
- 33.Pirracchio R et al. , Mortality prediction in the ICU: can we do better? Results from the Super ICU Learner Algorithm (SICULA) project, a population-based study. Lancet Respir Med 3, 42–52 (2015). [DOI] [PMC free article] [PubMed] [Google Scholar]
- 34.Genevès P et al. , Predicting At-Risk Patient Profiles from Big Prescription Data (2017) (available at https://hal.inria.fr/hal-01517087v4).
- 35.Awad A, Bader-El-Den M, McNicholas J, Briggs J, Early hospital mortality prediction of intensive care unit patients using an ensemble learning approach. International Journal of Medical Informatics. 108, 185–195 (2017). [DOI] [PubMed] [Google Scholar]
- 36.Agency for Healthcare Research and Quality, Clinical Classifications Software (CCS) for ICD-9-CM. Healthcare Cost and Utilization Project (HCUP) (2017). [PubMed] [Google Scholar]
- 37.Downloads - Dartmouth Atlas of Health Care, ZIP Code Crosswalks, (available at http://www.dartmouthatlas.org/tools/downloads.aspx?tab=39).
- 38.Dartmouth Atlas of Health Care, Appendix on the Geography of Health Care in the United States, (available at http://www.dartmouthatlas.org/downloads/methods/geogappdx.pdf).
- 39.Categories Condition - Chronic Conditions Data Warehouse, (available at https://www.ccwdata.org/web/guest/condition-categories).
- 40.Methods Research. The Dartmouth Atlas of Health Care, (available at http://www.dartmouthatlas.org/downloads/methods/research_methods.pdf).
- 41.French EB et al. , End-Of-Life Medical Spending In Last Twelve Months Of Life Is Lower Than Previously Reported. Health Affairs. 36, 1211–1217 (2017). [DOI] [PubMed] [Google Scholar]
Associated Data
This section collects any data citations, data availability statements, or supplementary materials included in this article.


