Abstract
Purpose
To evaluate foveal function in patients with inherited retinal degenerations (IRD) by measuring visual acuity (VA) after correction of higher-order aberrations.
Methods
Adaptive optics scanning laser ophthalmoscopy (AOSLO) was used to image cones in 4 healthy subjects and 15 patients with IRD. The 840-nm scanning laser delivered an “E” optotype to measure AOSLO-mediated VA (AOSLO-VA). Cone spacing was measured at the preferred retinal locus by two independent graders and the percentage of cones below the average density of 47 age-similar healthy subjects was computed. Cone spacing was correlated with best-corrected VA measured with the Early Treatment of Diabetic Retinopathy Study protocol (ETDRS-VA), AOSLO-VA, and foveal sensitivity.
Results
ETDRS-VA significantly correlated with AOSLO-VA (ρ = 0.79, 95% confidence interval [CI] 0.5–0.9). Cone spacing correlated with AOSLO-VA (ρ = 0.54, 95% CI 0.02–0.7), and negatively correlated with ETDRS letters read (ρ = −0.64, 95% CI −0.8 to −0.2). AOSLO-VA remained ≥20/20 until cones decreased to 40.2% (CI 31.1–45.5) below normal. Similarly, ETDRS-VA remained ≥20/20 until cones were 42.0% (95% CI 36.5–46.1) below normal. Cone spacing z scores negatively correlated with foveal sensitivity (ρ = −0.79, 95% CI −0.9 to −0.4) and foveal sensitivity was ≥35 dB until cones were 43.1% (95% CI 39.3–46.6) below average.
Conclusions
VA and foveal cone spacing were weakly correlated until cones were reduced by 40% to 43% below normal. The relationship suggests that VA is an insensitive measure of foveal cone survival; cone spacing may be a more sensitive measure of cone loss.
Keywords: adaptive optics, visual acuity, cone photoreceptors, inherited retinal degeneration
The fovea is the most important retinal region for human vision, yet its structure and function remain difficult to evaluate clinically. Cone photoreceptors at the fovea are difficult to resolve, even with adaptive optics, owing to their tight packing1 and the limits in resolution imposed by diffraction.2 Decline in visual performance at the fovea (measured as visual acuity [VA] and foveal sensitivity) may remain undetected even after extensive cone loss.3,4 Our previous study of patients with inherited retinal degenerations (IRDs) showed that, despite a significant correlation between VA and foveal sensitivity with foveal cone spacing, the relationship was both noisy and nonlinear.4 As such, standardized Early Treatment of Diabetic Retinopathy Study (ETDRS) Snellen acuity measures did not drop below normal levels (<20/25) and foveal sensitivities remained normal (≥35 dB) until, on average, foveal cone density was 62% and 52% below normal, respectively.4 Although preservation of foveal function is a beneficial adaptation for human vision, it limits the prospects for using subjective functional tests like ETDRS to gauge foveal health. Functional deficits may manifest only after irreversible structural changes have already occurred. Consequently, these same subjective functional tests cannot serve as sensitive methods to monitor the effects of treatments that aim to slow, stop, or reverse retinal degeneration.5
Structural indicators of foveal retinal health are also fraught with problems, even those that use adaptive optics. The small size of foveal cones makes them difficult to count, especially in images of patients who present additional challenges to imaging, including disease-associated cataracts, age-related cataracts, fixation instability, and lack of experience as a subject in advanced imaging systems. Even if foveal cones can be counted and tracked over time, not all visible cones may be functional. Finally, the lack of visible cones in an image does not necessarily imply a lack of function.6,7
The need for improved tests of retinal function is widely recognized, not only for improved measures of VA8–11 but also perimetry,12–14 cone directionality (Stiles-Crawford effect),15,16 foveal thresholds,17 and contrast sensitivity.18–20 In our previous report,4 we proposed several reasons why VA was not a sensitive indicator of early cone loss. First, because foveal cones generally oversample the retinal image, VA may be limited by a ceiling effect imposed by the eye's optics and higher-level neural factors.21 Second, fixational eye movements have been shown to improve acuity, even at the finest level.22,23
To address the optical limitations described above, we have developed Adaptive Optics Scanning Laser Ophthalmoscopy (AOSLO)-mediated functional testing capabilities. Adaptive optics removes blur in the retinal image caused by the eye's aberrations.24
If the lack of sensitivity to early cone loss that we reported in the previous study is due to an optical ceiling effect, then AOSLO-mediated acuity ought to yield a stronger correlation. Indeed, visual performance, including VA, is improved in young, healthy individuals using adaptive optics,21,25,26 although the benefit is less evident in myopic subjects21 and is improved with practice.27 In the current study, we used AOSLO-mediated acuity (without eye-motion correction) to test VA as a function of cone spacing in a cohort of patients with IRD. We included additional structural (optical coherence tomography [OCT] measures of cone outer segment length) and functional (foveal sensitivity) tests. If correcting the eye's aberrations improves the correlation between VA and cone spacing, then the addition of AOSLO-mediated acuity to AOSLO imaging could enhance our ability to evaluate the fovea in health and disease.
Methods
Study Design
Research procedures followed the tenets of the Declaration of Helsinki. Informed consent was obtained from all subjects. The study protocol was approved by the institutional review boards of the University of California, San Francisco, and the University of California, Berkeley.
Subjects
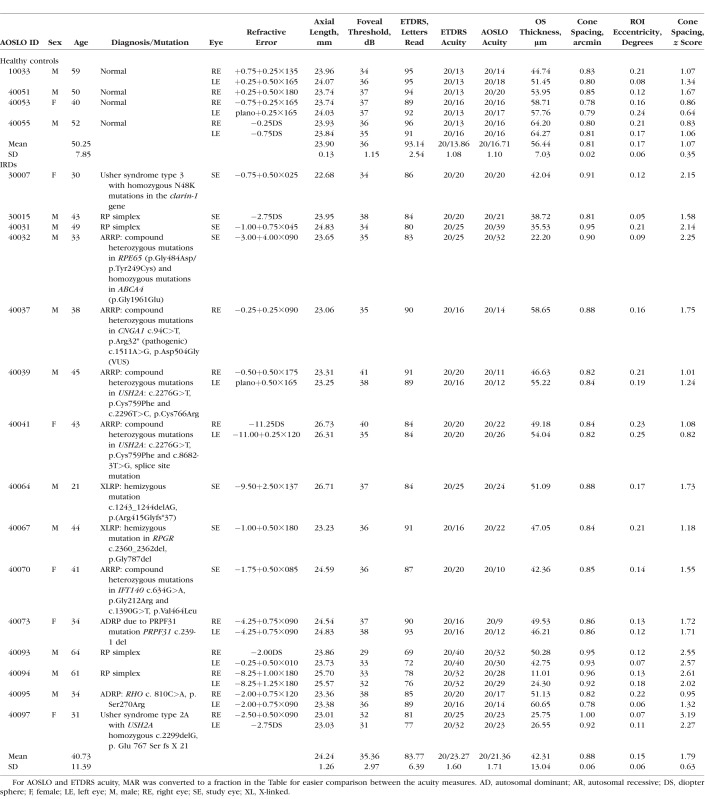
Seven eyes of four healthy subjects with normal eye examinations from unrelated families (one female, three male) with an average age of 50.25 years (SD 7.85) were used as controls; healthy subjects did not undergo genetic testing. Twenty-two eyes from 15 patients (5 female and 10 male) with an average age of 40.73 years (SD 11.39) with IRD from 15 unrelated families were clinically characterized (Table). Patients were excluded if they had conditions that could affect VA, including cataract, amblyopia, and cystoid macular edema involving the fovea. Seven participants were enrolled in a clinical trial of an experimental treatment that was administered to only one eye; with the fellow eye receiving a sham treatment. Sham-treated eyes from these seven patients were used as the study eyes for this article. For one subject (40037) with autosomal recessive retinitis pigmentosa (ARRP), the eye with better VA was chosen as the study eye. All eyes selected for this study had unambiguous cones within 0.5 degrees of the preferred retinal locus (PRL) and steady fixation. Genetic testing was performed on patients with X-linked RP, autosomal dominant RP, and Usher syndrome type 2 through the eyeGENE research consortium,28 on patients with ARRP through a research protocol29 or using a next-generation sequencing panel on a fee-for-service basis (retinal dystrophy panel of 181 genes; Blueprint Genetics, San Francisco, CA, USA), and Usher syndrome type 3 on a fee-for-service basis by the Carver nonprofit genetic testing laboratory (Iowa City, IA, USA).30
Table.
Clinical Characteristics of Healthy Subjects and Patients With IRD
Clinical Examination
A standard illuminated eye chart was used to measure best-corrected VA (BCVA) according to the ETDRS protocol.31 Although VA can be specified using different scales, a common measure is the minimal angle of resolution (MAR),31,32 and in this study, measures of ETDRS were specified in MAR, computed into decimal form by dividing the denominator by the numerator of the VA fraction. We also displayed these data as the number of letters read on the ETDRS chart to retain consistency and comparability with the previous study.4
Perimetry Measurements
Automated perimetry (Humphrey Visual Field Analyzer HFA II 750–6116–12.6; Carl Zeiss Meditec, Inc., Dublin, CA, USA) using a 10-2 Swedish interactive threshold algorithm was used to measure foveal thresholds. A Goldmann III stimulus was presented on a white background (10.03 cd/m2) with exposure duration of 200 ms. Foveal sensitivity was displayed in decibel scale (dB).
Cross-Sectional Thickness Measurements
Cross-sectional measures of retinal thickness at the fovea were acquired from 20-degree horizontal and vertical spectral-domain OCT (SD-OCT; Spectralis HRA+OCT system [Heidelberg Engineering, Vista, CA, USA]) B-scans through the fovea. SD-OCT B-scans were segmented using custom software as previously described33–37 to calculate inner and outer segment thickness (Igor Pro 7; WaveMetrics, Lake Oswego, OR, USA) at 0.1-degree locations along the scans.38
AOSLO-Mediated VA
Before AOSLO imaging, eyes were dilated with 1.0% tropicamide and 2.5% phenylephrine. High-resolution images of the cone mosaic within 0.5 degree of the PRL were obtained using AOSLO (“Region of Interest [ROI] Eccentricity,” Table). The “E” optotype was introduced onto the retina by modulating the 840-nm scanning laser to project sharp, black letters against a red background.2 The letter E was presented for 1 second (30 frames) during each trial oriented in one of four directions: left, right, up, or down. The subjects reported the orientation of the E using a keyboard. Two correct responses in succession elicited an E of decreased size (reduced by 1.4 times), whereas one incorrect response prompted the appearance of an E that increased in size (increased by 1.4 times) in the next trial. Following seven complete reversals, the experiment terminated. The value of the final threshold was calculated by averaging the stimulus size of the last four reversals. Each subject repeated the experiment six times, and the average threshold per experiment was converted to generate a standard MAR acuity value. This one-up/two-down procedure usually converged to 70.7% correct performance.39 AOSLO-VA measures required an additional 15 to 20 minutes per eye to complete these repetitions.
AOSLO Image Procurement and Cone Spacing and Density Analysis
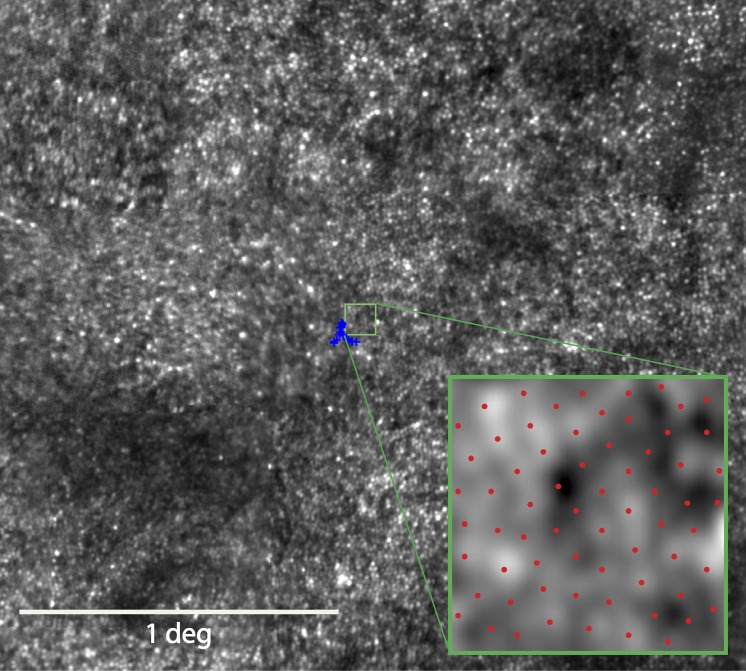
Montages of the macular region of the AOSLO images were created as described.40 To identify the PRL, a 10- to 15-second video was recorded as the subject observed a small circular fixation target delivered through modulation of the AOSLO scanning raster, the location of which was directly recorded in the AOSLO video. Using custom image analysis tools created with MATLAB (The MathWorks, Inc., Natick, MA, USA), the mean and SD of locations of fixation points in both horizontal and vertical directions were documented. To quantify cone spacing measures, a density recovery profile method41 was used as described previously.40 We chose this method to estimate cone spacing because it allows for reliable estimates of cone spacing in mosaics in which not every cone is visible and it remains a meaningful and robust metric even when the cones are no longer close-packed into a hexagonal lattice. Other measures of cone spacing, such as nearest neighbor distance or row-to-row spacing, are linearly related, and so whatever correlations are found with one metric will be essentially the same for the others. Cone locations were measured as eccentricity in degrees from the PRL. Cone spacing was measured as close as possible to the PRL center by two independent graders within a standardized 0.1-degree2 (42 × 42 pixel) box (Fig. 1); the intraclass correlation coefficient (ICC) for the two graders was 0.49 (95% CI 0.3–0.7). Given the small numbers of subjects, the mean absolute deviation was compared with the mean of all cone spacing measures. The overall mean absolute difference was 0.05 with a corresponding overall mean measurement cone spacing value of 0.87. The mean absolute difference divided by the mean measurement value was approximately 6% of the average cone spacing value. The measure calculated by each grader was averaged to derive the mean cone spacing at each ROI for correlation analyses. Due to the increase in photoreceptor density approaching the foveal center (mean eccentricity, 0.16 degree; maximum eccentricity, 0.24 degree), where abrupt changes in cone spacing would impact the results, cone spacing measures were converted to z scores (SDs from normal spacing), which are expected to be more uniform across the foveal region. Z scores were based on mean cone spacing at the measured eccentricity calculated from a larger normal data set42 composed of 10 controls (4 male, 6 female) between ages 25 and 58 (average 45.2 years, SD 10.3 years); normal z scores were between −2 and 2.
Figure 1.
AOSLO image of 43-year-old male with RP simplex (30015). The blue crosses indicate the fixation locus, and its centroid was used to determine the PRL for fixation. The green box outlines the ROI selected for cone spacing analysis. Inset: Magnified view of the ROI with red dots indicating the selected cone locations.
Data Analysis and Statistics
All cone spacing measurements were correlated with ETDRS-VA, AOSLO-mediated VA, and foveal sensitivity. Correlations between parameters were assessed using the Spearman rank correlation coefficient ρ, and a bootstrap analysis clustered by patient to account for the fact that one eye was used in some subjects and both eyes were used in others was used to derive the 95% confidence interval (CI) values. Statistical significance was determined using the 95% CIs. The percentage of cones below average was computed to indicate the difference in cone density from the average of 47 healthy subjects, as described in our previous study.4 The percentage of cone loss needed to reach performance scores below specified thresholds, for example, below a MAR of 1.0 (20/20 VA) are indicated by the red and blue lines on Figures 4B, 5B, and 6B, and were computed from a quadratic curve fitting that was then bootstrapped to obtain the 95% bias-corrected/accelerated CIs.
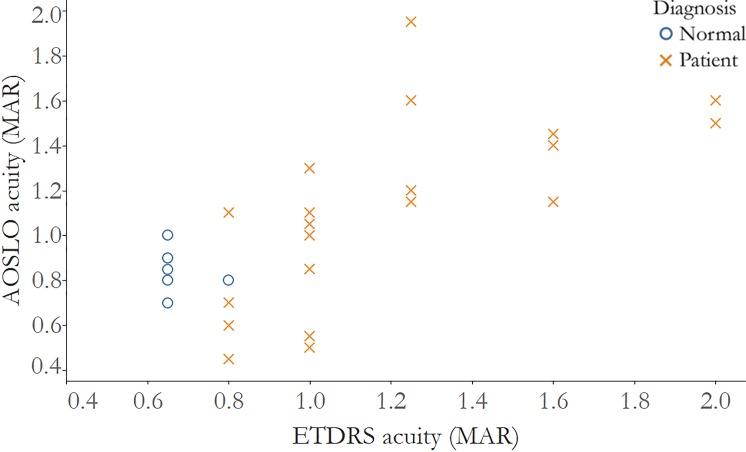
Figure 2.
Visual acuity measured after correction with AOSLO is significantly correlated with visual acuity measured using ETDRS charts. Correlation of ETDRS MAR acuity and AOSLO acuity, normal subjects: r = −0.33, 95% CI: −1.0 to 0.3; IRD patients: r = 0.79, 95% CI: 0.5 to 0.9. Normal subjects: blue circles; IRD patients: red Xs.
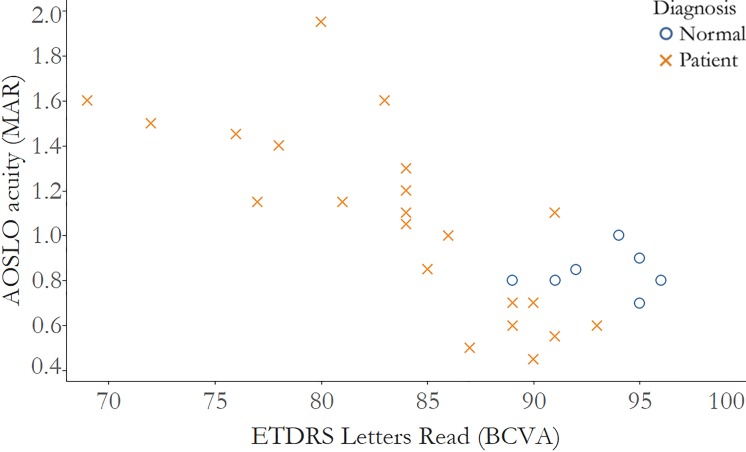
Figure 3.
Visual acuity measured after correction with AOSLO is significantly correlated with visual acuity measured with numbers of letters read using ETDRS charts. Correlation of acuity measured as letters read on the ETDRS chart and AOSLO acuity measured as MAR, normal subjects: r = −0.02, 95% CI: −0.9 to 1.0; IRD patients: r = −0.84, 95% CI: −0.9 to −0.6. Normal subjects: blue circles; IRD patients: red Xs.
Figure 4.
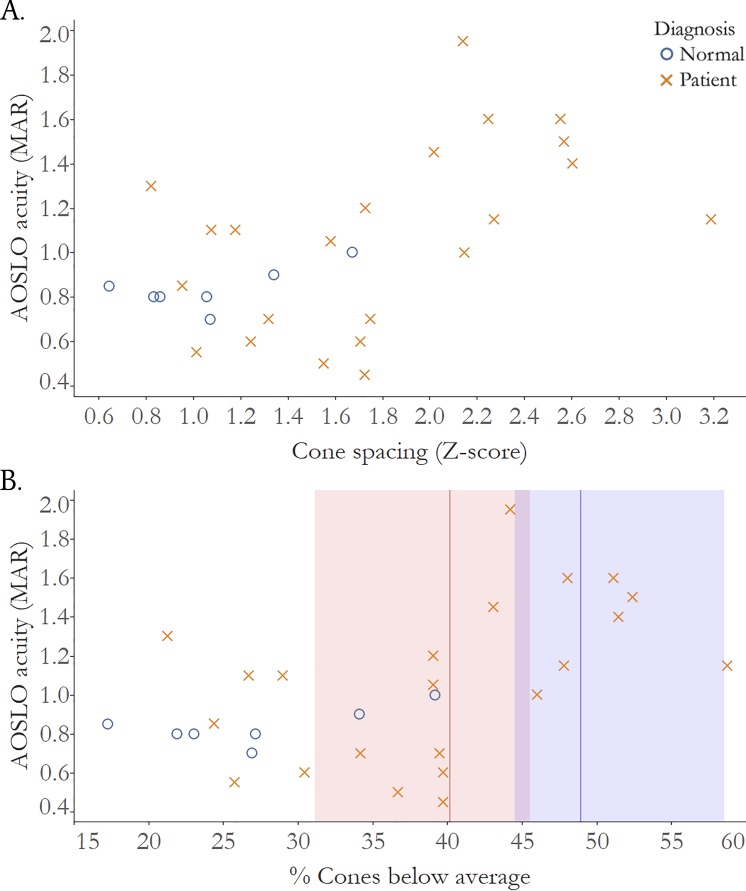
Visual acuity measured after correction with AOSLO is significantly correlated with cone loss measured as increased cone spacing z score. (A) Correlation of cone spacing z scores and AOSLO acuity, normal subjects: r = 0.37, 95% CI: −0.8 to 1.0; IRD patients: r = 0.54, 95% CI: 0.02 to 0.7. (B) Correlation of % cones below average and AOSLO acuity; red line: threshold percent cone loss where vision drops below normal MAR >1.00 (20/20 VA): 40.2%, red shading: 95% CI: 31.1 to 45.5; blue line: threshold percent cone loss where vision drops below normal MAR >1.25 (20/25 VA): 48.9%, blue shading: 95% CI: 44.5 to 58.6. Normal subjects: blue circles; IRD patients: red Xs.
Figure 5.
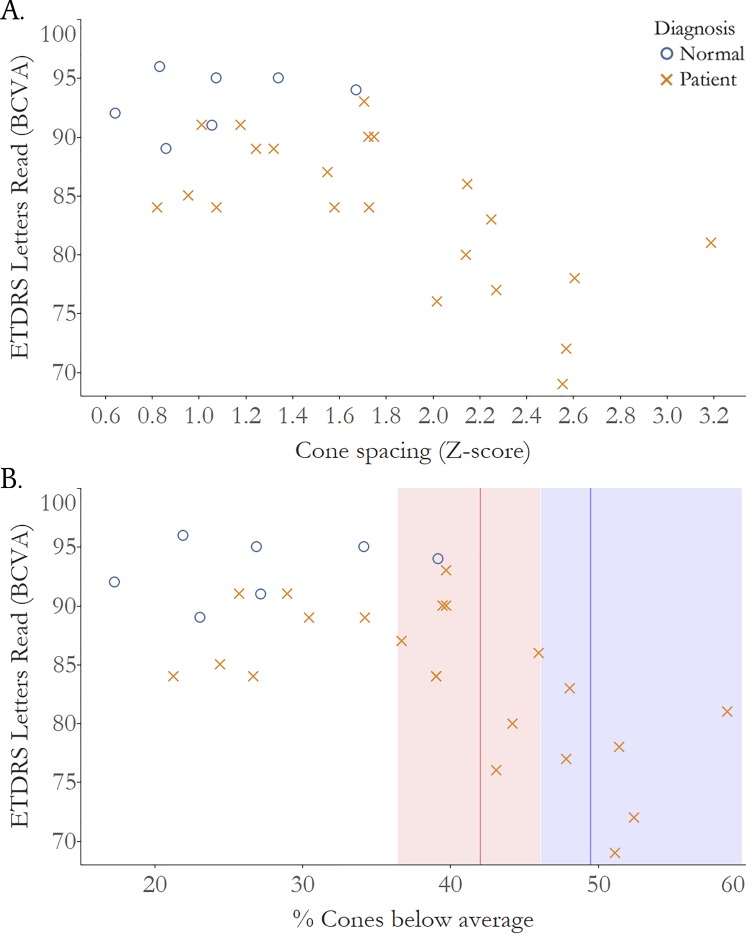
Visual acuity measured using standardized eye charts according to the ETDRS protocol is significantly correlated with cone loss measured as increased cone spacing z score. (A) Correlation of cone spacing z scores and ETDRS acuity, normal subjects: r = 0.16, 95% CI: −1.0 to 0.8; IRD patients: r = −0.64, 95% CI: −0.8 to −0.2. (B) Correlation of % cones below average and ETDRS acuity, red line: threshold percent cone loss where vision drops below normal <85 letters (20/20 VA): 42.0%, red shading: 95% CI: 36.5 to 46.1; blue line: threshold percent cone loss where vision drops below normal <80 Letters (20/25 VA): 49.5%, blue shading: 95% CI: 46.2 to 59.7. BCVA, best corrected visual acuity; normal subjects: blue circles; IRD patients: red Xs.
Figure 6.
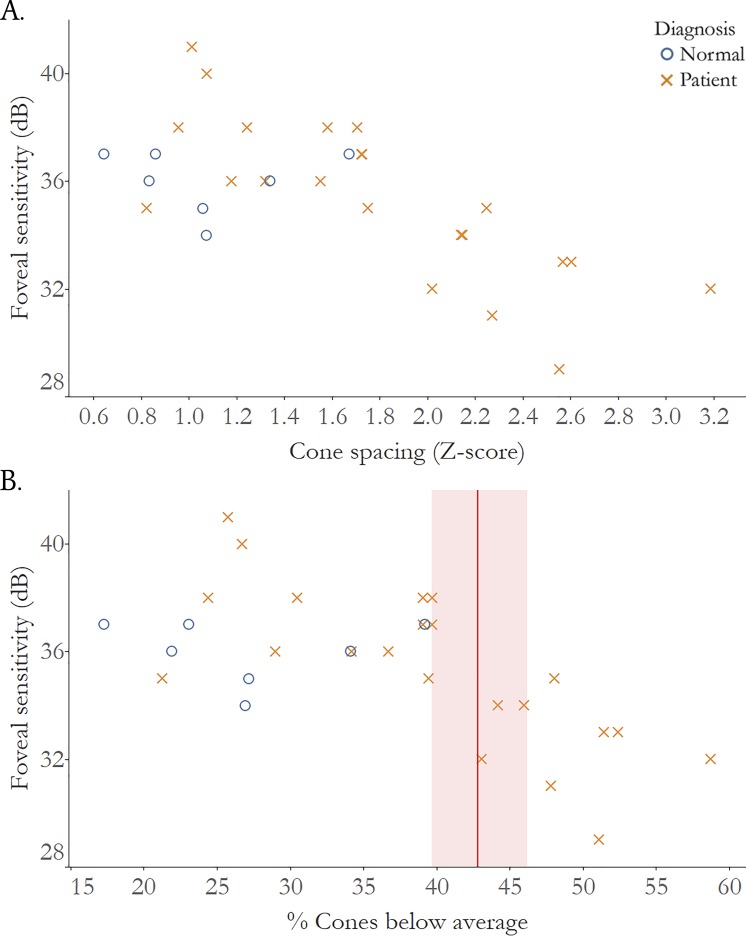
Foveal sensitivity is significantly correlated with cone loss measured as increased cone spacing z score. (A) Correlation of cone spacing z scores and foveal sensitivity, normal subjects: r = −0.19, 95% CI: −0.8 to 1.0; IRD patients r = −0.79, 95% CI: −0.9 to −0.4. (B) Correlation of % cones below average and foveal sensitivity; red line: threshold percent cone where vision drops below normal foveal sensitivity (<35 dB): 43.1%, red shading: 95% CI: 39.3 to 46.6. dB, decibels; normal subjects: blue circles; IRD patients: red Xs.
Results
ETDRS-VA was not significantly correlated with AOSLO-VA in healthy subjects (ρ = −0.33, 95% CI −1.0 to 0.3), but it was significantly correlated in IRD patients (ρ = 0.79, 95% CI 0.5–0.9) (Fig. 2). Similarly, ETDRS Letters Read correlated negatively with AOSLO-VA (Fig. 3); the correlation was not significant in healthy subjects (ρ = −0.02, 95% CI −0.9 to 1.0), but was significant in IRD patients (ρ = −0.84, 95% CI −0.9 to −0.6).
The cone spacing z scores and AOSLO-VA relationship was significant in IRD patients (ρ = 0.54, 95% CI 0.02–0.7), but not in healthy subjects (ρ = 0.37, 95% CI −0.8 to 1.0). Cone spacing z scores were also significantly correlated with ETDRS Letters Read in IRD patients (ρ = −0.64, 95% CI: −0.8 to −0.2), but not in healthy subjects (ρ = 0.16, 95% CI −1.0 to −0.8). The similarity in correlation of AOSLO-VA and ETDRS with z scores suggests that correcting the optical aberrations in this cohort of subjects did not give rise to improved structure/function relationships.
Figure 4B plots AOSLO-VA versus percentage of cones below average. The analysis shows that cone density decreased to 40.2% below normal (95% CI 31.1–45.5) before AOSLO-VA dropped below 20/20, and decreased to 48.9% fewer cones than normal (95% CI 44.5–58.6) before AOSLO-VA dropped below 20/25. Figure 5B plots are similar to 4B, but with ETDRS-VA rather than AOSLO-VA. The cone density thresholds associated with acuity below 20/20 and 20/25 were 42.0% (95% CI 36.5–46.1) and 49.5% fewer than normal (95% CI 46.2–59.7), respectively.
Cone spacing z scores were significantly correlated with foveal sensitivity in IRD patients (ρ = −0.79, 95% CI −0.9 to −0.4), but not in healthy subjects (ρ = −0.19, 95% CI −0.8 to 1.0). A percentage of cones below average of 43.1% (95% CI 39.3–46.6) or more would be needed to detect a drop in foveal sensitivity below 35 dB (Fig. 6B).
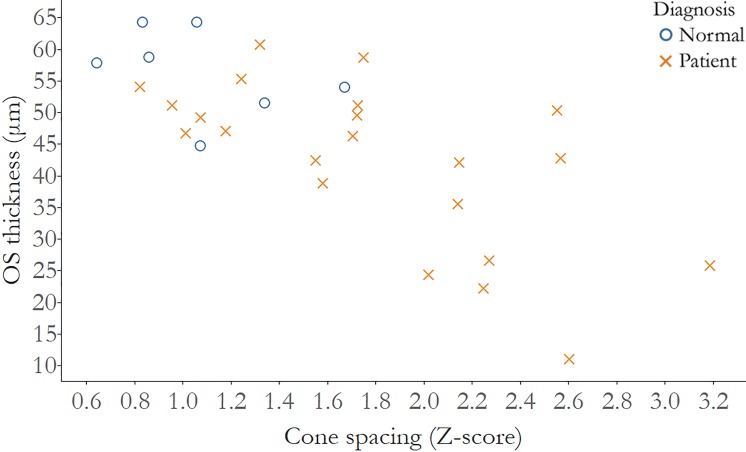
Finally, when cone spacing z scores were analyzed with cross-sectional measures of outer segment (OS) thickness, a significant correlation was seen in IRD patients alone (ρ = −0.61, 95% CI −0.8 to −0.2), but not in healthy subjects (ρ = −0.54, 95% CI −0.9 to 1.0) (Fig. 7).
Figure 7.
OS thickness is significantly correlated with cone loss measured as increased cone spacing z score. Correlation of cone spacing z scores and OS thickness, normal subjects: r = −0.54, 95% CI: −0.9 to 1.0; IRD patients: r = −0.61, 95% CI: −0.8 to −0.2. Normal subjects: blue circles; IRD patients: red Xs.
Discussion
The present study revealed significant correlations between measures of cone structure with measures of visual function at or near the fovea. As cone spacing increased, there was a significant decline in VA. Additionally, ETDRS-VA and AOSLO-VA were similarly correlated with cone spacing z scores measured near the foveal center. In both cases, the relationship was noisy and nonlinear. Furthermore, a similar reduction in cone density of approximately 40% below normal was required before clinically measurable changes in either measure of acuity were observed. Despite correcting for optical imperfections, AOSLO-VA did not result in significant improvement in this structure/function relationship.
One notable finding was that for all healthy subjects, and just under half of the IRD subjects, AOSLO-VA was worse than ETDRS-VA. We offer four possible explanations for this.
First, ETDRS-VA and AOSLO-VA not only used different methods (letters read on an acuity chart versus a four-alternative-forced-choice tumbling E staircase procedure) but also converged to different thresholds (82%31 vs. 70.7%39 correct). This is an unlikely explanation, because, if anything, the lower threshold for the AOSLO-VA ought to have yielded slightly better performance, but it did not.
Second, AOSLO-VA was administered using 840-nm light with more than 20 times lower luminance (approximately 4 cd/m2) than the standard light box used to measure ETDRS-VA (85 cd/m2). AOSLO-VA measures that were better than clinical measures of VA were achieved using nearly identical measurement conditions and a similar system in earlier reports.2 The subjects in the earlier reports, however, were healthy, younger, emmetropic, and had extensive experience using the AOSLO system.
Third, a possible interpretation for the lack of improvements in VA with aberration correction could be that the receptive fields in our subjects (both healthy and IRD subjects) comprise more than single cones. Eliminating the aberrations would confer little benefit if this were the case, which is what we found, and a random loss of cones within larger receptive field would only have minimal effects on the sampling resolution until many cones were lost, which is also what we found. However, we have every reason to believe that there are at least two midget ganglion cells per foveal cone in our healthy subjects and that cone spacing imposes the retinal limit on foveal VA. Measurement of the limits of human spatial vision at the fovea in young healthy eyes confirms this.2 It is very unlikely that this ratio would be any different in the slightly older healthy subjects we used for this study (average age of 50 years) and the comparable acuity of the less-advanced IRD patients suggests that this is true for them as well.
The most likely explanation arises from the facts that subjects in this study were older, perhaps with subclinical lens opacities, were unfamiliar with the AOSLO-VA task, were not emmetropic (see Table), and had little or no experience being imaged in an AOSLO. Collectively, these facts probably explain why AOSLO-VA measures were slightly worse than ETDRS-VA. This final explanation is important, because, until AOSLO-mediated functional tests become more widely available, robust, and efficient, subjects will often have limited experience with the test.
IRD subjects seemed to benefit more from adaptive optics (AO) correction than healthy subjects, perhaps because the IRD subjects' aberrations were, on average, greater. Greater aberrations in RP patients have been reported,43 but the aberration of the eyes in our study was not recorded or analyzed before AO correction.
Cone Spacing Compared With ETDRS and AOSLO Acuities
In patients with IRD, both ETDRS and AOSLO-mediated acuities were correlated with cone spacing z scores. The significant correlations demonstrated that greater cone spacing, indicating cone loss, corresponded to worse acuity performance. Healthy subjects, however, did not demonstrate a statistically significant correlation between acuity and cone spacing. It is clear that factors outside of cone spacing and optics (see earlier discussion) govern acuity performance in the normal healthy eyes that were part of this study. There are no obvious advantages of AOSLO-mediated acuity over conventional measures for assessing foveal structure.
We consistently found that VA did not decrease until cone densities were approximately 40% lower than the average for normal eyes. The thresholds for ETDRS acuity were similar to a previous study, and the present study demonstrated a similar threshold for AOSLO-mediated VA.4 Despite differences in the actual reported thresholds, the 95% CIs between studies overlap (compare Figs. 4B, 5B in the present paper with Fig. 4 from Ratnam et al.4).
Cone Spacing Compared With Foveal Sensitivity
As with acuity, there was a significant relationship between foveal sensitivity and cone spacing z scores, but the data were noisy and nonlinear, and significant declines in foveal sensitivity were not observed reliably until cones were well below the normal average. The cone density threshold to detect foveal sensitivities below 35 dB was similar between the current and our previous report.4 Although the thresholds were different (43% vs. 52%4), the 95% CIs overlapped. However, the range of percentage cone loss associated with reduced VA and foveal sensitivity was narrower in the present study, refining the threshold to near 40% to 50% cone loss for all abnormal measures of foveal function. As reported in previous studies based on computer modeling,3 visual (grating) acuity is not directly associated with the mean density or spacing of photoreceptors at the fovea.
Cone Spacing Compared With OS Thickness
For IRD, cone spacing z scores correlated negatively with OS thickness. As cones degenerate, the OS becomes thinner, due to decreased length of OS, which likely precedes cone loss with increased cone spacing during degeneration.44,45 However, no correlation was observed in healthy subjects, due to the absence of photoreceptor degeneration.
Conclusions
In conclusion, even after correcting high-order aberrations, the relationship between VA and foveal cone spacing was weak until cone densities were 40% to 50% lower than the normal average. The nonlinear relationship and variability suggest that VA, whether measured by conventional methods or with optical correction through the AOSLO, remains an ineffective way to gauge early changes in foveal cone spacing or density, and that cone spacing may be a more sensitive measure of cone loss in early stages of degeneration. On a positive note, the fact that AOSLO imaging can detect structural changes in the cones well in advance of the acuity loss means that there is a therapeutic window within which one can treat and monitor effectiveness in advance of any visual impact for the patient.
Acknowledgments
Supported by National Institutes of Health (NIH) Grants EY023591 and EY002162, Food and Drug Administration R01-41001, Foundation Fighting Blindness, Research to Prevent Blindness Nelson Trust Award for Retinitis Pigmentosa and Unrestricted Funds, The Bernard A. Newcomb Macular Degeneration Fund, That Man May See, Inc., Hope for Vision, 2012 Beckman Initiative for Macular Research Grant 1201, Claire Giannini Foundation, NIH Training Grant 5T32EY007043-37, and Minnie Flaura Turner Memorial Fund for Impaired Vision Research Award 2015.
Disclosure: K.G. Foote, None; P. Loumou, None; S. Griffin, None; J. Qin, None; K. Ratnam, None; T.C. Porco, None; A. Roorda, P; J.L. Duncan, AGTC (C), Editas, Inc. (C), Ionis Pharmaceuticals (C), Novelion Therapeutics (C), ProQR Therapeutics, Inc. (C, R), Shire Human Genetic Therapies, Inc. (C), Sparing Vision (C), Spark Therapeutics (C)
References
- 1.Curcio CA, Sloan KR, Kalina RE, Hendrickson AE. Human photoreceptor topography. J Comp Neurol. 1990;292:497–523. doi: 10.1002/cne.902920402. [DOI] [PubMed] [Google Scholar]
- 2.Rossi EA, Roorda A. The relationship between visual resolution and cone spacing in the human fovea. Nat Neurosci. 2010;13:156–157. doi: 10.1038/nn.2465. [DOI] [PMC free article] [PubMed] [Google Scholar]
- 3.Geller AM, Sieving PA, Green DG. Effect on grating identification of sampling with degenerate arrays. J Opt Soc Am A. 1992;9:472–477. doi: 10.1364/josaa.9.000472. [DOI] [PubMed] [Google Scholar]
- 4.Ratnam K, Carroll J, Porco TC, Duncan JL, Roorda A. Relationship between foveal cone structure and clinical measures of visual function in patients with inherited retinal degenerations. Invest Ophthalmol Vis Sci. 2013;54:5836–5847. doi: 10.1167/iovs.13-12557. [DOI] [PMC free article] [PubMed] [Google Scholar]
- 5.Fishman GA, Jacobson SG, Alexander KR, et al. Outcome measures and their application in clinical trials for retinal degenerative diseases: outline, review, and perspective. Retina. 2005;25:772–777. doi: 10.1097/00006982-200509000-00014. [DOI] [PubMed] [Google Scholar]
- 6.Bruce KS, Harmening WM, Langston BR, Tuten WS, Roorda A, Sincich LC. Normal perceptual sensitivity arising from weakly reflective cone photoreceptors. Invest Ophthalmol Vis Sci. 2015;56:4431–4438. doi: 10.1167/iovs.15-16547. [DOI] [PMC free article] [PubMed] [Google Scholar]
- 7.Tu JH, Foote KG, Lujan BJ, et al. Dysflective cones: visual function and cone reflectivity in long-term follow-up of acute bilateral foveolitis. Am J Ophthalmol Case Rep. 2017;7:14–19. doi: 10.1016/j.ajoc.2017.04.001. [DOI] [PMC free article] [PubMed] [Google Scholar]
- 8.Arditi A, Cagenello R. On the statistical reliability of letter-chart visual acuity measurements. Invest Ophthalmol Vis Sci. 1993;34:120–129. [PubMed] [Google Scholar]
- 9.Fishman GA, Gilbert LD, Anderson RJ, Marmor MF, Weleber RG, Viana MA. Effect of methazolamide on chronic macular edema in patients with retinitis pigmentosa. Ophthalmology. 1994;101:687–693. doi: 10.1016/s0161-6420(94)31277-2. [DOI] [PubMed] [Google Scholar]
- 10.Grover S, Fishman GA, Gilbert LD, Anderson RJ. Reproducibility of visual acuity measurements in patients with retinitis pigmentosa. Retina. 1997;17:33–37. doi: 10.1097/00006982-199701000-00007. [DOI] [PubMed] [Google Scholar]
- 11.Vanden Bosch ME, Wall M. Visual acuity scored by the letter-by-letter or probit methods has lower retest variability than the line assignment method. Eye (Lond) 1997;11(Pt 3):411–417. doi: 10.1038/eye.1997.87. [DOI] [PubMed] [Google Scholar]
- 12.Kim LS, McAnany JJ, Alexander KR, Fishman GA. Intersession repeatability of Humphrey perimetry measurements in patients with retinitis pigmentosa. Invest Ophthalmol Vis Sci. 2007;48:4720–4724. doi: 10.1167/iovs.07-0690. [DOI] [PubMed] [Google Scholar]
- 13.Ross DF, Fishman GA, Gilbert LD, Anderson RJ. Variability of visual field measurements in normal subjects and patients with retinitis pigmentosa. Arch Ophthalmol. 1984;102:1004–1010. doi: 10.1001/archopht.1984.01040030806021. [DOI] [PubMed] [Google Scholar]
- 14.Seiple W, Clemens CJ, Greenstein VC, Carr RE, Holopigian K. Test-retest reliability of the multifocal electroretinogram and Humphrey visual fields in patients with retinitis pigmentosa. Doc Ophthalmol. 2004;109:255–272. doi: 10.1007/s10633-005-0567-0. [DOI] [PubMed] [Google Scholar]
- 15.Bailey JE, Lakshminarayanan V, Enoch JM. The Stiles-Crawford function in an aphakic subject with retinitis pigmentosa. Clin Vis Sci. 1991;6:165–170. [Google Scholar]
- 16.Birch DG, Sandberg MA, Berson EL. The Stiles-Crawford effect in retinitis pigmentosa. Invest Ophthalmol Vis Sci. 1982;22:157–164. [PubMed] [Google Scholar]
- 17.Alexander KR, Hutman LP, Fishman GA. Dark-adapted foveal thresholds and visual acuity in retinitis pigmentosa. Arch Ophthalmol. 1986;104:390–394. doi: 10.1001/archopht.1986.01050150090034. [DOI] [PubMed] [Google Scholar]
- 18.Akeo K, Hiida Y, Saga M, Inoue R, Oguchi Y. Correlation between contrast sensitivity and visual acuity in retinitis pigmentosa patients. Ophthalmologica. 2002;216:185–191. doi: 10.1159/000059627. [DOI] [PubMed] [Google Scholar]
- 19.Lindberg CR, Fishman GA, Anderson RJ, Vasquez V. Contrast sensitivity in retinitis pigmentosa. Br J Ophthalmol. 1981;65:855–858. doi: 10.1136/bjo.65.12.855. [DOI] [PMC free article] [PubMed] [Google Scholar]
- 20.Wolkstein M, Atkin A, Bodis-Wollner I. Contrast sensitivity in retinal disease. Ophthalmology. 1980;87:1140–1149. doi: 10.1016/s0161-6420(80)35112-9. [DOI] [PubMed] [Google Scholar]
- 21.Rossi EA, Weiser P, Tarrant J, Roorda A. Visual performance in emmetropia and low myopia after correction of high-order aberrations. J Vis. 2007;7(8):14. doi: 10.1167/7.8.14. [DOI] [PubMed] [Google Scholar]
- 22.Ratnam K, Domdei N, Harmening WM, Roorda A. Benefits of retinal image motion at the limits of spatial vision. J Vis. 2017;17(1):30. doi: 10.1167/17.1.30. [DOI] [PMC free article] [PubMed] [Google Scholar]
- 23.Rucci M, Iovin R, Poletti M, Santini F. Miniature eye movements enhance fine spatial detail. Nature. 2007;447:851–854. doi: 10.1038/nature05866. [DOI] [PubMed] [Google Scholar]
- 24.Liang J, Williams DR. Aberrations and retinal image quality of the normal human eye. J Opt Soc Am A Opt Image Sci Vis. 1997;14:2873–2883. doi: 10.1364/josaa.14.002873. [DOI] [PubMed] [Google Scholar]
- 25.Marcos S, Sawides L, Gambra E, Dorronsoro C. Influence of adaptive-optics ocular aberration correction on visual acuity at different luminances and contrast polarities. J Vis. 2008;8(13):1. doi: 10.1167/8.13.1. [DOI] [PubMed] [Google Scholar]
- 26.Yoon GY, Williams DR. Visual performance after correcting the monochromatic and chromatic aberrations of the eye. J Opt Soc Am A Opt Image Sci Vis. 2002;19:266–275. doi: 10.1364/josaa.19.000266. [DOI] [PubMed] [Google Scholar]
- 27.Rossi EA, Roorda A. Is visual resolution after adaptive optics correction susceptible to perceptual learning? J Vis. 2010;10(12):11. doi: 10.1167/10.12.11. [DOI] [PMC free article] [PubMed] [Google Scholar]
- 28.Sullivan LS, Bowne SJ, Reeves MJ, et al. Prevalence of mutations in eyeGENE probands with a diagnosis of autosomal dominant retinitis pigmentosa. Invest Ophthalmol Vis Sci. 2013;54:6255–6261. doi: 10.1167/iovs.13-12605. [DOI] [PMC free article] [PubMed] [Google Scholar]
- 29.Biswas P, Duncan JL, Maranhao B, et al. Genetic analysis of 10 pedigrees with inherited retinal degeneration by exome sequencing and phenotype-genotype association. Physiol Genomics. 2017;49:216–229. doi: 10.1152/physiolgenomics.00096.2016. [DOI] [PMC free article] [PubMed] [Google Scholar]
- 30.Ratnam K, Vastinsalo H, Roorda A, Sankila EM, Duncan JL. Cone structure in patients with Usher syndrome type III and mutations in the Clarin 1 gene. JAMA Ophthalmol. 2013;131:67–74. doi: 10.1001/2013.jamaophthalmol.2. [DOI] [PMC free article] [PubMed] [Google Scholar]
- 31.Ferris FL, III,, Kassoff A, Bresnick GH, Bailey I. New visual acuity charts for clinical research. Am J Ophthalmol. 1982;94:91–96. [PubMed] [Google Scholar]
- 32.Bailey IL, Lovie JE. New design principles for visual acuity letter charts. Am J Optom Physiol Opt. 1976;53:740–745. doi: 10.1097/00006324-197611000-00006. [DOI] [PubMed] [Google Scholar]
- 33.Birch DG, Wen Y, Locke K, Hood DC. Rod sensitivity, cone sensitivity, and photoreceptor layer thickness in retinal degenerative diseases. Invest Ophthalmol Vis Sci. 2011;52:7141–7147. doi: 10.1167/iovs.11-7509. [DOI] [PMC free article] [PubMed] [Google Scholar]
- 34.Hood DC, Cho J, Raza AS, Dale EA, Wang M. Reliability of a computer-aided manual procedure for segmenting optical coherence tomography scans. Optom Vis Sci. 2011;88:113–123. doi: 10.1097/OPX.0b013e3181fc3625. [DOI] [PMC free article] [PubMed] [Google Scholar]
- 35.Hood DC, Lin CE, Lazow MA, Locke KG, Zhang X, Birch DG. Thickness of receptor and post-receptor retinal layers in patients with retinitis pigmentosa measured with frequency-domain optical coherence tomography. Invest Ophthalmol Vis Sci. 2009;50:2328–2336. doi: 10.1167/iovs.08-2936. [DOI] [PMC free article] [PubMed] [Google Scholar]
- 36.Wen Y, Klein M, Hood DC, Birch DG. Relationships among multifocal electroretinogram amplitude, visual field sensitivity, and SD-OCT receptor layer thicknesses in patients with retinitis pigmentosa. Invest Ophthalmol Vis Sci. 2012;53:833–840. doi: 10.1167/iovs.11-8410. [DOI] [PMC free article] [PubMed] [Google Scholar]
- 37.Wen Y, Locke KG, Klein M, et al. Phenotypic characterization of 3 families with autosomal dominant retinitis pigmentosa due to mutations in KLHL7. Arch Ophthalmol. 2011;129:1475–1482. doi: 10.1001/archophthalmol.2011.307. [DOI] [PMC free article] [PubMed] [Google Scholar]
- 38.Aizawa S, Mitamura Y, Baba T, Hagiwara A, Ogata K, Yamamoto S. Correlation between visual function and photoreceptor inner/outer segment junction in patients with retinitis pigmentosa. Eye (London) 2009;23:304–308. doi: 10.1038/sj.eye.6703076. [DOI] [PubMed] [Google Scholar]
- 39.Garcia-Perez MA. Forced-choice staircases with fixed step sizes: asymptotic and small-sample properties. Vision Res. 1998;38:1861–1881. doi: 10.1016/s0042-6989(97)00340-4. [DOI] [PubMed] [Google Scholar]
- 40.Duncan JL, Zhang Y, Gandhi J, et al. High-resolution imaging with adaptive optics in patients with inherited retinal degeneration. Invest Ophthalmol Vis Sci. 2007;48:3283–3291. doi: 10.1167/iovs.06-1422. [DOI] [PubMed] [Google Scholar]
- 41.Rodieck RW. The density recovery profile: a method for the analysis of points in the plane applicable to retinal studies. Vis Neurosci. 1991;6:95–111. doi: 10.1017/s095252380001049x. [DOI] [PubMed] [Google Scholar]
- 42.Zayit-Soudry S, Sippl-Swezey N, Porco TC, et al. Repeatability of cone spacing measures in eyes with inherited retinal degenerations. Invest Ophthalmol Vis Sci. 2015;56:6179–6189. doi: 10.1167/iovs.15-17010. [DOI] [PubMed] [Google Scholar]
- 43.Rajagopalan AS, Shahidi M, Alexander KR, Fishman GA, Zelkha R. Higher-order wavefront aberrations in retinitis pigmentosa. Optom Vis Sci. 2005;82:623–628. doi: 10.1097/01.opx.0000171335.57812.a2. [DOI] [PubMed] [Google Scholar]
- 44.Lazow MA, Hood DC, Ramachandran R, et al. Transition zones between healthy and diseased retina in choroideremia (CHM) and Stargardt disease (STGD) as compared to retinitis pigmentosa (RP) Invest Ophthalmol Vis Sci. 2011;52:9581–9590. doi: 10.1167/iovs.11-8554. [DOI] [PMC free article] [PubMed] [Google Scholar]
- 45.Milam AH, Li ZY, Fariss RN. Histopathology of the human retina in retinitis pigmentosa. Prog Retin Eye Res. 1998;17:175–205. doi: 10.1016/s1350-9462(97)00012-8. [DOI] [PubMed] [Google Scholar]


