Abstract
‘Innate immune memory’ is a vital mechanism of myeloid cell plasticity that occurs in response to environmental stimuli and alters subsequent immune responses. Two types of immunological imprinting can be distinguished, training and tolerance, which are epigenetically mediated and enhance or suppress subsequent inflammation, respectively. Whether immune memory occurs in tissue-resident macrophages in vivo and how it may affect pathology remains largely unknown. Here we demonstrate that peripherally applied inflammatory stimuli induce acute immune training and tolerance in the brain and lead to differential epigenetic reprogramming of brain-resident macrophages, microglia, that persists for at least six months. Strikingly, in a mouse model of Alzheimer’s pathology, immune training exacerbates cerebral β-amyloidosis while tolerance alleviates it; similarly, peripheral immune stimulation modifies pathological features after stroke. Our results identify immune memory in the brain as an important modifier of neuropathology.
Contrary to the long-held assumption that immunological memory exists only in cells of the adaptive immune system, recent evidence indicates that myeloid cells also display memory effects1,2. For example, certain immune stimuli ‘train’ blood monocytes to generate enhanced immune responses to subsequent immune insults3,4. In contrast, other stimuli induce immune tolerance, i.e. suppression of inflammatory responses to subsequent stimuli3,5. Innate immune memory lasts for several days in vitro and for up to three months in circulating monocytes in vivo and is mediated by epigenetic reprogramming in cultured cells, with chromatin changes also apparent in vivo3,6,7. However, whether immune memory occurs in long-lived tissue-resident macrophages and whether it alters tissue-specific pathology remains unknown.
Microglia, the brain-resident macrophages, were recently shown to be very long-lived cells8,9. This makes them particularly interesting for studying immune memory, as virtually permanent modification of their molecular profile appears possible. As microglia are also known to significantly affect many neurological diseases10–12, we investigated whether immune memory occurs in microglia in vivo and how it affects neuropathology.
Acute immune memory in the brain
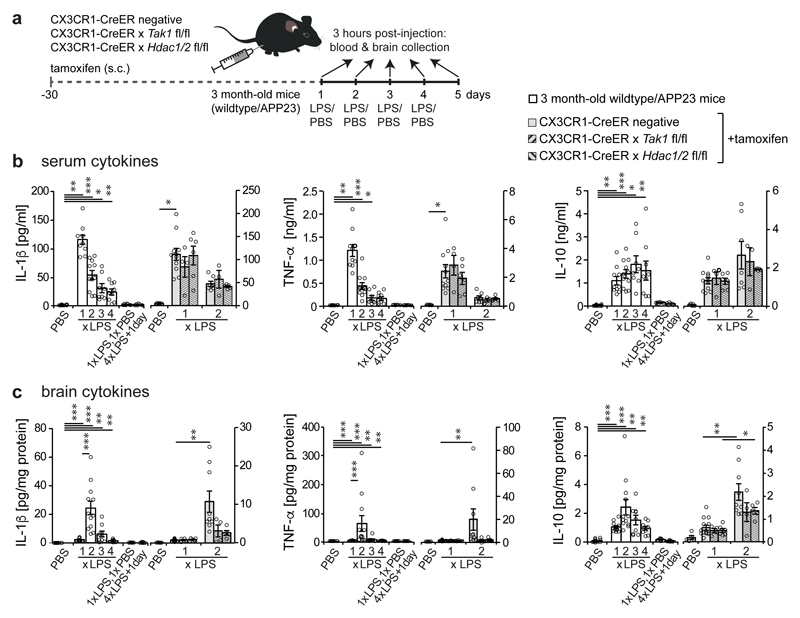
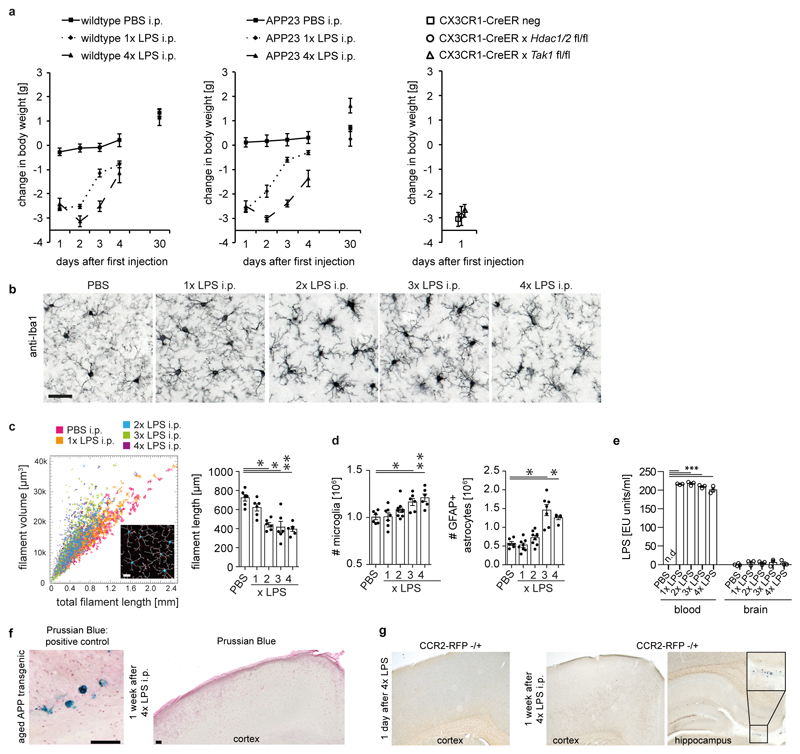
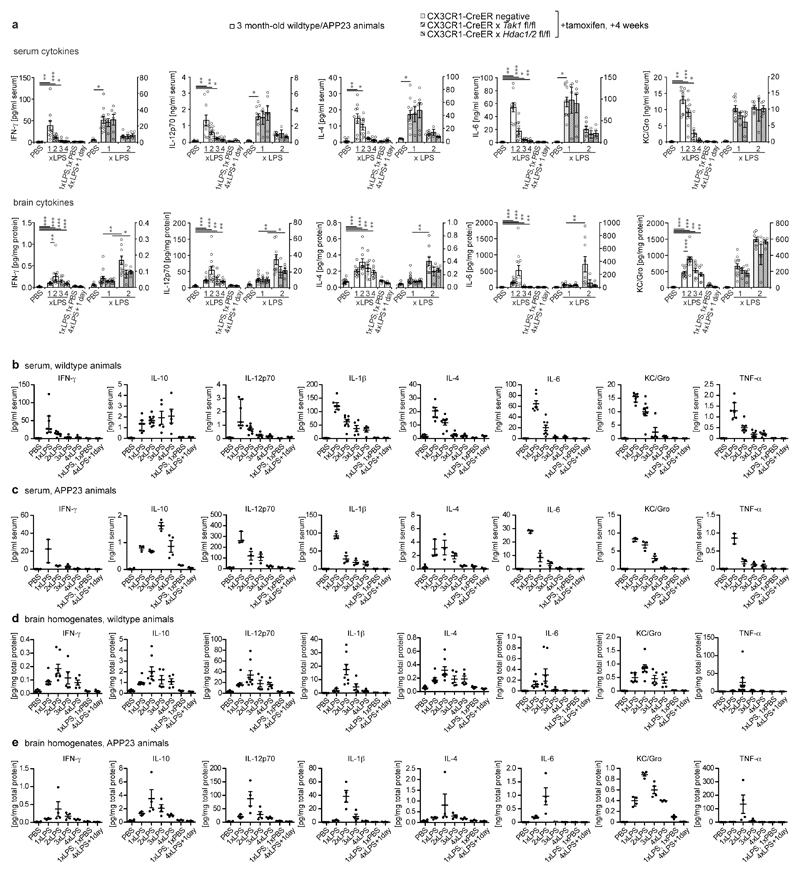
It is well-established that inflammation in the periphery can prompt immune responses in the brain13. To evaluate whether immune memory is inducible in the brain by peripheral stimulation, mice received daily intraperitoneal injections of low-dose lipopolysaccharides (LPS) on four consecutive days, leading to mild sickness behaviour and temporary weight loss (Fig.1a and Extended Data Fig.1a). Three hours after application, the first LPS injection (1xLPS) led to a pronounced increase of blood cytokine levels, but only modest increases in brain cytokines. Upon the second injection (2xLPS), the blood levels of the pro-inflammatory cytokines IL-1β, TNF-α, IL-6, IL-12 and IFN-γ were diminished compared to 1xLPS while IL-10 release occurred at similar levels, indicating peripheral immune tolerance. In sharp contrast, brain cytokines were dramatically increased with 2xLPS injections, indicating a brain-specific training effect induced by the first LPS stimulus (Figs.1b/c and Extended Data Fig.2). Accordingly, a conspicuous morphological change in microglia occurred after 2xLPS, while activated (GFAP+) astrocytes only increased after 3xLPS (Extended Data Figs.1b-d). Importantly, 4xLPS virtually abolished TNF-α, IL-1β and IL-6 release in the brain while IL-10 remained elevated, indicating immune tolerance.
Figure 1. Peripheral immune stimulation evokes immune memory in microglia.
a, Experimental approach. b, White bars: Peripheral cytokine levels in wildtype/APP23 animals following lipopolysaccharide (LPS) injections. Note that tolerance is induced with repeated injections. c, Brain cytokine levels: 2xLPS amplifies IL-1β/TNF-α release, demonstrating immune training; tolerance occurs with 3x/4xLPS. Cytokines return to baseline within 24h (1xLPS,1xPBS/4xLPS+1day). Grey bars: Microglia-specific knockout of Tak1 or Hdac1/2 selectively prevents immune training in the brain. In (b/c) n=16,11,12,9,9,7,7 | 5,13,4,6,9,4,5 from left to right. */**/***P <0.05/ 0.01/0.001 for independent-samples median test with correction for multiple comparisons. Data are means±s.e.m.
Next, we examined the contribution of microglia to immune memory in the brain using inducible CX3CR1-CreER (Cre) mice crossed with mouse lines carrying loxP-flanked genes, where tamoxifen-induced Cre expression results in persistent recombination in long-lived microglia but not in short-lived myeloid cells, including blood monocytes14. We induced microglial knockout of either ‘transforming growth factor-β-activated kinase 1’ (Tak1), which results in inhibition of NF-κB, JNK and ERK1/2 pathways14, or histone deacetylases-1 and -2 (Hdac1/2), two major regulators of epigenetic reprogramming and macrophage inflammatory responses15. As expected, tamoxifen-induced knockout of either Tak1 or Hdac1/2 did not alter the peripheral inflammatory response. Furthermore, brain cytokine levels were indistinguishable after 1xLPS, but the training effect following 2xLPS injections was virtually abolished in Cre+ animals. Notably, the cytokines showing the most pronounced training and tolerance effects (IL-1β, TNF-α, IL-6) were also most affected by microglial gene knockout (Figs.1b/c and Extended Data Fig.2), indicating that immune memory in the brain is predominantly microglia-mediated. Moreover, after 1xLPS, Cre+ and Cre– mice showed indistinguishable weight loss (Extended Data Fig.1a) and sickness behaviour (not shown); however, in animals with microglial Tak1 knockout, sickness behaviour after 2xLPS was noticeably alleviated (Supplementary video 1).
After intraperitoneal injections, LPS was found in the blood but not in the brain, indicating that neither significant entry of LPS into the brain nor opening of the blood-brain barrier occurred, corresponding with previous reports16. The latter was confirmed by the absence of blood iron in the brain parenchyma. Also, using 'type 2 CC chemokine receptor’ (CCR2) reporter mice17, no extravasation of circulating monocytes was found (Extended Data Figs.1e-g), confirming that immune memory was mediated by brain-resident macrophages alone.
Immune memory shapes neuropathology
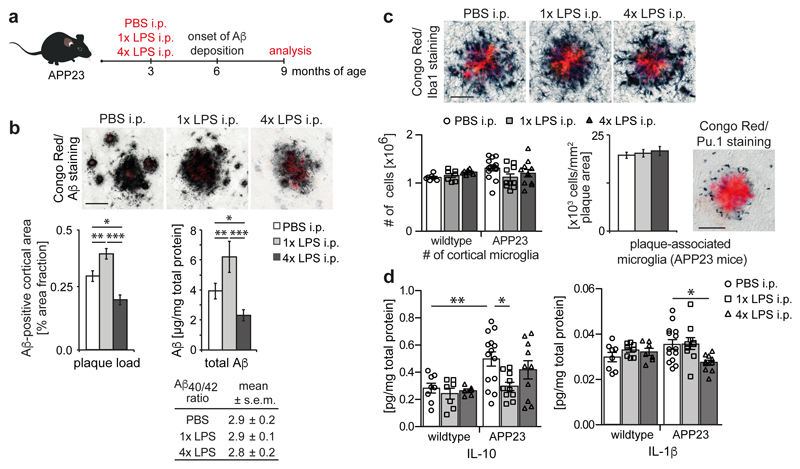
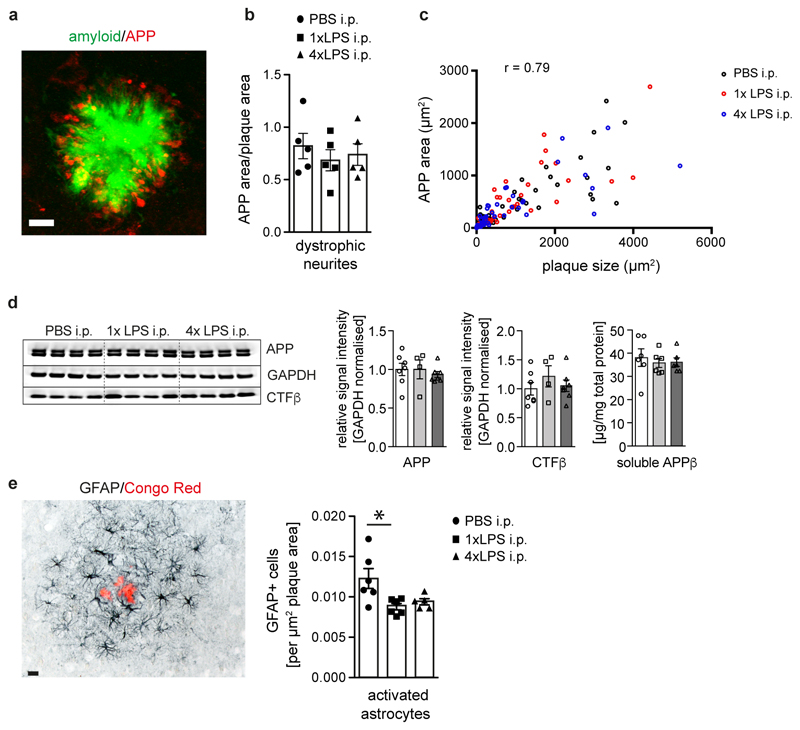
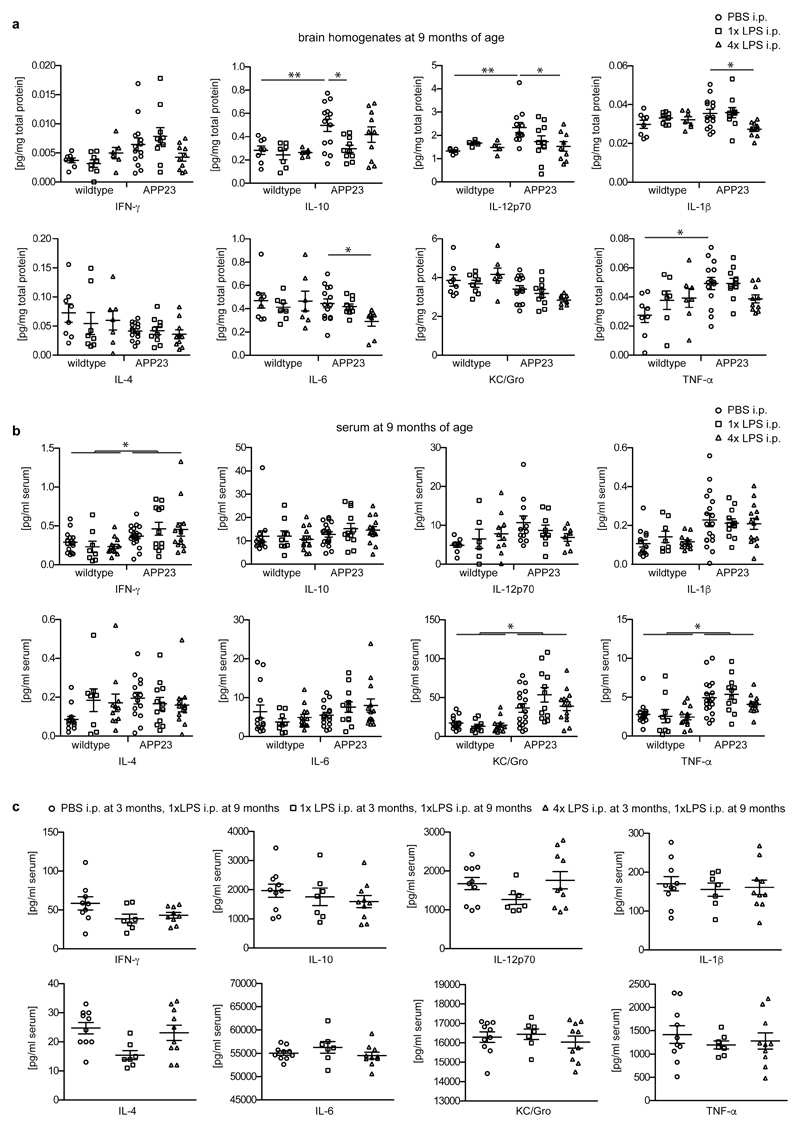
Next, we analysed whether the training- and tolerance-inducing stimuli 1xLPS and 4xLPS, respectively, could lead to long-term alterations of brain immune responses and thereby modify disease pathogenesis. APP23 mice are a model of Alzheimer’s disease (AD) pathology, where plaques of insoluble amyloid-β develop from 6 months of age. Amyloid plaques lead to activation of microglia18, thereby providing a stimulus that should reveal microglial immune memory. We injected 3-month-old APP23 mice with 1x/4xLPS, then analysed pathology 6 months later (Fig.2a). Strikingly, 1xLPS significantly increased while 4xLPS significantly decreased both plaque load and total amyloid-β levels compared to control animals (Fig.2b), with plaque-associated neuritic damage correlating directly with plaque size in all treatment groups (Extended Data Figs.3a-c). Also, the protein levels of amyloid-β precursor protein (APP) and its cleavage products were indistinguishable amongst groups, indicating equivalent amyloid-β generation (Extended Data Fig.3d). Furthermore, neither the total number of microglia nor the number of microglia clustering around plaques was altered by LPS treatments (Fig.2c), while the number of activated (GFAP+) astrocytes decreased slightly both with 1x and 4xLPS treatment (Extended Data Fig.3e). However, the brain levels of IL-1β, IL-6 and IL-12 were reduced in 4xLPS-treated APP animals, while in 1xLPS-treated APP mice IL-10 was reduced. In contrast, brain cytokine levels were not altered in wildtype littermate controls and baseline blood cytokine levels were unchanged in wildtype and APP animals. Furthermore, an additional LPS injection at 9 months of age caused indistinguishable peripheral cytokine responses (Fig.2d and Extended Data Figs.4a-c). Thus, peripheral immune stimuli cause long-term alterations in the brain immune response and differentially affect AD pathology.
Figure 2. Cerebral β-amyloidosis is altered after peripheral immune stimulation.
a, Experimental design. b, Analysis of cortical amyloid-β plaque load (n=22,10,10 animals) and protein levels (n=14,10,10 animals). c, Analysis of total cortical and plaque-associated microglia (n=7,7,7,14,10,10 animals) and d, cytokine levels of IL-10 and IL-1β in wildtype and APP23 mice (n=8,8,7 and n=14,10,10 animals). Scale bar: 50 µm. */**/***P <0.05/0.01/ 0.001 for one-way (b) and two-way ANOVA (c/d) with Tukey correction. Data are means ± s.e.m.
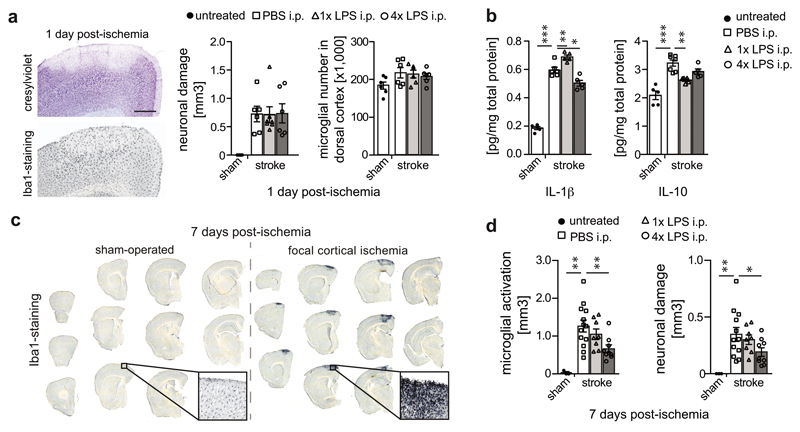
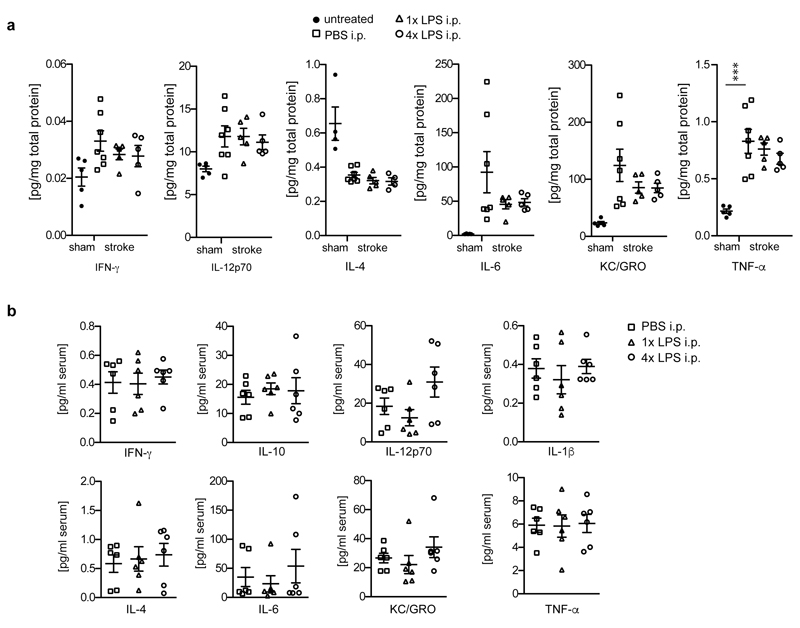
To test for immune memory effects in a second disease model, we injected wildtype animals with 1x/4xLPS and induced focal brain ischemia one month later. One day post-ischemia, neuronal damage and microglial numbers were indistinguishable amongst treatment groups (Fig.3a), indicating that the initial ischemic insult was unaffected by 1x/4xLPS. However, the acute inflammatory response, which is driven by brain-resident cells early after ischemia12, differed, showing increased levels of IL-1β in 1xLPS- and decreased levels in 4xLPS-treated animals. In contrast, the release of IL-10 was significantly suppressed by 1xLPS only (Fig.3b), reminiscent of results in APP animals (Fig.2d). Other brain cytokines and blood cytokine levels were indistinguishable amongst groups (Extended Data Fig.5). Importantly, seven days after brain ischemia, the volume of neuronal damage and microglial activation was strongly reduced by 4xLPS but unaffected by 1xLPS (Figs.3c/d). These results confirm long-term modulation of brain immune responses and suggest persistent modification of stroke pathology following a tolerizing but not a training stimulus, possibly due to the severity of the insult preventing its further exacerbation through amplification of the immune response.
Figure 3. Stroke pathology is altered after peripheral immune stimulation.
Pathological features of brain ischemia induced one month after intraperitoneal injection with 1x or 4xLPS. a, Neuronal damage (cresylviolet, n=6,6,7,6 animals), microglial numbers (Iba1-positive, n=6,6,6 animals) and b, cytokine profiles one day post-ischemia (n=5,7,5,5 animals). c, Overview of microglial activation in the infarct and d, quantification of neuronal damage and microglial activation seven days post-ischemia (n=3,13,8,9 animals). Scale bar: 500 µm. */**/*** P <0.05/0.01/ 0.001 for one-way ANOVA with Tukey correction. Data are means ± s.e.m.
Microglial molecular profiles
In vitro, immune memory in macrophages results from epigenetically-mediated alterations in the enhancer repertoire, leading to transcriptional changes3,19,20. Since our data indicated that acute immune memory in the brain is mediated predominantly by microglia, we isolated microglia by cell sorting (Extended Data Fig.6) from 9-month-old animals stimulated with 1x/4xLPS at 3 months of age and performed chromatin immunoprecipitation for mono-methylation at lysine 4 of histone 3 (H3K4me1) and acetylation at lysine 27 of histone 3 (H3K27ac), which define active enhancers19,20. Thus, we identified 20,241 putative active enhancers across all conditions.
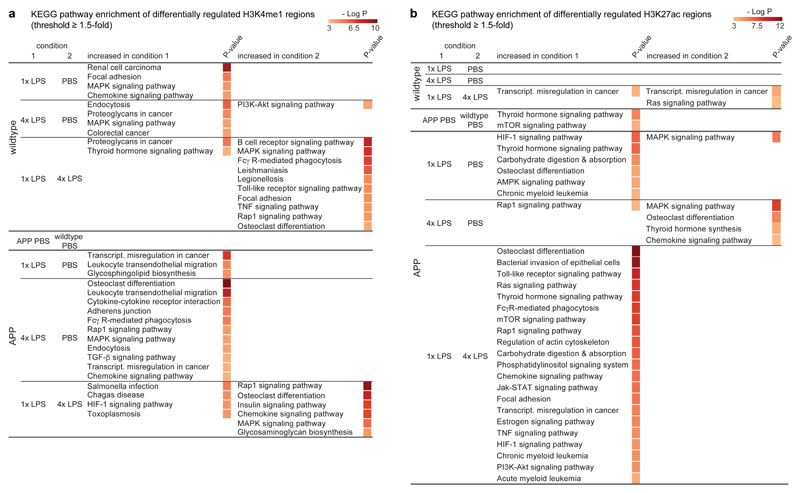
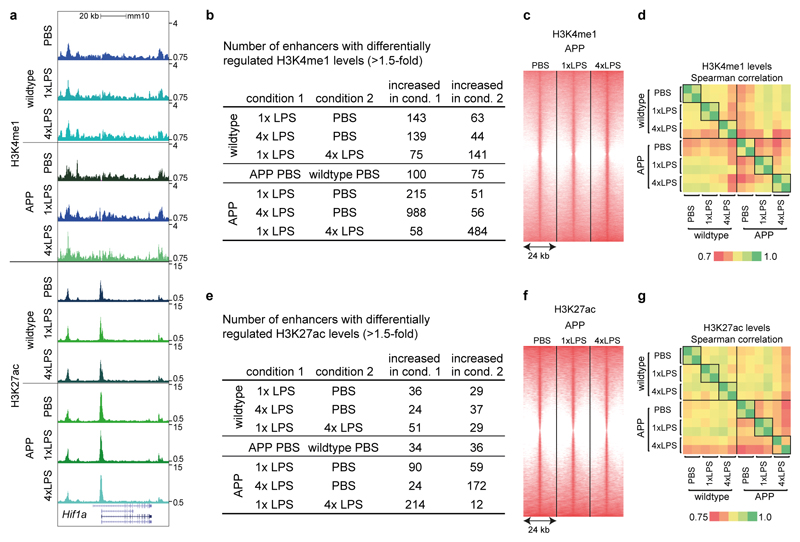
First, we focussed on H3K4me1 marks, which should mark all enhancers activated in response to the first and/or second immune stimulus (as enhancers may lose H3K27ac after cessation of inflammation but retain H3K4me1 marks)19,20. Strikingly, H3K4me1 levels differed significantly between control and LPS treatment groups both in wildtype and APP animals but also between 1x- and 4xLPS-treated mice (Extended Data Fig.7b; Supplementary Table1). For example, enhancers with increased H3K4me1 levels in microglia from 1xLPS versus 4xLPS wildtype animals showed enrichment for the ‘thyroid hormone signalling pathway’, including a putative enhancer for hypoxia inducible factor-1α (HIF-1α). Similarly, enhancers with higher H3K4me1 levels in 1xLPS versus 4xLPS-treated APP mice were enriched for the ‘HIF-1 signalling pathway’. On the other hand, 4xLPS-treated APP animals showed increased H3K4me1 levels in putative enhancers related to phagocytic function (Fig.4a). Importantly, no pathway enrichment was found when comparing H3K4me1 levels in microglia from APP and wildtype controls (Fig.4a), indicating that H3K4me1 levels were altered predominantly in response to LPS stimulation.
Figure 4. The microglial enhancer repertoire 6 months after immune stimulation.
Pathway enrichment of enhancers (with Benjamini-Hochberg correction) with differentially regulated H3K4me1 (a) and H3K27ac (b) levels (based on nearest gene; cumulative Poisson P-value <0.0001). n=2 replicates (8-10 animals/replicate).
Next, we analysed enhancer activation by determining differential regulation of H3K27ac levels. In line with the requirement of an acute stimulus for H3K27ac deposition19, differential enhancer activation was more pronounced in APP animals (where amyloid plaques activate microglia) than in wildtype groups (190±18 in APP, 69±5 in wildtype groups; Extended Data Fig.7e; Supplementary Table2). For example, differentially regulated H3K27ac levels in microglia from 1xLPS-treated versus control APP animals were enriched for the ‘HIF-1 signalling pathway’, with enhancer regions also being enriched for HIF-1α binding motifs (Fig.4b and Extended Data Fig.8), in line with changes in H3K4me1 levels (Fig.4a) and the reported key role of HIF-1α in trained immunity and macrophage inflammatory responses4,21.
Active enhancers in microglia from 4xLPS-treated versus control APP animals only showed enrichment for the ‘Rap1 signalling pathway’, a pathway implicated in phagocytosis of opsonized targets22,23, again matching changes in H3K4me1 levels (Figs.4a/b). Strikingly, the comparison of microglia from APP animals that received the training- (1xLPS) and tolerance-inducing (4xLPS) stimuli, showed no pathway enrichment for active enhancers in 4xLPS-treated animals while enhancers in 1xLPS-treated animals were enriched for a large number of inflammation-related pathways, highlighting the differential effects of the two immune memory states. Finally, the comparison of microglia from vehicle-treated wildtype and APP animals demonstrated a small number of differentially activated enhancers with enrichment for the ‘thyroid hormone signalling pathway’ (including a putative active enhancer for Hif1a) as well as the ‘mTOR signalling pathway’ (Fig.4b), indicating that microglia are also epigenetically reprogrammed in response to brain pathology alone.
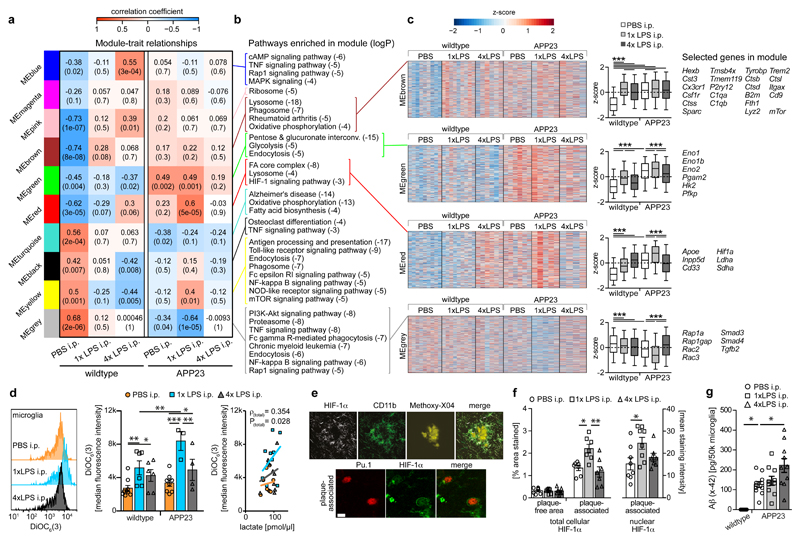
We next examined microglial mRNA levels under the same conditions to determine whether epigenetic alterations were reflected in gene expression levels (Supplementary Table3). First, we determined the concordance between 772 enhancers with significantly increased/decreased H3K27ac levels (Supplementary Table2) and the direction of change in the expression of their nearest gene. Indeed, there was a significant (albeit modest) concordance between alterations in H3K27ac levels and gene expression (median concordance of pairwise comparisons =58%, P=0.03). This suggested that gene expression is directly affected by the microglial active enhancer repertoire. Accordingly, weighted gene correlation network analysis (WGCNA24) revealed striking parallels to epigenetic changes (Figs.5a-c and Supplementary Table4). For example, the red module (MEred) contained the Hif1a gene, showed enrichment for the ‘HIF-1 signalling pathway’ and correlated strongly with the 1xLPS-treated APP group. Furthermore, gene expression in MEred was significantly upregulated in APP versus wildtype control animals and further increased by 1xLPS but downregulated by 4xLPS treatment.
Figure 5. Microglial gene expression and function 6 months after immune stimulation.
a, Weighted gene correlation network analysis (top: correlation coefficient; bottom: P-value; n=9,9,6,6,5,4 animals). b, Selected KEGG pathways enriched in modules. c, Heatmaps of genes within modules, z-scores (boxplot whiskers: 5-95th percentile; n=1601,990,949,3543 genes in modules) and selected genes. d, Microglial mitochondrial membrane potential (left/middle; n=9,6,6,8,3,4 animals) and Pearson’s correlation with lactate release (right; n=11,10,10 animals). e, Staining for top: HIF-1α, microglia (CD11b) and amyloid plaques (Methoxy-X04) and bottom: HIF-1α and microglial nuclei (Pu.1; single confocal plane) in brain sections from 9-month-old animals. Scale bars: 20/5 µm (top/bottom). f, Total cellular (n=7,7,7 animals) and nuclear (n=8,8,7 animals) HIF-1α staining intensity. g, Microglial Aβ content (n=5,11,10,10 animals). */**/*** P<0.05/0.01/0.001 for one-way ANOVA with Tukey correction. Data are means±s.e.m.
HIF-1α activation in inflammatory-stimulated macrophages can occur downstream of mitochondrial hyperpolarization; enhanced HIF-1α signalling in turn promotes glycolysis, measurable as lactate release25. Accordingly, the green module (MEgreen), which correlated positively with control and 1xLPS-treated APP groups but negatively with control and 4xLPS-treated wildtype groups, was found to be enriched in genes of the ‘glycolysis’ pathway. Microglial gene expression in MEgreen was upregulated in APP versus wildtype control animals and again further increased in APP animals by 1xLPS but decreased by 4xLPS treatment. Therefore, we analysed mitochondrial membrane potential and lactate release in microglia. Strikingly, microglia from 1xLPS-treated APP animals showed strongly increased mitochondrial membrane potential, which correlated positively with the release of lactate (Fig.5d), functionally corroborating the epigenetic and transcriptional alterations in trained microglia. Additionally, immunostaining confirmed higher protein levels of HIF-1α in plaque-associated microglia, which were further increased in 1xLPS-treated APP animals (Figs.5e/f). Thus, HIF-1α signalling and a metabolic switch to glycolysis are activated in response to cerebral β-amyloid deposition, and are enhanced by immune training but reduced by immune tolerance in microglia.
In contrast to MEred/green, MEgrey correlated positively with the control wildtype but negatively with control and 1xLPS-treated APP groups. Compared to wildtype controls, microglial gene expression in MEgrey was downregulated in APP control animals and further decreased by 1xLPS stimulation, but showed unchanged levels in 4xLPS-treated APP animals (Figs.5a-c). Importantly, MEgrey was enriched for phagocytosis-related pathways, including the ‘Rap1 signalling pathway’ (Figs.5a-c), again reflecting epigenetic changes (Fig.4). We therefore tested whether phagocytosis of Aβ was enhanced in 4xLPS-treated APP animals. Indeed, microglial Aβ content was increased ~1.75-fold in 4xLPS-treated compared to APP control animals (Fig.5g), providing further functional validation of the microglial enhancer repertoire and gene expression profiles.
Recent data indicate that context-specific microglial phenotypes exist, e.g. ‘disease-associated microglia’ (DAM26) and the ‘microglial neurodegenerative phenotype’ (MGnD27). Interestingly, the brown module (MEbrown), which was significantly upregulated by both LPS treatments in wildtype as well as in all APP groups, contained a number of homeostatic microglial genes (e.g. Hexb, Cx3cr1, Csf1r) but also all of the ‘stage 1 DAM’ core-genes except Apoe, as well as 4 of 12 ‘stage 2’ core-genes26 (Fig.5c). Of note, the gene encoding ApoE, which may be crucial for promoting a detrimental microglial phenotype27,28 was found in the same module as Hif1a (MEred). MEred also contained other genes genetically linked to AD risk, namely Cd33 and Inpp5d29, suggesting that HIF-1α may also be a detrimental modulator of AD pathology.
The epigenetic landscape of microglia has only been described under homeostatic conditions30–32. Our data now demonstrate epigenetic modifications in microglia in response to peripheral immune stimulation but also as a result of cerebral β-amyloidosis, including activation of the HIF-1α and mTOR pathways, and leading to transcriptional and functional alterations. While the global epigenetic and transcriptional changes were relatively modest, they were likely driven by a small number of microglia that received the required secondary immune stimulation, as evidenced for example by increased levels of HIF-1α in plaque-associated microglia (Fig.5). mTOR activation is a well-known event in early AD33 and was recently shown in microglia, where it activated HIF-1α and glycolysis to sustain microglial energy demand in AD models34. Our data now indicate that mTOR activation may be mediated by epigenetic microglial reprogramming in response to cerebral β-amyloidosis and that HIF-1α signalling downstream of mTOR could be a detrimental event, because augmentation or suppression of HIF-1α signalling occurred concomitantly with aggravated or alleviated Aβ deposition, respectively.
We here provide evidence of both immune training and tolerance in microglia and demonstrate their impact on neuropathology for the first time. While we cannot completely exclude that other cell-types contribute to immune memory and modulation of pathology in the brain, microglial-specific gene knockout of Tak1 or Hdac1/2 virtually abolished immune training (Fig.1), indicating that microglia are likely the major effectors of immune memory. Importantly, in our experiments, immune memory effects mostly became apparent following a secondary inflammatory stimulus, corroborating the concept of innate immune memory1,3. However, while in the periphery training may be beneficial due to enhanced pathogen elimination7,35,36, and tolerance may be detrimental due to higher rates of infection resulting from immune suppression5, we found that training promotes while tolerance alleviates neuropathology. This is consistent with the beneficial effects of preventing microglial pro-inflammatory responses in models of AD pathology and stroke12,37 and the worsening of cerebral β-amyloidosis in response to pro-inflammatory peripheral stimuli in animal models38. Similarly, immune training has recently been described in epithelial stem cells, where it promotes wound healing but may also underlie autoimmune disorders39. Thus, immune memory in the brain could conceivably affect the severity of any neurological disease that presents with an inflammatory component, but this will need to be studied for each individual condition.
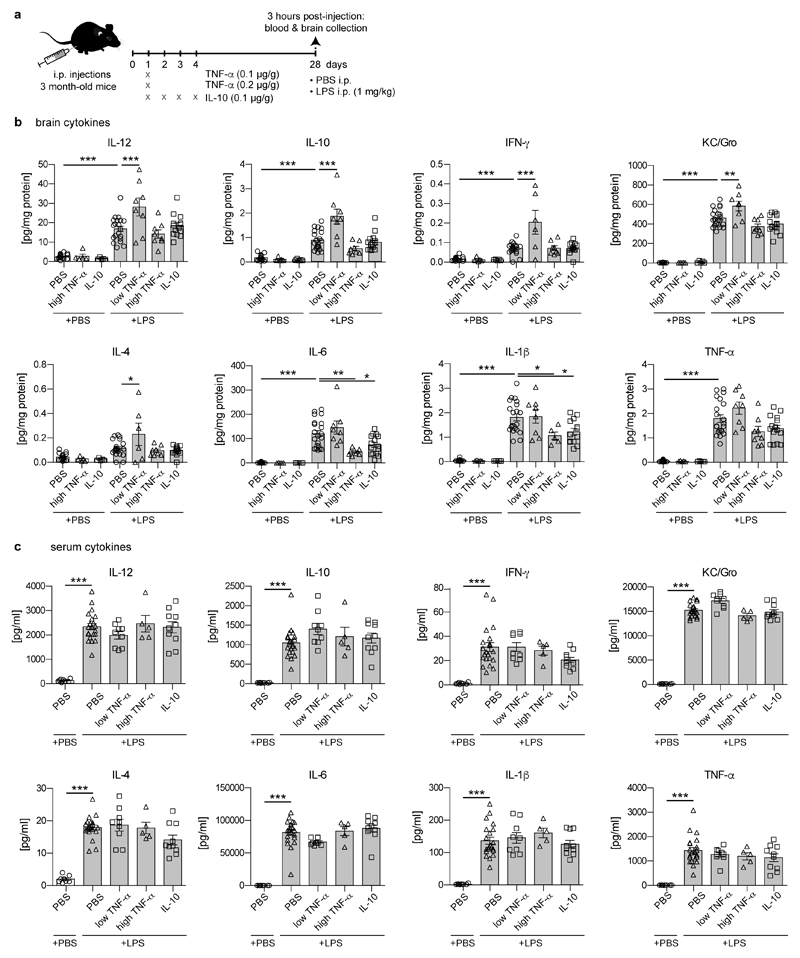
Our data provide proof-of-principle for innate immune memory in microglia, and while our different LPS injection paradigms may not necessarily model physiological stimuli, we found that individual cytokines applied peripherally may also elicit immune memory effects in the brain (Extended Data Fig.9). These results suggest that a wide variety of immune challenges may induce microglial immune memory and provide a possible mechanism for LPS-induced immune memory in the brain. It will be crucial to determine which other stimuli may lead to long-term modulation of microglial responses and thereby contribute to the severity of many neurological diseases.
Materials and Methods
Animals
For all experiments, 3 month-old hemizygous APP23 transgenic (C57BL/6J-Tg(Thy1-APPK670N;M671L)23), APP23 transgene-negative littermates or C57BL/6J (wildtype) mice (Jackson Laboratory) were used.
For experiments analysing immune responses after acute LPS and cytokine stimulation (see below), both male and female mice were used. For microglia-specific gene knockouts, CX3CR1-CreER animals were crossed with Tak1 fl/fl animals and Cre recombinase expression was induced by subcutaneous tamoxifen injections as previously described14. Similarly, microglial-specific knockout of Hdac1/2 was achieved after crossing CX3CR1-CreER animals (kindly provided by Dr. Steffen Jung (Weizman Institute, Rehovot) with a Hdac1/2 fl/fl line (kindly provided by Dr. Patrick Matthias; FMI Basel). Both Tak1 fl/fl and Hdac1/2 fl/fl were injected at 2-3 months of age and were incubated for four weeks without further treatment. Tamoxifen-injected CX3CR1-Cre negative littermates were used as controls (because responses in CX3CR1-Cre negative animals were indistinguishable in Hdac1/2 fl/fl and Tak1 fl/fl lines, pooled data are shown in Fig. 1).
As there is a significant gender effect on the pathology of both brain ischemia and cerebral β-amyloidosis,40,41 only female mice were used for the analyses of brain pathology. APP23 mice express a transgene consisting of human amyloid-β precursor protein (APP) with the KM670/671NL mutation under the Thy-1 promoter, and have been backcrossed with C57BL/6J mice for >20 generations. Female mice develop cerebral β-amyloid lesions in the neocortex around 6 months of age18.
Animals were maintained under specific pathogen-free conditions. All experiments were performed in accordance with the veterinary office regulations of Baden-Württemberg (Germany) and were approved by the Ethical Commission for animal experimentation of Tübingen and Freiburg, Germany.
Peripheral immune stimulation
3-month-old mice were randomly assigned to treatment groups and were injected intraperitoneally (i.p.) with bacterial lipopolysaccharides (LPS from Salmonella enterica serotype typhimurium, Sigma) at a daily dose of 500 µg/kg bodyweight. Animals received either four LPS injections on four consecutive days (4xLPS), a single LPS injection followed by three vehicle injections on the following three days (1xLPS) or four vehicle injections (PBS). Acute stimulation showed indistinguishable cytokine responses in wildtype and APP23 transgenic animals; Figure 1 shows the pooled data from both genotypes (see Extended Data Fig. 2 for data separated by genotype). Furthermore, as cytokine responses were indistinguishable in animals treated with 1/2/3/4xPBS, pooled data from all time points are shown.
For peripheral cytokine treatments, recombinant murine cytokines (TNF-α, IL-10; PeproTech) were aliquoted as by the manufacturer’s instructions and stored at -80°C until use. To determine whether a long-term change in the brain’s immune response (training or tolerance) occurred after peripheral cytokine injection, mice were treated on four consecutive days with 0.1 μg/g bodyweight IL-10 or once with 0.1/0.2 μg/g bodyweight TNF- α. Control mice received four vehicle injections (PBS). Four weeks later, cytokine- and control-treated mice received LPS (1 μg/g bodyweight) or PBS, and were prepared 3 hours after the injection.
At the specified time-points, animals were deeply anaesthetised using sedaxylan/ketamine (64 mg/kg//472 mg/kg), blood was collected from the right ventricle of the heart and animals were transcardially perfused with ice-cold PBS through the left ventricle. The brain was removed and sagitally separated into the two hemispheres, which were either fixed in 4% paraformaldehyde (PFA) or fresh-frozen on dry ice. Fresh-frozen hemispheres where homogenised using a Precellys® lysing kit and machine at 10 or 20% (w/v) in homogenisation buffer (50 mM Tris pH 8, 150 mM NaCl, 5 mM EDTA) containing phosphatase and protease inhibitors (Pierce). Fixed hemispheres were kept in 4% PFA for 24h, followed by cryoprotection in 30% sucrose in PBS, subsequently frozen in 2-methylbutane and coronally sectioned at 25 μm using a freezing-sliding microtome (Leica).
Focal brain ischemia
For the induction of a focal cortical stroke, we modified existing models of endothelin-1 (ET-1)-induced brain ischemia42 to avoid traumatic injury to the brain. Under anaesthesia and analgesia (Fentanyl, Midazolam, Medetomidin: 0.05//5//0.5 mg/kg bodyweight), 3-month-old animals were fixed in a stereotactic frame and a circular piece of skull was removed (5 mm diameter, centred on Bregma; as described in43). The dura mater was carefully removed with the help of a microhook (Fine Science Tools) and 5 µl of ET-1 (Bachem; 64 µM) in Hanks Buffered Salt Solution (Invitrogen) or vehicle solution was topically applied to the cortex and incubated for 10 min. The craniotomy was then covered with a 5 mm glass coverslip, which was fixed in place with dental cement (Hybond), the skin was sutured, then the mice received antidote (Flumazenil, Atipamezol: 0.5//2.5mg/kg bodyweight) and were health-monitored. Control mice underwent the same surgical procedure with application of vehicle solution to the cortex. After 4 weeks, animals were deeply anesthetized and prepared as described above.
Western Blotting analysis
For Western Blotting, total brain homogenates were sonicated 3x5 seconds (LabSonic, B. Braun Biotech), protein levels of the brain homogenates were quantified with a microplate bicinchoninic acid (BCA) assay (Pierce) and adjusted accordingly. Samples were then analysed on NuPage Bis-Tris gels (Invitrogen) using standard procedures. Proteins were transferred to nitrocellulose membranes, blocking was performed with 5% milk in PBS containing 0.05% Tween (PBST) for 1h and blots were incubated with mouse anti-Aβ (6E10; 1:1000, Covance) in PBST overnight at 4°C. Membranes were then probed with the secondary HRP-labelled antibodies (1:20,000, Jackson ImmunoLaboratories). Protein bands were detected using chemiluminescent peroxidase substrate (ECL prime, GE Healthcare). Densitometric values of the protein band intensities were analysed with the software package Aida v.4.27 and normalised to GAPDH intensities.
Immunostaining
Immunohistochemical staining was performed on free-floating sections using either Vectastain Elite ABC kits (Vector laboratories) or fluorescent secondary antibodies (Jackson Immunolaboratories). Unless otherwise noted, brain sections were blocked for 1h with 5% normal serum of the secondary antibody species, followed by primary antibody incubation overnight at 4°C. Primary antibodies used were: rabbit anti-Pu.1 (1:1000, Cell Signalling), rabbit anti-Iba1 (1:1,000; Wako; catalogue no. 019-19741), rabbit anti-GFAP (1:500, Biozol; catalogue no. Z0334), rabbit anti-Aβ (CN3; 1:2,00044), mouse anti-HIF-1α (1:500; Novus Biologicals, catalogue no. NB100-105, clone H1alpha67), rat anti-CD11b (1:2000; Millipore, catalogue no. MAB1387Z), rabbit anti-APP (antibody 5313 to the ectodomain of APP, 1:750; kind gift of Prof. Christian Haas, Munich). Sections were then washed and incubated with secondary antibodies. Cresylviolet and Congo Red staining was conducted according to standard procedures. Fluorescent plaque staining was achieved using Methoxy-X04 (4% vol of 10 mg/ml methoxy-X04 in DMSO, and 7.7% vol CremophorEL in 88.3% vol PBS) for 20 min, RT.
Images were acquired on an Axioplan 2 microscope with Axioplan MRm and AxioVision 4.7 software (Carl Zeiss). Fluorescent images were acquired using a LSM 510 META (Axiovert 200M) confocal microscope with an oil immersion 63X/1.4NA objective and LSM software 4.2 (Carl Zeiss), using sequential excitation of fluorophores. Maximum-intensity projections were generated using IMARIS 8.3.1 software (Bitmap).
For quantitative comparisons, sections from all groups were stained in parallel and analysed with the same microscope settings by an observer blinded to the treatment groups. To quantify the intensity of total microglial HIF-1α staining, high-resolution bright field images were acquired using fixed camera exposure time and lamp intensity and subsequently analysed with Fiji software. Colour channels were split and a fixed intensity threshold was applied to the red channel. On each image, the thresholded area over the total image area was calculated. Area fractions were measured on images of at least 9 plaques and 15 plaque-free regions per animal. To exclude an influence of plaque-size on microglial HIF-1α levels, plaques of similar size were selected for analysis of HIF-1α levels in the different treatment groups (average plaque size: PBS i.p.: 1.73±0.15, 1xLPS i.p.: 1.84±0.19, 4xLPS i.p. 2.27±0.39% Congo red area fraction).
For nuclear HIF-1α staining, a modified staining protocol was used. Briefly, sections were blocked with mouse Ig blocking reagent (Vector laboratories) for 1h, RT, followed by blocking with normal donkey serum for 1h, RT. Sections were then incubated overnight with mouse anti-HIF1α (clone mgc3, 1:50; Thermo Fisher Scientific, catalogue no. MA1-516) and rabbit anti-Pu.1 (1:250; New England Biolabs, catalogue no. 2258S. Clone 9G7), 4°C. To quantify the intensity of nuclear HIF-1α staining, z-stacks from 3 plaques and plaque-free regions per animal were acquired with the same microscope settings and subsequently analysed with IMARIS 8.3.1 software. Using the surfaces tool, a mask based on microglial nuclei was created using staining for Pu.1. A filter for area was applied to exclude background staining. The created surface was used to mask the HIF-1α channel. The mean masked HIF-1α intensity was then determined.
To quantify neuronal dystrophy, fluorescent images from 5-10 plaques per animal were acquired with the same microscope settings and subsequently analysed with Fiji software. Maximum intensity projections were generated to choose the region of interest consisting of APP-staining and the plaque. Fluorescence channels were split and intensity thresholds were applied to each channel. For every plaque, the thresholded area within the region of interest was calculated as a measure of plaque size and dystrophic area.
Stereological and morphological quantification
Stereological quantification was performed by a blinded observer on random sets of every 12th systematically sampled 25 μm thick sections throughout the neocortex. Analysis was conducted using the Stereologer software (Stereo Investigator 6; MBF Bioscience) and a motorized x-y-z stage coupled to a video microscopy system (Optronics). For quantification of total Pu.1- and GFAP-positive cells, the optical fractionator technique was used with three-dimensional dissectors as previously described45. For the quantification of plaque-associated cells, plaques were identified based on Congo Red staining and cells in their immediate vicinity were counted. Plaque load was determined by analysing the cortical area covered by Congo Red and/or anti-Aβ staining using the area fraction fractionator technique45. The volume of neuronal damage and microglial activation after brain ischemia was determined using the Cavalieri estimator technique.
For analysing microglial morphology, three images from three non-consecutive brain sections per animal were acquired from Iba-1 immunostained sections using identical camera acquisition settings, at 20X/0.5NA magnification. In order to perform the filament tracing in IMARIS (v.8.3.1), images were pre-processed in Fiji to optimise their contrast for reconstruction. The image background was subtracted using the in-built Fiji plugin to obtain an evenly distributed intensity and enhance contrast to the cells; subsequently the images were sharpened and their intensity was adjusted to the respective minimum and maximum histogram values. Filaments were then traced in IMARIS using the in-built Autopath algorithm. Reconstruction parameters were kept constant among all images; each cell was reconstructed as a 'filament' element in IMARIS, associated with a total length and volume.
ELISA
For quantification of Aβ by ELISA (Meso Scale Discovery) in brain homogenates or by SIMOA (Single Molecule Array, Quanterix) in isolated microglial cells, samples were pre-treated with formic acid (Sigma-Aldrich, final concentration: 70% vol/vol), sonicated for 35 seconds on ice, and centrifuged at 25,000g for 1 hour at 4°C. Neutralization buffer (1 M Tris base, 0.5 M Na2HPO4, 0.05% NaN3 (wt/vol)) was then added at a 1:20 ratio. Aβ was measured by an observer blinded to the treatment groups using human (6E10) Aβ triplex assay (Meso Scale Discovery, MSD) in brain homogenates or Simoa Human Abeta 42 2.0 Kit (Quanterix) in isolated microglia according to the manufacturer’s instructions.
Soluble APPβ containing the Swedish mutations (as present in the APP23 transgene) was measured using the sw soluble APPβkit (Mesoscale Discovery) following the manufacturer’s instructions after extraction with 1% Triton-X 100 and ultracentrifugation for 1h, 135,000g, 4 °C.
For cytokine measurements, brain homogenates were centrifuged at 25,000g for 30 minutes at 4°C. Supernatants were analysed using the mouse pro-inflammatory panel 1 V-plex plate (Mesoscale Discovery) according to the manufacturer’s instructions. To determine blood cytokines, serum was obtained by coagulation of whole blood in Vacuettes (Greiner Bio-One) for 10 min, RT, and centrifugation for 10 min, 2,000g. Serum samples were diluted 1:2 before measurements. The investigator was blinded to the treatment groups.
Measurements were performed on a Mesoscale Sector Imager 6000 or a Simoa HD-1 Analyzer. For analyses of brain homogenates, protein levels were normalised against total protein amount as measured by BCA protein assay (Pierce).
To determine levels of LPS in blood and brain homogenates, the Limulus Amebocyte Lysate assay was used according to the manufacturer’s instructions (Pierce LAL Chromogenic Endotoxin Quantitation Kit). Standards were prepared either in serum or brain homogenate from non-injected control animals. Serum samples were diluted 1:100 and brain homogenates 1:5 to eliminate matrix effects.
Isolation of microglia and fluorescence-activated cell sorting (FACS) analysis
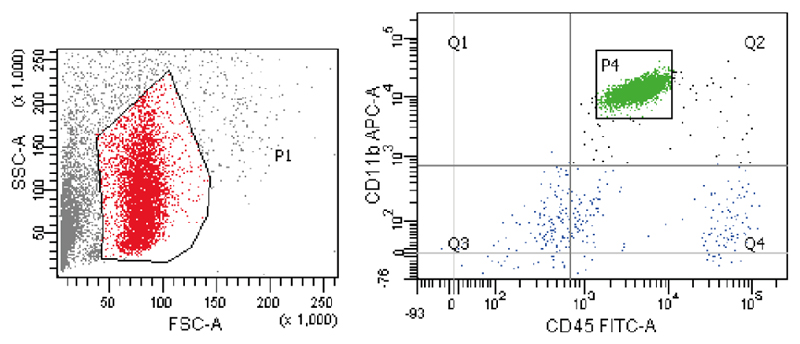
Fluorescence-activated cell sorting of microglia was performed based on CD11bhigh and CD45low as previously described9 (see also Extended Data Fig.6).
Assessment of microglial mitochondrial membrane potential and lactate release
To assess the microglial mitochondrial membrane potential, 10k microglia were sorted into 70 μl PBS. Cells were incubated at 37°C with 3,3'-Dihexyloxacarbocyanine Iodide, DiOC6(3) (Thermo Fisher Scientific) at a final concentration of 0.2 nM for 20 minutes. At this concentration, mitochondrial dye accumulation is largely dependent on the mitochondrial membrane potential, with only minor contributions of the plasma membrane potential46. After incubation, the cell suspension was diluted with ice-cold PBS and DiOC6(3) fluorescence was immediately acquired with a Sony SH800 instrument.
For the assessment of microglial lactate release, 50k microglia from the same animals as used for DiOC6(3) staining were plated in 96-well plates with 125 µl of macrophage serum-free medium (Thermo Fisher Scientific) and incubated for 24h at 37°C, 5% CO2. Lactate concentration in the media was determined using a Lactate Assay Kit (BioVision) following the manufacturer’s instructions and was correlated to DiOC6(3) fluorescence values from cells of the same animal using IBM SPSS Statistics 22 software.
RNA-sequencing
For RNA sequencing, 10k microglia were directly sorted into RNAse-free PCR strips containing 30 μl of H2O with 0.2% Triton-X and 0.8 U/μl RNAse inhibitor (Clontech) and samples were immediately frozen on dry ice. RNA was isolated using NucleoSpin RNA XS kit (Macherey-Nagel) according to the manufacturer’s instructions. 3 ng total RNA was used as input material for cDNA synthesis. cDNA synthesis and enrichment was performed following the Smart-seq2 v4 protocol as described by the manufacturer (Clontech). Sequencing Libraries were prepared with 1 ng of cDNA using the Nextera XT library preparation kit (Illumina) as described47. Multiplexing of samples was achieved using three different index-primers in each lane. For sequencing, samples from each group (APP and WT) were pooled to rule out amplification and sequencing biases. Libraries were quality-controlled and quantified using a Qubit 2.0 Fluorometer (Life Technologies) and Agilent 2100 Bioanalyzer (Agilent Technologies). Final library concentration of 2 nM was used for sequencing. Sequencing was performed using a 50 bp single read setup on the Illumina HiSeq 2000 platform.
Base calling from raw images and file conversion to fastq files were achieved by Illumina standard pipeline scripts (bcl2fastq v.2.18.0). Quality control was then performed using FASTQC (v.2.18.0) program (http://www.bioinformatics.babraham.ac.uk/projects/fastqc/), eliminating one sample which had less than 20 million reads. Reads were trimmed off for sequencing adaptor and were mapped to mouse reference transcriptome (mm10) using STAR aligner 2.5.2b with non-default parameters. Unique read counts were obtained for each sample using HOMER v.4.8 software (http://homer.salk.edu/homer/) and ‘maketagdirectory -tbp 1’ command, followed by ‘analyzeRepeats.pl rna mm10 -count exons -noadj -condenseGenes’. Raw read counts were imported into R (v.3.2) and normalized using the Bioconductor (v.3.2) DESeq2 package (v.1.10.1) using default parameter. After normalization, all transcripts having a maximum overall group mean lower than 10 were removed. Unwanted or hidden sources of variation, such as batch and preparation date, were removed using the sva package48. The normalized rlog transformed expression values were adjusted according to the surrogate variables identified by sva using the function removeBatchEffect from the limma package49. To determine gene clusters associated with wildtype or APP23 animals following i.p. injections of 1x or 4xLPS at 3 months of age, we then used the 13,627 present genes and applied the R implementation of the Weighted Gene Correlation Network Analysis (WGCNA). We then performed WGCNA clustering using the ‘1-TOMsimilarityFromExpr’ function with the network type "signed hybrid", a power parameter of 7 (as established by scale free topology network criteria), and a minimum module size of 50 dissecting the data into 10 modules. Finally, pathway enrichment analysis of genes within modules was performed using the ‘findmotifs.pl’ function of HOMER. Correction for multiple comparisons for KEGG pathway analyses was performed using the STATS package of R and applying Benjamini-Hochberg correction. To focus on the most important molecular pathways, only pathways with logP ≤-3 and at least 5 genes were considered.
Chromatin Immunoprecipitation, library preparation and analysis
For microglia isolation for chromatin purification, 1 mM sodium butyrate, an inhibitor of histone deacetylases30, was added to the dissection medium and FACS buffers. After staining, microglia were fixed in 1% PFA for 10 minutes at room temperature, followed by addition of glycine (final concentration: 125 mM) for 5 minutes and washing in HBSS. Microglia were then sorted into homogenisation buffer (0.32 M sucrose, 5 mM CaCl2, 5 mM MgAc2, 50 mM HEPES, 0.1 mM EDTA, 1 mM DTT, 0.1% vol/vol Triton-X-100) and centrifuged at 950 g for 5 minutes at 4 °C. The pellet was resuspended in 100 μl Nelson buffer (50 mM Tris, 150 mM NaCl, 20 mM EDTA, 1% vol/vol Triton-X-100, 0.5% vol/vol NP-40) and frozen on dry ice.
ChIP-sequencing was performed as previously described50, with slight modifications. In brief, two biological replicates were analysed for each condition and targeted histone modification. Cell lysates from 8-10 mice were pooled giving a total cell number of approximately 0.8-1 million cells per replicate. The cross-linked chromatin was sheared for 3x7 cycles (30 sec. On/Off) in a BioruptorPlus (Diagenode) to achieve an average fragment size of 350 bps. Proper shearing and chromatin concentration was validated by DNA isolation and quantification using a small amount of each sample individually. Samples were split in half and 1 µg of ChIP-grade antibody (H3K4me1: Abcam ab8895 or H3K27ac: Abcam ab4729) was added and incubated overnight at 4ºC. From each sample, 1% of the total volume was taken as input control prior to antibody binding. Immunoprecipitation was performed by incubating samples with 30 µl BSA-blocked protein A magnetic beads (Dynabeads, Invitrogen) for 1h at 4ºC. After purifying the precipitated chromatin and isolating the DNA, DNA libraries were generated using the Next Ultra DNA Library Prep Kit for Illumina and the Q5 polymerase (New England Biolabs). Multiplexing of samples was done using 6 different index-primers from the Library Prep Kit. For each replicate, samples from each condition (genotype and treatment) were pooled to rule out amplification and sequencing biases within the final data. Input samples were pooled and processed accordingly. The ideal number of amplification cycles was estimated via RealTime PCR to avoid over-amplification. Accordingly, samples were amplified for 13-15 cycles and the DNA was isolated afterwards. Individual libraries were pooled whereby each pool represented one whole batch of samples for each condition and targeted histone modification and was set to a final DNA concentration of 2 nM before sequencing (50 bp) on a HiSeq 2000 (Illumina) according to the manufacturer's instructions.
Base calling from raw images and file conversion to fastq files was achieved by standard Illumina pipeline scripts. Sequencing reads were then mapped to mouse reference genome (mm10) using rna-STAR aligner v2.3.0 with non-default parameters. Data were further processed using HOMER software (http://homer.salk.edu/homer/), following two recently published analyses on microglial epigenetic profiles30,31. Tag directories were created from bam files using ‘makeTagDirectory’ for individual samples and inputs, and peak calling was performed using ‘findpeaks -style histone’ with 4-fold enrichment over background and input, a Poisson p-value of 0.0001, and a peak width of 500 bp for H3K4me1 and 250 bp for H3K27ac. Peaks common to both replicates were determined using ‘mergepeaks’ (-prefix) function. To focus analysis on enhancers, peaks within ±2.5 kb of known TSS were filtered out. Union peak files for H3K4me1 and H3K27ac marks were then created for group-wise comparisons using ‘mergepeaks’ function. Active enhancers, i.e. genomic regions containing both H3K4me1 and H3K27ac peaks, were identified using the ‘window’ function of bedtools2 [51], requiring peaks of both marks to be located within a genomic region of 4 kb. Union peak files of active enhancers were then used for comparisons amongst groups for both H3K4me1 and H3K27ac marks using the ‘getDifferentialPeaks’ function (using a fold-change cut-off of 1.5 and a cumulative Poisson p-value of 0.0001). Finally, differential peaks were annotated using the ‘annotatepeaks.pl’ function, including gene ontology analysis. Correction for multiple comparisons for KEGG pathway analyses was performed using the STATS package of R and applying Benjamini-Hochberg correction. To focus on the most important molecular pathways, only pathways with logP ≤ -3 and at least three genes were considered.
For the generation of UCSC browser files, the ‘makeUCSCfile’ function was used, including normalisation to respective input and library size, with a resolution of 10 bp. Files for heatmaps of 24 kb genomic regions and with a resolution of 250 bp were generated using the ‘annotatePeaks.pl’ function; clustering was then performed using Gene Cluster 3.0 and visualised using JavaTreeView 1.16r4.
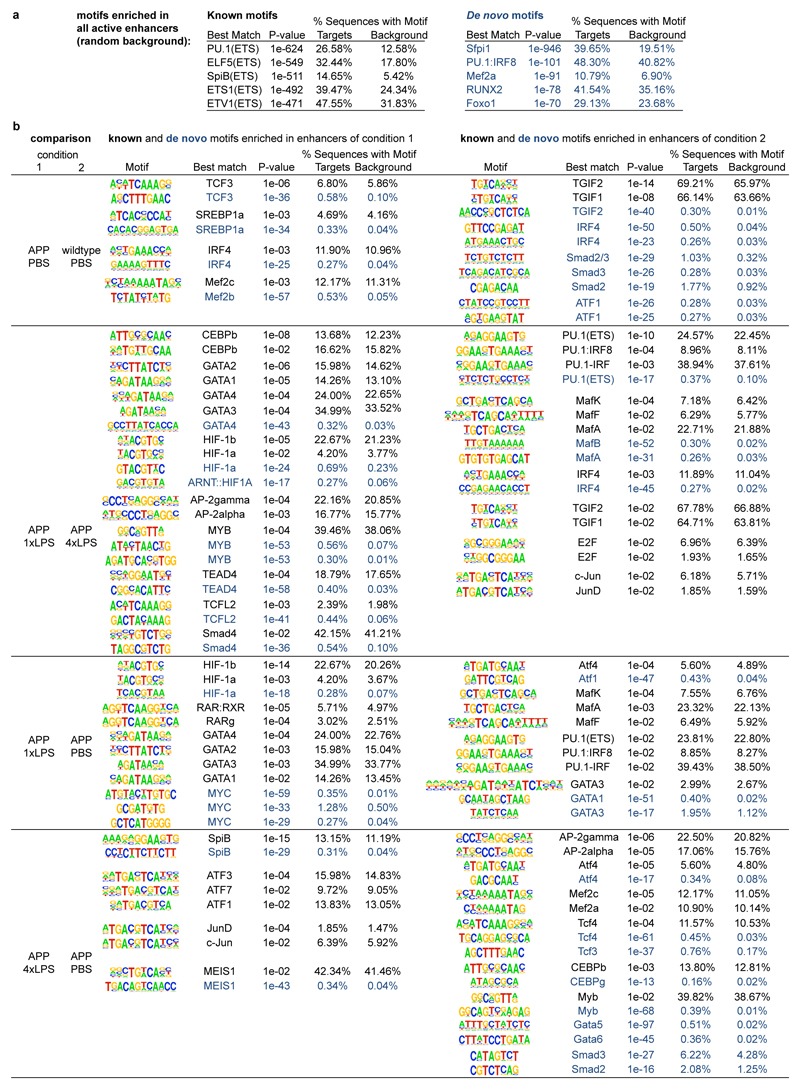
To identify transcription factors involved in the differential activation of enhancers, the ‘findMotifsGenome.pl’ command was used to analyse a region of 500 bp around enhancer peaks (-size 500), as this resulted in more robust identification of motifs for known microglial lineage-determining transcription factors when determining motifs of all identified microglial enhancers (Extended Data Fig.8). For all active enhancers, motif analysis was performed using the union H3K27ac peak file and standard background (i.e. random genomic sequence created by HOMER). In the case of pairwise comparisons amongst conditions, the first condition’s specific H3K27ac peak file was used as input and the second condition’s peak file as background. Because motif enrichment was often relatively low, we focussed on the most relevant results by determining transcription factor (families), whose motifs occurred at least twice in ‘known’ and ‘de-novo’ motifs.
Comparison between enhancer activation and gene expression
From our 14 pairwise comparisons (Fig.4, Extended Data Fig.7 and Supplementary Table 2), we analysed 772 differentially activated enhancers and compared increased/decreased H3K27ac levels with the direction of change in the expression of the nearest gene (difference in z-scores between the groups used for pairwise comparisons). The 14 concordance values were then statistically compared to chance level (50%) using a two-tailed Wilcoxon signed rank test.
Statistics and Reproducibility
Statistical analyses were performed using IBM SPSS Statistics 22 or Prism 5 software. Data were assessed for normal distribution (Shapiro-Wilk test) and statistical outliers using the ‘explore’ function. If the normality criterion was met, data were analysed using a one-way ANOVA (for experiments on single genotypes), followed by pairwise comparison (if P<0.05) with post-hoc Tukey correction (for samples with non-significant homogeneity of variance Levene’s test) or Dunnett test (if homogeneity of variances not given). For comparisons across treatments and genotypes (e.g. cytokine analyses in Fig.2), a two-way ANOVA was performed, followed by posthoc testing with Tukey correction for significant main effects (P<0.05). As the cytokine data for acute LPS stimulation (Fig.1) showed inequality of variance as well as skewedness, a non-parametric independent-samples median test was performed followed by pairwise comparison with correction for multiple comparison.
All experiments were performed at least twice and in independent batches of animals for key findings (figures show the pooled data). Due to batch-related variation in some dependent variables, ‘batch’ was added as a random variable to analyses where a significant batch effect was observed. For data sets with small sample size (e.g. Western Blotting analyses), the Kruskal-Wallis test was performed, followed by pairwise comparisons if P< 0.05. In the figure legends ‘n’ denotes the number of animals per treatment group. Minimum sample sizes were determined a priori using power analyses or as dictated by the methodology (e.g. ChIP-Seq).
Raw and processed data are provided in the Gene Expression Omnibus (accession number GSE82170; subseries GSE82168 for ChIP-Seq and GSE104630 for RNA-Seq datasets). Other data that support the findings of this study are available from the corresponding author upon reasonable request.
Extended Data
Extended Data Figure 1. Acute responses to LPS injections.
a, Weight changes after injection of lipopolysaccharides (LPS) (wildtype animals: n=11,11,11,11,4 for PBS, n=9,9,9,8,7 for 1xLPS, n=10,10,10,10,7 for 4xLPS; APP animals: n=14,14,14,14,7 for PBS, n=8,8,8,5,5 for 1xLPS; n=10,10,10,10,10 for 4xLPS; Cre animals n=5,5,4). b/c, Morphological changes in microglia (n=6,6,6,6,6 animals). Scale bar: 50 µm. d, Numbers of microglia and activated (GFAP+) astrocytes (microglia n=6,7,8,6,6 animals, astrocytes n=6,8,9,7,5 animals). e, Blood and brain levels of LPS after daily injections with 500 µg/kg bodyweight (n=4,3,3,3,3 animals). f, Assessment of iron entry from the blood (detected by Prussian Blue staining) shows positive staining in an aged (>25 months) APP transgenic animal, but not after repeated intraperitoneal LPS injections (n=3 mice analysed). g, In mice expressing red fluorescent protein (RFP) under the 'type 2 CC chemokine receptor’ (Ccr2) promoter, no entry of CCR2-expressing blood monocytes is detected after repeated LPS injection (staining for RFP; insert shows RFP-positive monocytes in the choroid plexus; n=3 mice analysed). Scale bar: 100 µm. Data are means±s.e.m. */**/*** P <0.05/0.01/ 0.001 for one-way ANOVA with Tukey correction.
Extended Data Figure 2. Cytokine response after acute LPS injections.
a, Additional cytokines (cp. Fig.1) analysed in the serum (top) and brain (bottom) 3h after each daily intraperitoneal lipopolysaccharide (LPS) injection on four consecutive days in 3-month-old mice (control animals received PBS injections; n=16,11,12,9,9,7,7 | 5,13,4,6,9,4,5 mice for groups from left to right). b/c, Cytokine response in the blood only in wildtype (b, n=6,7,8,5,5,3,3 animals) or APP23 (c, n=10,3,3,3,4,3,3 animals) mice. d/e, Cytokine response in the brain only in wildtype (d, n=6,7,8,5,5,3,3 animals) or APP23 (e, n=10,4,4,4,4,4,4 animals) mice. Data are means± s.e.m. */**/*** P <0.05/0.01/ 0.001 for independent-samples median test with correction for multiple comparisons.
Extended Data Figure 3. APP levels and processing, neuritic dystrophy and astrocyte activation in 9-month-old APP23 animals.
a/b, Micrograph of fluorescent staining for amyloid plaque (Methoxy-X04; green) and amyloid precursor protein (APP; red) shows neuritic dystrophy surrounding the amyloid deposit, which is unchanged by LPS treatments (b; n=5,5,5 animals). c, Overall Pearson’s correlation of plaque size with neuritic dystrophy (‘APP area’; n=49,39,42 plaques for PBS/1xLPS/4xLPS groups). d, Western Blotting analysis (for gel source data, see Supplementary Figure 1) of brain homogenates for amyloid precursor protein (APP) and C-terminal fragment-β (CTFβ; n=7,4,7 animals), and soluble APPβ ELISA (n=6,6,6 animals). e, Micrograph of activated astrocytes (glial fibrillar acidic protein: GFAP) surrounding an amyloid plaque (Congo Red) and quantification of the number of plaque-associated GFAP-positive astrocytes (n=6,6,5 animals). Scale bar: 10 µm in (a), 20 µm in (e). Data are means±s.e.m. * P <0.05 for one-way ANOVA with Tukey correction.
Extended Data Figure 4. Cytokine levels in 9-month-old animals.
a, Cytokine measurements in brain homogenates of 9-month-old wildtype (n=8,8,7 animals) and APP23 (n=14,10,10 animals) mice treated i.p. with 1x or 4xLPS at 3 months of age. b, Cytokine measurements in the serum of 9-month-old wildtype (WT; n=14,9,13 animals) and APP23 (APP; n=18,12,14 animals) mice after i.p. stimulation with 1x or 4xLPS at 3 months of age. c, Cytokine measurements in the serum of wildtype animals stimulated i.p. with 1x or 4xLPS at 3 months of age and re-stimulated with an additional LPS injection (500 µg/kg) at 9 months of age (n=10,7,10 animals). Data are means±s.e.m. */** P <0.05/0.01 for two-way ANOVA with Tukey correction. In (b) a significant main effect for genotype is indicated by bars spanning all conditions of the same genotype.
Extended Data Figure 5. Cytokine levels after brain ischemia and in blood of 4-month-old animals.
Three-month-old animals were i.p. injected with 1x or 4xLPS and incubated for 4 weeks before receiving a stroke. a, Cytokine measurements in brain homogenates 24h after stroke (n=5,7,5,5 animals). b, Cytokine measurements in the serum (n=6,6,6 animals). Data are means±s.e.m. *** P<0.001 for one-way ANOVA with Tukey correction.
Extended Data Figure 6. Microglial sorting strategy.
Microglia were sorted as CD11bhigh and CD45low cells (population P4) from 9-month-old APP23 animals or wildtype littermates following i.p. injections of 1x or 4xLPS at 3 months of age.
Extended Data Figure 7. Analysis of microglial enhancers.
Microglial enhancers were analysed in 9-month-old wildtype and APP23 (APP) mice treated intraperitoneally with 1x or 4xLPS at 3 months of age. a, Exemplary UCSC browser images of genomic region around the Hif1a gene (normalised to input and library dimension). b, Numbers of regions with differentially regulated H3K4me1 levels. c, Heatmaps of H3K4me1 regions (centred on H3K27ac peaks). d, Pairwise correlations between the two replicates of H3K4me1 read densities in differentially regulated regions. e-g, Analyses of H3K27ac levels analogous to (b-d) for H3K4me1. n=2 replicates (8-10 animals/replicate); differential enhancers showed a cumulative Poisson P-value <0.0001; Benjamini-Hochberg correction was applied for pathway enrichment.
Extended Data Figure 8. Transcription factor motif analysis of active enhancer regions.
Motif analysis was performed for selected conditions to identify transcription factors involved in the differential activation of enhancers (using putative enhancer regions present in both replicates within 500 bp around enhancer peaks). a, For all active enhancers, motif analysis was performed using the union H3K27ac peak file and standard background (random genomic sequence). b, Pairwise comparisons between conditions, using the first condition’s H3K27ac peak file as input and the second condition’s peak file as background. As motif enrichment was often relatively low, the analysis was focussed on transcription factor (families), whose motifs occurred at least twice in ‘known’ (black) and ‘de-novo’ motifs (blue). Motifs are identified by HOMER software using hypergeometric testing (no adjustment for multiple comparisons was made).
Extended Data Figure 9. Peripherally applied cytokines induce immune memory in the brain.
a, Experimental design. b, Cytokine responses in the brain, four weeks after peripheral cytokine application (n=17,5,5,21,8,8,15 animals). Note that TNF-α dose-dependently enhances (low dose) or decreases (high dose) certain cytokines. Similar to high dose TNF-α, certain cytokines are also reduced by peripheral application of IL-10 four weeks earlier. c, Cytokine responses in the periphery are unaffected (n=8,21,9,5,10 animals). Data are means±s.e.m. */**/*** P<0.05/0.01/0.001 for one-way ANOVA with Tukey correction.
Supplementary Material
Acknowledgements
We thank Patrizia Rizzu (DZNE Tuebingen) for experimental advice, Lary Walker (Emory University) for manuscript comments and Donna Bryce (Univ. Tuebingen) for statistical advice. This study was supported by a PhD fellowship of the Studienstiftung des Deutschen Volkes (A.C.W.), a Roman Herzog Fellowship of the Hertie Foundation (J.J.N.), and grants from the network ‘Neuroinflammation in Neurodegeneration’ (State of Baden-Wuerttemberg, Germany; M.J. and M.P.), the Sobek-Stiftung (M.P.), the DFG (SFB992, Reinhart-Koselleck-Grant to M.P., SFB704 to J.L.S.), the European Research Council (A.F.) the Fortüne Program (Med. Faculty, Univ. Tuebingen; 2075-1-0; J.J.N.), the Fritz Thyssen Foundation (Cologne, Germany; J.J.N.) and the Paul G. Allen Family Foundation (Seattle, USA; J.J.N.). M.B. and J.L.S are members of the Excellence Cluster ImmunoSensation.
Footnotes
Author Contributions:
K.D., A.C.W., J.W., P.R., L.M.H., K.W., A.S., T.B, O.S., M.D., J.J.N. performed microglial isolation, in vivo and ex vivo experiments and histological/biochemical analyses. M.G., L.K., G.J., T.P., V.C., R.I., C.K., A.F., M.B., T.U., J.L.S. and J.J.N. performed ChIP-Seq/RNA-Seq analyses. J.J.N conceived the study and coordinated the experiments together with M.J., A.F., M.P., M.B., J.L.S. and M.S.; J.J.N. wrote the manuscript, with contributions from all authors.
Author Information:
The authors have no competing financial interests.
References
- 1.Netea MG, Latz E, Mills KHG, O'Neill LAJ. Innate immune memory: a paradigm shift in understanding host defense. Nature Immunology. 2015;16:675–679. doi: 10.1038/ni.3178. [DOI] [PubMed] [Google Scholar]
- 2.Netea MG, et al. Trained immunity: A program of innate immune memory in health and disease. Science. 2016;352 doi: 10.1126/science.aaf1098. aaf1098. [DOI] [PMC free article] [PubMed] [Google Scholar]
- 3.Saeed S, et al. Epigenetic programming of monocyte-to-macrophage differentiation and trained innate immunity. Science. 2014;345 doi: 10.1126/science.1251086. 1251086. [DOI] [PMC free article] [PubMed] [Google Scholar]
- 4.Cheng SC, et al. mTOR- and HIF-1 -mediated aerobic glycolysis as metabolic basis for trained immunity. Science. 2014;345 doi: 10.1126/science.1250684. 1250684–1250684. [DOI] [PMC free article] [PubMed] [Google Scholar]
- 5.Biswas SK, Lopez-Collazo E. Endotoxin tolerance: new mechanisms, molecules and clinical significance. Trends in Immunology. 2009;30:475–487. doi: 10.1016/j.it.2009.07.009. [DOI] [PubMed] [Google Scholar]
- 6.Novakovic B, et al. b-Glucan Reverses the Epigenetic State of LPS- Induced Immunological Tolerance. Cell. 2016;167:1354–1368.e14. doi: 10.1016/j.cell.2016.09.034. [DOI] [PMC free article] [PubMed] [Google Scholar]
- 7.Kleinnijenhuis J, et al. Bacille Calmette-Guerin induces NOD2-dependent nonspecific protection from reinfection via epigenetic reprogramming of monocytes. Proceedings of the National Academy of Sciences of the United States of America. 2012;109:17537–17542. doi: 10.1073/pnas.1202870109. [DOI] [PMC free article] [PubMed] [Google Scholar]
- 8.Tay TL, et al. A new fate mapping system reveals context-dependent random or clonal expansion of microglia. Nature Neuroscience. 2017 doi: 10.1038/nn.4547. [DOI] [PubMed] [Google Scholar]
- 9.Füger P, et al. Microglia turnover with aging and in an Alzheimer's model via long-term in vivo single-cell imaging. Nature Neuroscience. 2017;20:1371–1376. doi: 10.1038/nn.4631. [DOI] [PubMed] [Google Scholar]
- 10.Prinz M, Priller J. Microglia and brain macrophages in the molecular age: from origin to neuropsychiatric disease. Nat Rev Neurosci. 2014;15:300–312. doi: 10.1038/nrn3722. [DOI] [PubMed] [Google Scholar]
- 11.Heneka MT, Kummer MP, Latz E. Innate immune activation in neurodegenerative disease. Nat Rev Immunol. 2014;14:463–477. doi: 10.1038/nri3705. [DOI] [PubMed] [Google Scholar]
- 12.Iadecola C, Anrather J. The immunology of stroke: from mechanisms to translation. Nature Medicine. 2011;17:796–808. doi: 10.1038/nm.2399. [DOI] [PMC free article] [PubMed] [Google Scholar]
- 13.Perry VH, Cunningham C, Holmes C. Systemic infections and inflammation affect chronic neurodegeneration. Nat Rev Immunol. 2007;7:161–167. doi: 10.1038/nri2015. [DOI] [PubMed] [Google Scholar]
- 14.Goldmann T, et al. A new type of microglia gene targeting shows TAK1 to be pivotal in CNS autoimmune inflammation. Nature Neuroscience. 2013;16:1618–1626. doi: 10.1038/nn.3531. [DOI] [PubMed] [Google Scholar]
- 15.Datta M, et al. HDAC1/2 are required for microglia identity during development, homeostasis and neurodegeneration in a context-dependent manner. Immunity. 2018 doi: 10.1016/j.immuni.2018.02.016. in press. [DOI] [PubMed] [Google Scholar]
- 16.Banks WA, Robinson SM. Minimal penetration of lipopolysaccharide across the murine blood-brain barrier. Brain, Behavior, and Immunity. 2010;24:102–109. doi: 10.1016/j.bbi.2009.09.001. [DOI] [PMC free article] [PubMed] [Google Scholar]
- 17.Saederup N, et al. Selective chemokine receptor usage by central nervous system myeloid cells in CCR2-red fluorescent protein knock-in mice. PLoS ONE. 2010;5:e13693. doi: 10.1371/journal.pone.0013693. [DOI] [PMC free article] [PubMed] [Google Scholar]
- 18.Sturchler-Pierrat C, et al. Two amyloid precursor protein transgenic mouse models with Alzheimer disease-like pathology. Proceedings of the National Academy of Sciences of the United States of America. 1997;94:13287–13292. doi: 10.1073/pnas.94.24.13287. [DOI] [PMC free article] [PubMed] [Google Scholar]
- 19.Ostuni R, et al. Latent Enhancers Activated by Stimulation in Differentiated Cells. Cell. 2013;152:157–171. doi: 10.1016/j.cell.2012.12.018. [DOI] [PubMed] [Google Scholar]
- 20.Kaikkonen MU, et al. Remodeling of the Enhancer Landscape during Macrophage ActivationIs Coupled to Enhancer Transcription. Molecular Cell. 2013;51:310–325. doi: 10.1016/j.molcel.2013.07.010. [DOI] [PMC free article] [PubMed] [Google Scholar]
- 21.Cramer T, et al. HIF-1alpha is essential for myeloid cell-mediated inflammation. Cell. 2003;112:645–657. doi: 10.1016/s0092-8674(03)00154-5. [DOI] [PMC free article] [PubMed] [Google Scholar]
- 22.Caron E, Self AJ, Hall A. The GTPase Rap1 controls functional activation of macrophage integrin alphaMbeta2 by LPS and other inflammatory mediators. Curr Biol. 2000;10:974–978. doi: 10.1016/s0960-9822(00)00641-2. [DOI] [PubMed] [Google Scholar]
- 23.Li Y, et al. Rap1a null mice have altered myeloid cell functions suggesting distinct roles for the closely related Rap1a and 1b proteins. J Immunol. 2007;179:8322–8331. doi: 10.4049/jimmunol.179.12.8322. [DOI] [PMC free article] [PubMed] [Google Scholar]
- 24.Langfelder P, Horvath S. WGCNA: an R package for weighted correlation network analysis. BMC Bioinformatics. 2008;9:559. doi: 10.1186/1471-2105-9-559. [DOI] [PMC free article] [PubMed] [Google Scholar]
- 25.Mills EL, et al. Succinate Dehydrogenase Supports Metabolic Repurposing of Mitochondria to Drive Inflammatory Macrophages. Cell. 2016;167:457–461.e14. doi: 10.1016/j.cell.2016.08.064. [DOI] [PMC free article] [PubMed] [Google Scholar]
- 26.Keren-Shaul H, et al. A Unique Microglia Type Associated with Restricting Development of Alzheimer’s Disease. Cell. 2017:1–33. doi: 10.1016/j.cell.2017.05.018. [DOI] [PubMed] [Google Scholar]
- 27.Krasemann S, et al. The TREM2-APOE Pathway Drives the Transcriptional Phenotype of Dysfunctional Microglia in Neurodegenerative Diseases. Immunity. 2017;47:566–581.e9. doi: 10.1016/j.immuni.2017.08.008. [DOI] [PMC free article] [PubMed] [Google Scholar]
- 28.Shi Y, et al. ApoE4 markedly exacerbates tau-mediated neurodegeneration in a mouse model of tauopathy. Nature. 2017:1–20. doi: 10.1038/nature24016. [DOI] [PMC free article] [PubMed] [Google Scholar]
- 29.Lambert JC, et al. Meta-analysis of 74,046 individuals identifies 11 new susceptibility loci for Alzheimer's disease. Nature Genetics. 2013;45:1452–1458. doi: 10.1038/ng.2802. [DOI] [PMC free article] [PubMed] [Google Scholar]
- 30.Gosselin D, et al. Environment drives selection and function of enhancers controlling tissue-specific macrophage identities. Cell. 2014;159:1327–1340. doi: 10.1016/j.cell.2014.11.023. [DOI] [PMC free article] [PubMed] [Google Scholar]
- 31.Lavin Y, et al. Tissue-resident macrophage enhancer landscapes are shaped by the local microenvironment. Cell. 2014;159:1312–1326. doi: 10.1016/j.cell.2014.11.018. [DOI] [PMC free article] [PubMed] [Google Scholar]
- 32.Gosselin D, et al. An environment-dependent transcriptional network specifies human microglia identity. Science. 2017;1617:eaal3222. doi: 10.1126/science.aal3222. [DOI] [PMC free article] [PubMed] [Google Scholar]
- 33.Wang C, et al. Targeting the mTOR signaling network for Alzheimer's disease therapy. Mol Neurobiol. 2014;49:120–135. doi: 10.1007/s12035-013-8505-8. [DOI] [PubMed] [Google Scholar]
- 34.Ulland TK, et al. TREM2 Maintains Microglial Metabolic Fitness in Alzheimer's Disease. Cell. 2017;170:649–656.e13. doi: 10.1016/j.cell.2017.07.023. [DOI] [PMC free article] [PubMed] [Google Scholar]
- 35.Kaufmann E, et al. BCG Educates Hematopoietic Stem Cells to Generate Protective Innate Immunity against Tuberculosis. Cell. 2018;172:176–190.e19. doi: 10.1016/j.cell.2017.12.031. [DOI] [PubMed] [Google Scholar]
- 36.Arts RJW, et al. BCG Vaccination Protects against Experimental Viral Infection in Humans through the Induction of Cytokines Associated with Trained Immunity. Cell Host Microbe. 2018;23:89–100.e5. doi: 10.1016/j.chom.2017.12.010. [DOI] [PubMed] [Google Scholar]
- 37.Heneka MT, Golenbock DT, Latz E. Innate immunity in Alzheimer's disease. Nature Immunology. 2015;16:229–236. doi: 10.1038/ni.3102. [DOI] [PubMed] [Google Scholar]
- 38.O'Banion MK. Does peripheral inflammation contribute to Alzheimer disease? Evidence from animal models. Neurology. 2014;83:480–481. doi: 10.1212/WNL.0000000000000663. [DOI] [PubMed] [Google Scholar]
- 39.Naik S, et al. Inflammatory memory sensitizes skin epithelial stem cells to tissue damage. Nature. 2017;550:475–480. doi: 10.1038/nature24271. [DOI] [PMC free article] [PubMed] [Google Scholar]
- 40.Liu F, Yuan R, Benashski SE, McCullough LD. Changes in experimental stroke outcome across the life span. Journal of Cerebral Blood Flow & Metabolism. 2009;29:792–802. doi: 10.1038/jcbfm.2009.5. [DOI] [PMC free article] [PubMed] [Google Scholar]
- 41.Sturchler-Pierrat C, Staufenbiel M. Pathogenic mechanisms of Alzheimer's disease analyzed in the APP23 transgenic mouse model. Annals of the New York Academy of Sciences. 2000;920:134–139. doi: 10.1111/j.1749-6632.2000.tb06915.x. [DOI] [PubMed] [Google Scholar]
- 42.Neher JJ, et al. Phagocytosis executes delayed neuronal death after focal brain ischemia. Proceedings of the National Academy of Sciences. 2013;110:E4098–107. doi: 10.1073/pnas.1308679110. [DOI] [PMC free article] [PubMed] [Google Scholar]
- 43.Hefendehl JK, et al. Repeatable target localization for long-term in vivo imaging of mice with 2-photon microscopy. Journal of Neuroscience Methods. 2012;205:357–363. doi: 10.1016/j.jneumeth.2011.10.029. [DOI] [PubMed] [Google Scholar]
- 44.Eisele YS, et al. Peripherally Applied Aβ-Containing Inoculates Induce Cerebral β-Amyloidosis. Science. 2010;330:980–982. doi: 10.1126/science.1194516. [DOI] [PMC free article] [PubMed] [Google Scholar]
- 45.Varvel NH, et al. Replacement of brain-resident myeloid cells does not alter cerebral amyloid-β deposition in mouse models of Alzheimer's disease. Journal of Experimental Medicine. 2015;212:1803–1809. doi: 10.1084/jem.20150478. [DOI] [PMC free article] [PubMed] [Google Scholar]
- 46.Rottenberg H, Wu S. Quantitative assay by flow cytometry of the mitochondrial membrane potential in intact cells. Biochim Biophys Acta. 1998;1404:393–404. doi: 10.1016/s0167-4889(98)00088-3. [DOI] [PubMed] [Google Scholar]
- 47.Picelli S, et al. Full-length RNA-seq from single cells using Smart-seq2. Nature Protocols. 2014;9:171–181. doi: 10.1038/nprot.2014.006. [DOI] [PubMed] [Google Scholar]
- 48.Leek JT, Johnson WE, Parker HS, Jaffe AE, Storey JD. The sva package for removing batch effects and other unwanted variation in high-throughput experiments. Bioinformatics. 2012;28:882–883. doi: 10.1093/bioinformatics/bts034. [DOI] [PMC free article] [PubMed] [Google Scholar]
- 49.Ritchie ME, et al. limma powers differential expression analyses for RNA-sequencing and microarray studies. Nucleic Acids Res. 2015;43:e47. doi: 10.1093/nar/gkv007. [DOI] [PMC free article] [PubMed] [Google Scholar]
- 50.Halder R, et al. DNA methylation changes in plasticity genes accompany the formation and maintenance of memory. Nature Neuroscience. 2016;19:102–110. doi: 10.1038/nn.4194. [DOI] [PubMed] [Google Scholar]
- 51.Quinlan AR. BEDTools: The Swiss-Army Tool for Genome Feature Analysis. Curr Protoc Bioinformatics. 2014;47:11.12.1–34. doi: 10.1002/0471250953.bi1112s47. [DOI] [PMC free article] [PubMed] [Google Scholar]
Associated Data
This section collects any data citations, data availability statements, or supplementary materials included in this article.


