Abstract
Kaposi’s sarcoma-associated herpesvirus (KSHV) causes Kaposi’s sarcoma1,2, a cancer that commonly affects patients with AIDS3 and which is endemic in sub-Saharan Africa4. The KSHV capsid is highly pressurized by its double-stranded DNA genome, as are the capsids of the eight other human herpesviruses5. Capsid assembly and genome packaging of herpesviruses are prone to interruption6–9 and can therefore be targeted for the structure-guided development of antiviral agents. However, herpesvirus capsids—comprising nearly 3,000 proteins and over 1,300 Å in diameter—present a formidable challenge to atomic structure determination10 and functional mapping of molecular interactions. Here we report a 4.2 Å resolution structure of the KSHV capsid, determined by electron-counting cryo-electron microscopy, and its atomic model, which contains 46 unique conformers of the major capsid protein (MCP), the smallest capsid protein (SCP) and the triplex proteins Tri1 and Tri2. Our structure and mutagenesis results reveal a groove in the upper domain of the MCP that contains hydrophobic residues that interact with the SCP, which in turn crosslinks with neighbouring MCPs in the same hexon to stabilize the capsid. Multiple levels of MCP–MCP interaction—including six sets of stacked hairpins lining the hexon channel, disulfide bonds across channel and buttress domains in neighbouring MCPs, and an interaction network forged by the N-lasso domain and secured by the dimerization domain—define a robust capsid that is resistant to the pressure exerted by the enclosed genome. The triplexes, each composed of two Tri2 molecules and a Tri1 molecule, anchor to the capsid floor via a Tri1 N-anchor to plug holes in the MCP network and rivet the capsid floor. These essential roles of the MCP N-lasso and Tri1 N-anchor are verified by serial-truncation mutageneses. Our proof-of-concept demonstration of the use of polypeptides that mimic the smallest capsid protein to inhibit KSHV lytic replication highlights the potential for exploiting the interaction hotspots revealed in our atomic structure to develop antiviral agents.
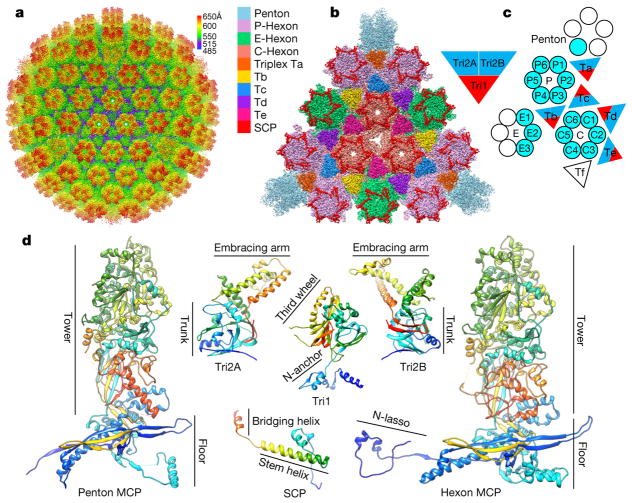
We purified intact KSHV virions and used electron-counting cryo-electron microscopy (cryo-EM) to obtain a 4.2 Å resolution capsid structure (Fig. 1a, Extended Data Figs 1–4, Supplementary Video 1). The T = 16 icosahedral capsid contains MCP pentamers (pentons) and hexamers (hexons) decorated with the smallest capsid protein (SCP), and joined by heterotrimeric triplexes (Ta–Tf) composed of a Tri1 and two Tri2 proteins (Fig. 1b). We built atomic models for a total of 46 unique conformers of the four capsid proteins: 15 hexon MCPs, 1 penton MCP, 15 hexon SCPs, 5 Tri1 proteins and 10 Tri2 proteins (Fig. 1c, d, Extended Data Table 1, Extended Data Fig. 2d), with approximately 26,000 amino acid residues in total.
Figure 1. Cryo-EM reconstruction and atomic modelling of KSHV capsid.
a, Radially-coloured cryo-EM density map of KSHV capsid viewed along a three-fold axis. b, Zoomed in view of one facet of the icosahedral capsid. Densities of triplex Tf and penton SCP are not displayed. c, Schematic of one asymmetric unit (shaded) of the capsid. The inset illustrates the heterotrimeric nature of a triplex. d, Atomic models of individual capsid proteins in ribbon representation in rainbow colours, from the N terminus (blue) to the C terminus (red).
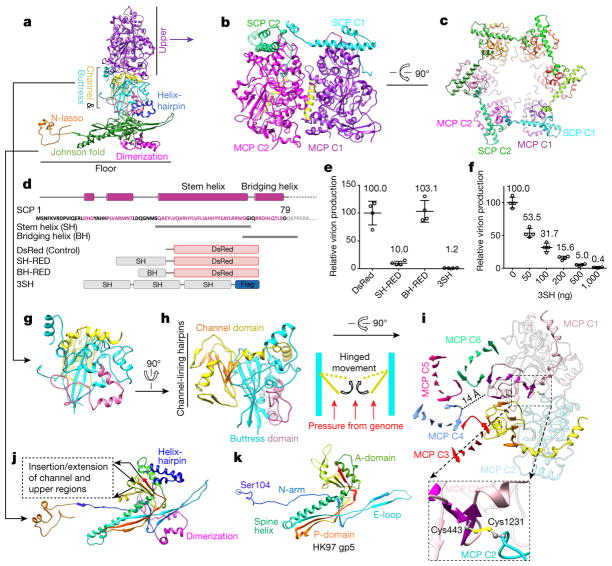
The 1,376-amino-acid MCP subunit is L-shaped: it is hinged, with a ‘tower’ and a ‘floor’ component (Fig. 2a, Supplementary Video 2). The tower contains the upper, channel and buttress domains, and the floor is made up of the bacteriophage HK97-like domain (the Johnson fold)11, helix-hairpin domain, dimerization domain and N-lasso domain. The Johnson fold is characterized by a central five-stranded β-sheet, elaborated by a long ‘spine helix’ and an extended ‘E-loop’ (Fig. 2j, k). It was first discovered in bacteriophage HK97 capsid protein gp5 (ref. 12), and subsequently in many other bacteriophages13–16, the herpes simplex virus type 1 (HSV-1)17, and even bacteria and archaea18,19, though the topology of the joining of the strands of the central β-sheet varies between these groups14. The KSHV Johnson-fold domain possesses the same strand-joining topology as HK97 gp5 (Fig. 2j, k).
Figure 2. Structures of MCP and SCP.
a, Domain organization in a hexon MCP. b, c, Adjacent MCPuds interact around a major helix (yellow in b) and are crosslinked by SCPs in hexons. d–f, Design of SCP-mimicking polypeptides (d) and results of experiment investigating their potential for inhibiting KSHV lytic replication (e, f). Expression of polypeptides containing the SCP stem helix inhibits KSHV virion production (e) in a dose-dependent fashion (f). Data are mean ± s.e.m. (n = 4 biologically independent samples). Red, DsRed fragment; SH-RED, fusion protein of stem helix and DsRed fragment; BH-RED, fusion protein of bridging helix and DsRed fragment. g–i, Structure of the MCP channel and buttress domains. The buttress domain supports the channel domain (g, h), and contributes Cys1231 to form a disulfide bond with Cys443 in the channel domain of an adjacent MCP (i, inset). j, k, Structure of the Johnson-fold domain (j; with helix-hairpin in dark blue and dimerization in magenta) in the KSHV MCP floor compared with that of bacteriophage HK97 gp5 (k).
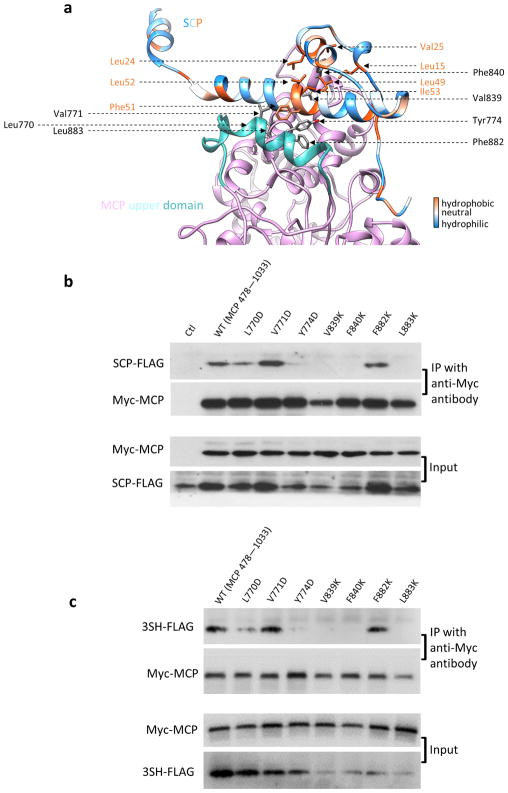
Among the capsid proteins of the more than 100 known herpesviruses, the only published atomic structure is that of the HSV-1 MCP upper domain (MCPud) determined by X-ray crystallography20. The structures of MCPud from KSHV and HSV-1 are similar21, as are the interactions between neighbouring MCPuds mediated by the ‘major helix’ (yellow in Fig. 2b). However, a loop (amino acids 767–781) in the HSV-1 MCPud is replaced by a helix (amino acids 763–778, cyan in Extended Data Fig. 5a) in KSHV MCP, which produces a groove into which an SCP binds. Our atomic model of SCP consists of an N-terminal loop, two short helices, a stem helix and a bridging helix, and is folded like the treble clef symbol (Fig. 1d). The stem helix binds the groove of one MCP and, in hexons, the bridging helix crosslinks to a neighbouring MCP (Fig. 2b, c). Our previous SCP-deletion mutagenesis of KSHV demonstrated the role of SCP crosslinking in the production of virions that contain DNA8. Although there is no SCP bound to penton MCP in HSV-1 (ref. 22), we clearly observed an SCP bound to each penton MCP in KSHV, albeit without crosslinking. Our model indicates that MCP–SCP interactions involve a series of hydrophobic residues (such as Tyr774, Val839, Phe840 and Leu883) on MCP. In particular, Phe840 of MCP inserts into a hydrophobic pocket formed by Leu15, Leu24, Val25, Leu49, Leu52 and Ile53 of SCP; Tyr774 of MCP has an aromatic–aromatic interaction (π-stacking) with Phe51 of SCP (Extended Data Fig. 5a). Using co-immunoprecipitation, we investigated point mutations expressed in the KSHV MCPud (amino acids 478–1,033) that replaced these hydrophobic residues with hydrophilic residues; this abolished in vitro MCP–SCP interactions. However, in three other residues that are not in close proximity to SCP, the same type of point mutations did not affect MCP–SCP binding (Extended Data Fig. 5b). This corroboration of our structural and functional data establishes the key residues involved in MCP–SCP binding that can be targeted for intervention (Fig. 2d–f).
The MCP buttress domain provides a vertical architectural support for the MCPud and a horizontal architectural support for the MCP channel domain that constricts the capsomer channel (Fig. 2a). The buttress domain features a four-stranded β-sheet and a helix-rich periphery (Fig. 2g, h). The channel domain fashions a six-stranded β-sheet, which is flanked by three channel-lining hairpins and by a three-helix arm that latches onto the buttress domain (Fig. 2h, i). Within each MCP, the β-sheets from the buttress and the channel domains form a β-sandwich (Fig. 2h). Across adjacent MCPs in a hexon, the six-stranded β-sheet of one channel domain is augmented by a β-strand from a channel domain of an adjacent MCP; this β-strand is also connected via a loop to the six-stranded β-sheet of this adjacent MCP. In this way, six β-sheets are joined together to form a turbine-shaped ring in each hexon, and their connecting loops constrict the hexon channel to 14 Å in diameter (Fig. 2i). Because two of the three channel-lining hairpins point inwards, if the pressurized DNA genome should ever reach and propel these hairpins, any hinged outward movement of these hairpins would produce a more constricted channel and thus prevent DNA leakage (Fig. 2h, inset). Six disulfide bonds formed between Cys443 and Cys1231 across neighbouring MCPs (Fig. 2i, inset) further secure the wall of the hexon channel.
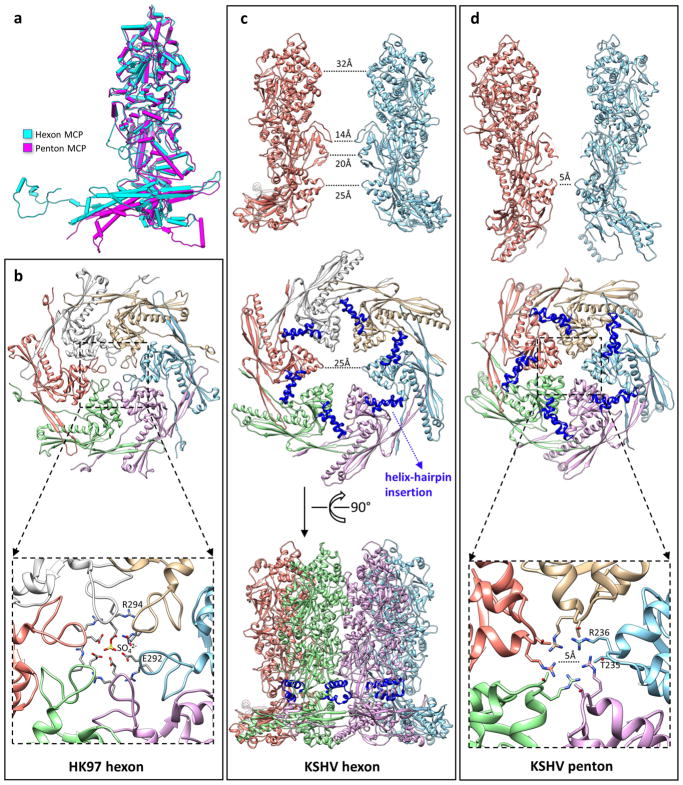
When the tower region of penton MCP is superposed with that of hexon MCP, its floor region is tilted approximately 15° towards the capsid centre (Extended Data Fig. 6a, Supplementary Video 3), which is consistent with the more angular geometry of the capsid at five-fold vertices. This hinged movement narrows the penton channel to 5 Å in diameter at the floor level, in contrast to 25 Å at the corresponding position in hexon channel (Extended Data Fig. 6b–d), and separates neighbouring penton MCP tower regions from one another, producing the ‘blossoming’ shape and flexible nature of the penton tower.
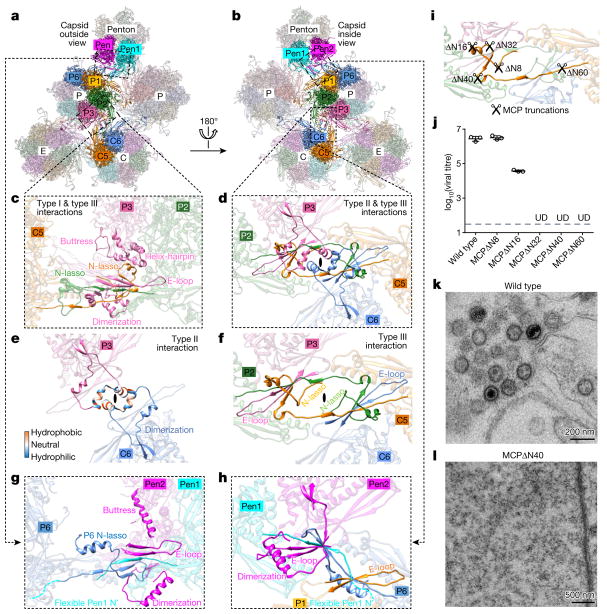
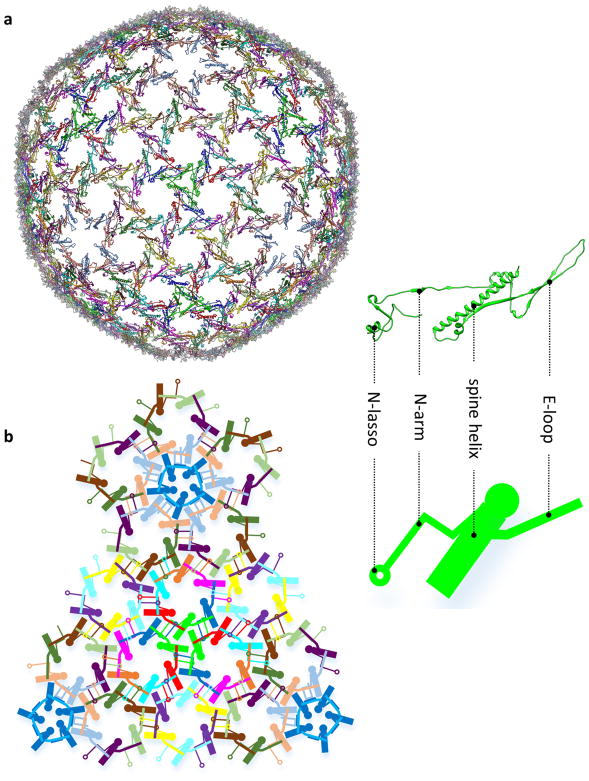
Notwithstanding extensive interactions in the MCP tower, three types of network interactions in the MCP floor are the defining features that give rise to the mechanical sturdiness of the KSHV capsid (Fig. 3a–f, Supplementary Videos 4, 5, Extended Data Fig. 7). The type I interaction is intracapsomeric β-augmentation between adjacent MCPs, as exemplified by P2 and P3 MCPs in Fig. 3c: two β-strands in the N-arm of P2 join two β-strands in the E-loop and one β-strand in the dimerization domain of P3 to form a five-stranded β-sheet. Type II and type III interactions are intercapsomeric interactions among two pairs of MCPs, such as P2–P3 and C5–C6 in Fig. 3d. To form a type III interaction, the N-lasso of C5 extends and lashes around the P2 N-arm and P3 E-loop (Fig. 3c, f), which are participants in a type I interaction. In addition, the C5 N-lasso contributes two β-strands to augment the existing five-stranded β-sheet from the type I interaction of P2 and P3, which produces a seven-stranded β-sheet (Fig. 3c). In this regard, type III interactions build upon and probably strengthen type I interactions. Finally, the short helix in the C5 N-lasso has hydrogen-bond interactions with the P3 helix-hairpin domain and an elbow-like helix–turn–helix structure in the P3 buttress domain, which further secures the C5 N-lasso in place. In turn, this C5 N-lasso serves as a fulcrum for the P3 elbow-like helix–turn–helix structure to support the P3 MCP tower (Fig. 3c). Related by the local two-fold axis, another type III interaction is formed by the P2 N-lasso that lashes around the C5 N-arm and C6 E-loop (Fig. 3f). A type II interaction is formed by two helices from each dimerization domain of P3 or C6 MCP that pair with one another around the local two-fold axis with hydrophobic residues (Fig. 3e). From inside the capsid, this type II interaction appears to act as a pair of ‘snap buttons’ that sit atop the C5 and P2 N-lassoes, prevent their N termini from unwinding and thus lock them in position (Fig. 3d). Therefore, each type II interaction also secures a pair of type III interactions. One can imagine that the force exerted by the DNA genome on the dimerization domains would make the underlying N-lassoes more resistant to unwinding.
Figure 3. Network interactions in the MCP floor and function of MCP N-lasso.
a, b, Part of the MCP network viewed from outside (a) or inside (b) the capsid. Pen1 and Pen2 are two of the five MCP subunits in the penton that have the same structure owing to five-fold symmetry of the penton. c–f, Three types of network interaction among hexon MCPs; e and f represent decomposition of structures in d. Type I interactions are intracapsomeric augmentations of β-strands from adjacent MCPs (P2 and P3 in c). Type II and type III interactions are intercapsomeric interactions among two pairs of MCPs (P2–P3 and C5–C6 in d), diagonally across the local two-fold axis (black ovals in d–f). Type III interactions build upon and fortify type I interactions (C5 N-lasso in c). The two dimerization domains that are joined in a type II interaction (e) also sit on top of (from the perspective of inside of the capsid) a pair of type III interactions (d) and prevent the two N-lassoes (C5 and P2 N-lassoes in d and f) from unwinding. g, h, Interactions between penton MCPs and the P1 and P6 hexon MCPs are different from the canonical hexon MCP network interactions (shown in c and d). An elbow-like helix–turn–helix structure in the buttress domain of hexon MCP is folded into a single long helix in penton MCP (see c and g). i, Design of serial-truncation mutageneses in the MCP N-lasso region. j, Comparison of viral titres of wild type and MCP-truncated mutants. Data are mean ± s.e.m. (n = 3 biologically independent samples). UD, undetectable. k, l, Transmission electron microscopy images of ultrathin sections of cells replicating the wildtype virus (k) or the MCPΔ N40 mutant (l). Experiments were repeated independently twice with similar results.
As with other herpesviruses23,24, in KSHV the network interactions that surround pentons are different from those of hexons (Fig. 3g, h, Supplementary Video 3). First, the penton MCP has an N terminus that is flexible, rather than one that lashes around the P1–P6 hexon MCP pair as occurs in a canonical type III interaction (Fig. 3g, h). The N-lasso of P6 MCP, which is supposed to lash a pair of penton MCPs, also refolds into a conformation that effectively eliminates its lassoing ability (Fig. 3g). Therefore, a penton neither lashes nor is lashed by adjacent hexons. Second, the dimerization domain of penton MCP adopts a configuration that makes it unable to form type II interactions with the dimerization domain of P1 hexon MCP (Fig. 3h), which renders the P1 dimerization domain flexible. Instead, the refolded dimerization domain of penton MCP contributes one β-strand and the refolded N-lasso of P6 MCP contributes two β-strands—that join the N-arm and E-loop of two penton MCPs—to form a six-stranded β-sheet. This effectively glues the penton together with its surrounding P-hexons (Fig. 3g, h). Finally, the penton MCP has a long straight helix in its buttress domain (Fig. 3g) that is refolded from the elbow-like helix–turn–helix structure in hexon MCP (pink in Fig. 2g). This conformational change enables the helix to regain contact with the floor to ‘buttress’ the penton MCP tower without the P6 N-lasso serving as a fulcrum (Fig. 3c, g).
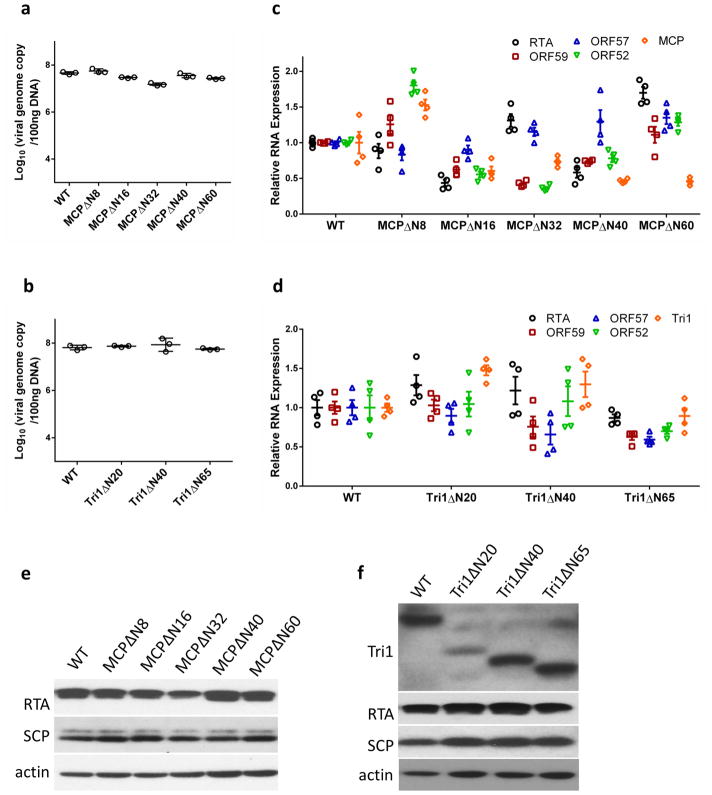
Of the three types of network interaction, type III—the lashing interaction by the N-lasso—is probably the most important. To investigate its role, we mutated the 60 residues of the N terminal of MCP that encompass the N-lasso and observed the consequences in both viral lytic replication and capsid formation (Fig. 3i–l, Extended Data Fig. 8a, c, e). Removing eight residues from the N terminus of MCP, which retains the N-lasso structure, did not affect viral propagation. By contrast, removing 16 residues from the N terminus of MCP, which renders the N-lasso incomplete, produced a 98.7% decrease in viral titre. Removing 32, 40 or 60 residues, which completely abolishes the N-lasso, reduced virion production to undetectable levels (Fig. 3i, j). Moreover, removing 40 residues of the N terminal (MCPΔ N40) completely abolished capsid assembly (Fig. 3k, l). Together with the above structural analyses, these results establish that the N-lasso of MCP is essential for capsid assembly.
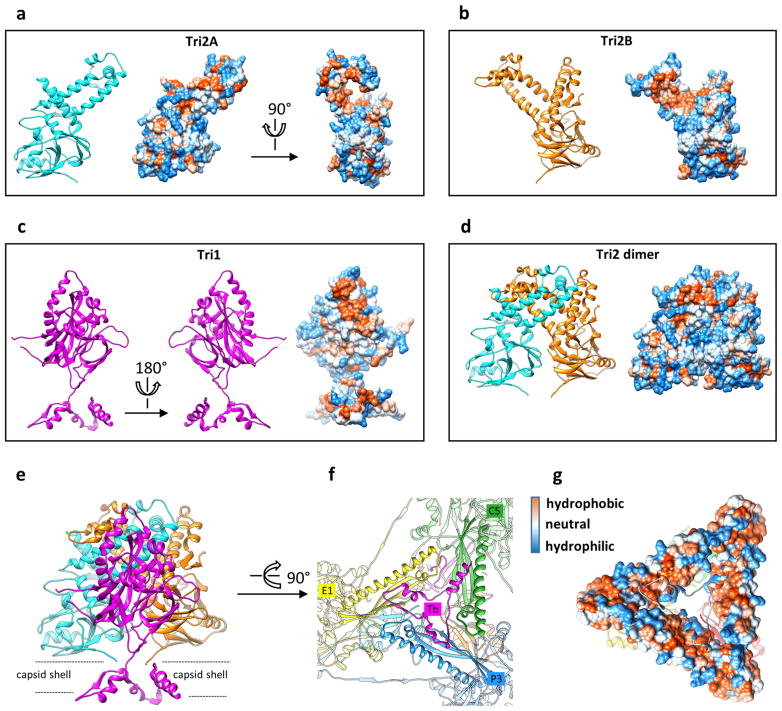
The interaction network of the MCP floor is perforated with holes in the canyons among the towering capsomers, at local or icosahedral three-fold axes. These holes are plugged by triplexes (Fig. 4a, b). Each triplex is a heterotrimer of a Tri1 and two conformers of Tri2—Tri2A and Tri2B (Fig. 4c–f, Supplementary Video 6). Each Tri2 monomer has a β-sheet-rich trunk domain (amino acids 2–141, 283–305) and a helix-rich ‘embracing’ arm domain (142–282). Tri2A and Tri2B embrace one another to form a dimer (Fig. 4i), which is accommodated by conformational changes in their embracing arm domains (Fig. 4g, Supplementary Video 7). This embracing interaction involves large patches of hydrophobic residues (Extended Data Fig. 9a–d) and two disulfide bonds that are formed between Cys212 of one conformer and Cys222 of the other (Fig. 4i). Supporting the embracing Tri2A–Tri2B dimer is the ‘third-wheel’ domain of the Tri1 monomer, which is structurally similar to the trunk domain of Tri2 (Fig. 4h). The N-terminal region of Tri1 penetrates the capsid floor and folds into a tripod-shaped daisy-chain of helices (the N-anchor) that binds to three hydrophobic grooves formed by the spine helix and its associated β-sheet in the Johnson-fold domains of three adjacent MCPs (Fig. 4j, Extended Data Fig. 9e–g). Thus, the N-anchor of Tri1 anchors the entire triplex to the capsid floor; this plugs the hole in the MCP floor and rivets the capsid shell in place. The N-anchor of Tri1 in peripentonal triplex Ta refolds in the middle arm of the tripod to accommodate the binding of a helix from the refolded dimerization domain of a penton MCP, and thus probably stabilizes the penton region (Extended Data Fig. 10).
Figure 4. Structure of triplex and function of Tri1 N-anchor.
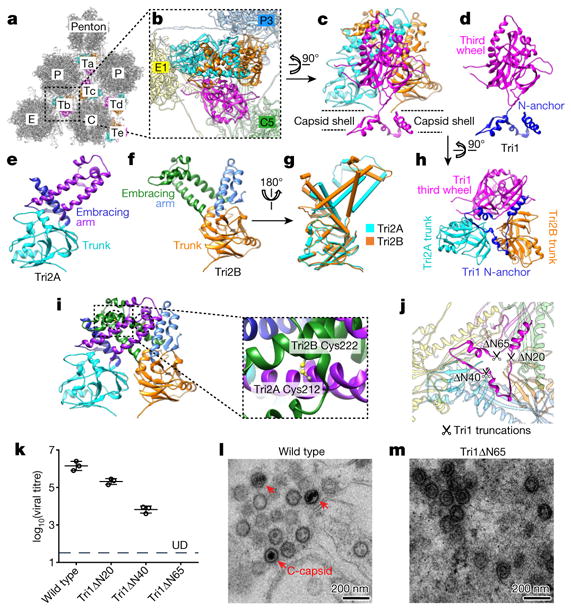
a, Distribution of triplexes in the MCP network. b, Enlarged view of a triplex Tb from outside the capsid. c–f, Detailed structures of triplex Tb (c) and its components Tri1 (d), Tri2A (e) and Tri2B (f). g, Superposition of Tri2A and Tri2B. h, Triplex Tb viewed from inside the capsid showing similar structures among the Tri2A and Tri2B trunk domains and the Tri1 third-wheel domain. i, Tri2A and Tri2B form a dimer with their embracing arms. The dotted circles denote two disulfide bonds between Tri2A and Tri2B (shown expanded in the inset). j, Triplex Tb viewed from inside the capsid, showing that it anchors to the capsid floor by the tripod-shaped Tri1 N-anchor. k, Comparison of viral titres of wild type and Tri1-truncated mutants. Data are mean ± s.e.m. (n = 3 biologically independent samples). l, m, Transmission electron microscopy images of ultrathin sections of cells replicating the wild-type virus (l) or the Tri1Δ N65 mutant (m). Experiments were repeated independently twice with similar results.
To investigate the function of the Tri1 N-anchor, we carried out serial-truncation mutageneses of the 65 residues of the Tri1 N terminal (Fig. 4j–m, Extended Data Fig. 8b, d, f). Truncating 20, 40 and 65 residues of the Tri1 N terminal, which removes one, two and three tripod arms, reduced virion production by 88.4%, 99.7% and to an undetectable level, respectively (Fig. 4j, k). Furthermore, we observed the accumulation of empty capsid-like particles in the nuclei of cells that lytically replicated the Tri1Δ N65 mutant virus (Fig. 4l, m), in contrast to the observation with MCPΔ N40 mutant virus, in which lack of virion production was probably due to complete abolition of capsid assembly (Fig. 3k, l). Although triplex has been proposed to incorporate three MCP subunits into an assembly unit for procapsid formation25, our mutagenesis results indicate that the Tri1 N-anchor is not required for triplex incorporation during capsid assembly, though it is essential for DNA containment in the C-capsids.
The hotspots of interactions revealed in the above structural and mutational analyses can be targeted for designing capsid assembly inhibitors. Current therapies against herpesvirus infections are based on nucleoside analogues that target viral genome replication, a process that bears some similarity to cellular DNA replication. These therapies therefore suffer from cytotoxicity and drug resistance26, which generates a need for potent non-nucleosidic antiviral compounds. Compounds that target capsid formation or stability are a potential option and have been actively pursued in research focusing on HIV and hepatitis B27–30; owing to the absence of atomic structures for herpesvirus capsids, similar strategies have been hindered in herpes research. Our structure reveals an interaction hotspot that seems to offer a promising target for developing antiviral agents: the hydrophobic groove on the MCP surface, into which the SCP stem helix binds. We reason that a short polypeptide that mimics the SCP stem helix would compete with wild-type SCP for binding to MCP, interrupt the crosslinking and stabilizing effect of the SCP, and thereby inhibit KSHV lytic replication. To test this strategy, we constructed three polypeptides that contained the stem helix, the bridging helix or three tandem repeats of the stem helix (3SH ) (Fig. 2d). When expressed in cells, 3SH polypeptides interacted with the MCPud in a similar way to wild-type SCP (Extended Data Fig. 5b, c). Expression of stem helix or 3SH polypeptides in KSHV-replicating cells reduced virion production by 90% and 98.8%, respectively; expression of bridging helix polypeptides did not affect virion production (Fig. 2e). Further experiments with 3SH polypeptides indicated that its inhibition of virion production is dose dependent (Fig. 2f). Therefore, the SCP stem helix is a starting point or even a possible lead compound for the development of drugs targeting KSHV. If this SCP-mimicking polypeptide proves to be useful in designing effective small molecule inhibitors against KSHV infection, many other interaction hotspots revealed in our atomic structure may also offer resources for further exploration.
METHODS
No statistical methods were used to predetermine sample size. The experiments were not randomized and the investigators were not blinded to allocation during experiments and outcome assessment.
Sample preparation
Culture and purification of KSHV virions followed a previously described procedure8,21. In brief, KSHV lytic replication was induced in an iSLK-puro cell line that harbours the KSHV-BAC16 plasmid31,32. The tissue culture supernatant was collected and KSHV virions were pelleted by ultracentrifugation and purified by sucrose density gradient9,33. An aliquot of 2.5 μl purified virion sample was applied onto a Quantifoil R2/1 Cu grid, manually blotted with filter paper and plunge-frozen in liquid ethane. The large size (over 200 nm) of the KSHV virion and frequent contamination of even larger (up to 500 nm) virus-like vesicles in the density-gradient-purified sample (Extended Data Fig. 1a) presented a major challenge to obtaining an optimal cryo-EM grid that had both fully embedded particles and adequately thin ice for high-resolution cryo-EM imaging. Moreover, in order to collect enough data for high-resolution structure determination, the sample must have a ‘perfect’ concentration so that at least a few particles can be imaged within each micrograph but not be over-concentrated, which results in overlapping particles and thick ice. We experimented with more than 30 rounds of virus culture and purification, and screened hundreds of cryo-EM grids to obtain just two that were deemed adequate for high-resolution cryo-EM imaging. The best cryo-EM grids for KSHV virions we obtained were prepared by manual blotting with the filter paper parallel to the grid surface rather than with the commonly used Vitrobot, in which the filter paper blots the grid at an angle and the excess sample solution flows to the filter paper from one edge of the grid.
Cryo-EM imaging and data preprocessing
Cryo-EM images were recorded in an FEI Titan Krios cryo-electron microscope. We collected 8,007 movies using Leginon34 with a Gatan K2 Summit direct electron detector in super-resolution mode. Each movie consists of 26 frames, each of which has an exposure time of 500 ms. A dose rate of approximately 8 electrons per hardware pixel per second was set for exposure to facilitate electron counting in the camera. The pixel size in K2 super-resolution images at 14,000× nominal magnification was calibrated to be 1.03 Å per pixel. Thus, the accumulated dose for each movie was approximately 25 e− per Å2 on the sample. All 26 frames in each movie were aligned and averaged for drift correction35. Defocus values were determined with CTFFIND336 to be in the range of − 1 μm to −3 μm. Particles were picked with Ethan37 and then manually screened with the boxer program in EMAN38 to keep only well-separated and artefact-free particles. A total of 44,343 particle images were boxed out from the micrographs with EMAN.
3D structure determination
The enormous size of 1,440× 1,440 pixels for individual particle image is too large or requires an unrealistic amount of computational resources to process with many popular cryo-EM software packages. To process the data, we modified and rebuilt our common-line based refinement program package (IMIRS39,40) and GPU-implemented reconstruction program (eLite3D41), to expand data processing capacities. The original images were also binned 8×, 4× or 2× stepwise to speed up data processing.
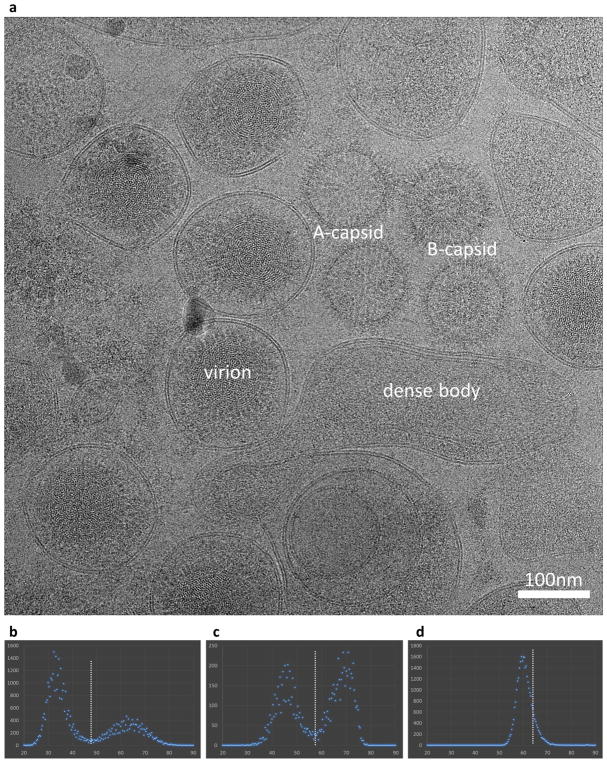
Initial orientation and centre parameters for each particle were determined using data points in the very low resolution range (500–30 Å), without contrast transfer function correction. A phase-residue value was reported for each particle that directly measured the agreement of the cross common-lines between the cryo-EM image and the projected template. High phase-residue values typically result from incorrect identifications of the cross common-lines (that is, incorrect orientation assignment for that particle) or from low-quality particles (such as broken or contaminated particles). By sorting and grouping the particles with phase-residue values in steps of 0.4 and plotting the number of particles in each group, we found that there were two well-separated peaks of phase-residue distribution in the dataset (Extended Data Fig. 1b). The number of particles in the high phase-residue peak constituted approximately 35% of the dataset. We checked a previous dataset (X.D. et al., unpublished data) of the KSHV virion that was recorded on photographic film and found that the high phase-residue peak constituted an even higher percentage (55%) of that dataset (Extended Data Fig. 1c), probably owing to a lower contrast of the film dataset in comparison with our current K2 super-resolution dataset. Because only low-resolution (and thus relatively less noisy) data points were used in the initial centre and orientation search, the high phase-residue particles should be treated as ‘bad particles’ and the low phase-residue ones as ‘good particles’. The relatively high percentage of bad particles in the KSHV dataset compared to that in viral datasets we have previously worked on (for example, refs 42, 43) might be caused by relatively thick ice of the KSHV cryo-EM grid and, more probably, by the thick and pleomorphic tegument layer in the KSHV virion, which not only deteriorates the contrast of the cryo-EM images but also acts as a contaminant to the capsid projection, which interferes with centre and orientation searches for the capsid. As the refinement gradually proceeds to include more and more high-resolution data points, the phase residue of all particles would shift towards the 90° maximum. Conceivably, the phase residue of a good particle would shift faster than that of a bad particle, so the two well-separated peaks observed at the initial stage would gradually overlap with one another. Therefore, at a late stage of the refinement procedure, it would be difficult or even impossible to use a single phase-residue cutoff to select most of the good particles for 3D reconstruction. To prevent the bad particles from ‘contaminating’ the final reconstruction, we adopted a strategy in which bad particles were sorted out and thrown away after the initial step of centre and orientation search, and before the refinement procedure. A total of 29,100 high-quality particles in the first peak of phase-residue distribution, constituting approximately 65% of the entire dataset, were selected, divided into two random halves and separately subjected to iterative refinement. At the end of each iteration, a phase-residue cutoff was set to select the top approximately 85% of particles for reconstruction (Extended Data Fig. 1d).
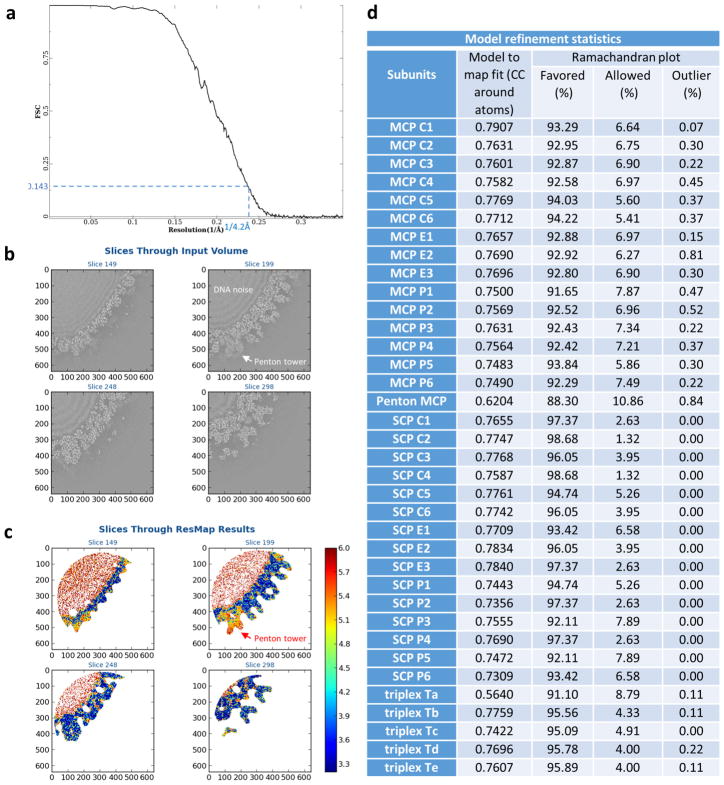
After convergence of refinement for both halves, a Fourier shell correlation (FSC) curve was calculated and the resolution was determined to be 4.2 Å on the basis of the gold-standard FSC = 0.143 criterion44. Then, the two halves of the dataset were combined and a total of 25,315 particles were used to calculate the final density map. A B-factor of − 200 Å2 was applied to sharpen the density map for model building and structure analysis.
Local averaging
There are 15 copies of hexon MCP or SCP (C1–C6, E1–E3 and P1–P6) and five copies of triplex (Ta–Te) in the asymmetric unit of the KSHV capsid. The quasi-equivalent copies of each kind are structurally similar and thus can be averaged to boost the signal-to-noise ratio of the density map, and to facilitate backbone tracing during atomic model building. By segmenting out cuboid density blocks encompassing each copy of MCP, SCP or triplex, and fitting them to each other in Chimera45, we identified that densities of MCP or SCP C1–C6 or triplexes Tb–Te have the best quality and are structurally least different among their kind. These aligned density blocks in each kind were averaged with the vop command in Chimera.
Atomic model building
The local-averaged MCP, SCP or triplex density maps were fitted into the original map at one of the quasi-equivalent positions and both were used for ab initio modelling in Coot46. Generally, the local-averaged map has much improved main-chain densities that help to resolve ambiguities of backbone tracing; whereas the original map has better side chain densities that provide landmarks for amino acid registration. The crystallographic model of HSV-1 MCPud (RSCB Protein Data Bank (PDB) code: 1NO7)20 fits into our KSHV density map and was therefore referred to when tracing backbone for the KSHV MCPud.
The first atomic model of MCP, SCP or triplex was refined using the real space refinement utility in Phenix47 and then manually checked in Coot. This procedure was repeated several times until a satisfactory model was obtained. These first models of each kind were fitted into the original density map at other quasi-equivalent positions and manually adjusted in Coot for structural variations. For penton MCP, a majority of the tower region (including upper, channel and buttress domains) is noisy and broken in the sharpened map, and is therefore difficult to model ab initio. However, by low-pass filtering the density map to 6 Å resolution (so that the noisy penton tower could be visualized), and fitting a hexon MCP model into the penton density, we found that the tower regions of penton MCP and hexon MCP are structurally almost identical. In the floor region, where the two structures differ substantially, the penton density shows adequate quality for ab initio modelling. Therefore, the tower region of hexon MCP model is chimaerized with the ab initio model of the penton MCP floor region to synthesize the full model of penton MCP for presentation purposes.
In summary, we built atomic models for a total of 46 unique conformers of the four capsid proteins: 15 hexon MCP (amino acids 1–1,141, 1,164–1,376), 1 penton MCP (ab initio modelling of amino acids 47–409, 1,261–1,293 except for small flexible regions, and fitting of the remaining with hexon MCP model), 15 hexon SCP (amino acids 2–79), 5 Tri1 (amino acids 4–213, 217–331) and 10 Tri2 (amino acids 2–163, 174–305 of Tri2A; 2–196, 201–305 of Tri2B). As the last step, the refined atomic models of all individual conformers were combined and refined together in Phenix to resolve intermolecular clashes at the interface. Though not resolved at high resolution, the densities of five capsid-associated tegument complexes, which crown each penton, are visible when the map is low-pass filtered to approximately 6 Å resolution, suggesting their relative flexibility/ low occupancy21. This resolution was not sufficient to support model building for the capsid-associated tegument complexes.
Construction of MCP-truncated or Tri1-truncated KSHV mutants
The KSHV-BAC16 plasmid was modified according to a previously described method32,48. In brief, DNA fragments of KSHV ORF25 (MCP) or ORF62 (Tri1) with truncation of the defined amino acids were used to replace the wild-type sequence in the KSHV BAC by homogeneous recombination in Escherichia coli. Restriction patterns of the mutated KSHV BACs were verified by comparing them to that of the wild type to ensure overall genome integrity without gross changes. Fragments with the mutations in the middle were amplified from the plasmids by PCR, and sequenced to confirm that all mutations were correct. All mutant KSHV BACs were introduced into iSLK-puro cells, followed by selection with 1,200 μg ml−1 hygromycin B, 1 μg ml−1 puromycin and 250 μg ml−1 G418 for one month to generate cell lines latently infected by a specific KSHV mutant virus.
Titration of infectious KSHV virions
To determine the concentration of infectious KSHV virions released from iSLK-puro cells harbouring a wild-type, MCP-truncated or Tri1-truncated KSHV genome, cells were treated with 1 mM sodium butyrate plus 1 μg ml−1 doxycycline for three days to induce KSHV lytic replication. Then, the supernatants were collected, centrifuged at 10,000g for 10 minutes at 4 °C to remove cellular debris, serially diluted in DMEM with 10% FBS and used to infect 293T cells in 96-well plates by spinoculation (3,000g for 1 h at 30 °C). Three days after infection, GFP-positive cell clusters containing two or more cells were counted under a fluorescence microscope to determine the titre of KSHV virions. Infectious units are expressed as the number of GFP-positive cell clusters in each well at a specific dilution of the viral stock.
Measuring viral DNA replication and RNA expression by real-time PCR
Total DNA was isolated from cells replicating KSHV, and viral genome copy numbers were determined by real-time PCR using primers for ORF59, a gene essential for viral genome replication49. Total RNA was extracted from cells with a Purelink RNA mini kit (Thermo Fisher Scientific), treated with DNase I and reverse transcribed using SuperScript III reverse transcriptase (Thermo Fisher Scientific) and random hexamers. Real-time PCR was then performed with the following primers to detect the corresponding DNA or transcripts. GAPDH: 5′-TGCACCACCAACTGCTTAGC-3′ and 5′-GGCATGGACTGTGGTCAT GAG-3′; RTA: 5′-CACAAAAATGGCGCAAGATGA-3′ and 5′-TGGTAGAGTTGG GCCTTCAGTT-3′; ORF59: 5′-TTGGCACTCCAACGAAATATTAGAA-3′ and 5′-CGGGAACCTTTTGCGAAGA-3′; ORF57: 5′-TGGACATTATGAAGGGCATC CTA-3′ and 5′-CGGGTTCGGACAATTGCT-3′; ORF52: 5′-CTTACGATGGA AGACCTAACCG-3′ and 5′-ATCCCAGTGCTTTCCGAAG-3′; ORF25 (MCP): 5′-CGTATCCCCTGTTCTGCTATG-3′ and 5′-TTTTCCCGAGTTGACCCAG-3′; ORF62 (Tri1): 5′-TCGTTGGTTTATCTCCGTGTG-3′ and 5′-CAGCTGAATATAC TTGGTCCGG-3′.
Western blotting and antibodies
Proteins in SDS–PAGE sample buffer were heated at 95 °C, resolved by SDS–PAGE and then transferred onto PVDF membrane. Proteins were detected with antibodies against KSHV RTA (polyclonal antibody produced in rabbit), SCP (polyclonal antibody produced in rabbit50), Tri1 (Thermo Fisher Scientific) or actin (Abcam). HRP-conjugated secondary antibodies were used and detection was performed with ECL (Amersham).
Plastic embedding, ultrathin sectioning and conventional transmission electron microscopy
Cells induced for lytic replication of the wild-type, MCP-truncated or Tri1-truncated KSHV were collected after trypsin treatment and subjected to plastic embedding and transmission electron microscopy as previously described8. In brief, cells were washed with PBS, fixed with 2% glutaraldehyde in PBS for 1 h, post-fixed in 1% OsO4 for 1 h, stained en bloc in 2% uranyl acetate for 1 h, dehydrated in an ascending ethanol series and embedded using the Ultra Bed Low Viscosity Epoxy Kit (Electron Microscopy Sciences). Approximately 75-nm-thick sections were stained with saturated aqueous uranyl acetate and lead citrate, and examined with an FEI Tecnai F20 electron microscope.
Co-immunoprecipitation assay to detect MCP-SCP binding
Co-immunoprecipitation experiments were performed as previously described51. In brief, 293T cells were transfected with SCP–Flag and Myc–MCPud (amino acids 478–1,033) expression plasmids and lysed at two days post-transfection with RIPA buffer (50 mM Tris-HCl pH 7.4, 0.5% NP-40, 150 mM NaCl, 1 mM EDTA and protease inhibitors). After pre-clearance with protein G-sepharose beads (GE Health) for 1 h at 4 °C, cell lysates were incubated with 1 μg anti-Myc antibody for at least 4 h at 4 °C with constant agitation. Then, protein complexes were collected by incubating with protein G-sepharose beads for 1 h, and further washed five times with RIPA buffer. Proteins were eluted from beads with 60 μl SDS–PAGE sample buffer and subjected to western blotting analysis using anti-Flag and anti-Myc antibodies.
Construction and test of SCP-mimicking polypeptides
The coding region for the SCP stem helix (amino acids 37–68) or bridging helix (amino acids 66–81) was amplified from KSHV-BAC16 plasmid by PCR, and the coding region for DsRed was amplified from pCMV-DsRed-Express plasmid (Clontech) by PCR. Stem helix or bridging helix fragments were linked to DsRed fragment by PCR reaction, and then cloned into the EcoRI site of pCMV-noHA vector51 to generate SH-RED and BH-RED polypeptide expression plasmids, respectively. The DNA sequence for three tandem repeats of stem helix linked with Ser-Gln-Pro residues and C-terminal Flag-tag was synthesized de novo (Integrated DNA Technologies), and then cloned into the EcoRI site of pCMV-noHA vector to generate the 3SH polypeptide expression plasmid. Sequences of the PCR-amplified or synthesized fragments and their correct insertion in the plasmid were verified by sequencing. KSHV latently infected 293T cells were transfected with these polypeptide expression plasmids or the pCMV-DsRed-Express vector as control. At 16 h post-transfection, cells were treated with 0.5 mM sodium butyrate plus 25 ng ml−1 TPA to induce KSHV lytic replication. Three days later, the supernatants were collected for virion titration.
Data availability
The cryo-EM density map and the atomic models have been deposited in the Electron Microscopy Data Bank and RCSB Protein Data Bank under accession numbers EMD-7047 and 6B43, respectively. All other data are available from the corresponding authors upon reasonable request.
Extended Data
Extended Data Figure 1. Cryo-EM imaging of KSHV particles and data processing strategy to minimize interference of the tegument layer.
a, A cryo-EM micrograph. Images recorded with a Gatan K2 Summit direct electron detector show largely intact KSHV virions in our sample preparation. Naked capsids were only occasionally observed. The defocus value of this micrograph was − 1.3 μm. b, Plot of phase-residue value distribution of particles after initial determination of orientation and centre parameters. Particles in the second peak with high phase-residue values are regarded as bad particles, for which the parameters were not correctly determined owing to the interference of the thick, pleomorphic tegument layer or the low quality of the particle. These particles were discarded and not included for following refinement to avoid their contaminating the reconstruction. c, Plot of phase-residue value distribution of our previous film dataset (X.D. et al., unpublished data) showing even more bad particles than those recorded in b, probably owing to decreased contrast of the film dataset compared to that of our current K2 dataset (b). d, Plot of phase-residue value distribution of particles after the final round of parameter refinement. There is only one peak representing the good particles, because the bad particles were discarded at the beginning of the refinement procedure. Moreover, only the top 85% of these good particles were selected for reconstruction. White lines denote the phase-residue value cutoff to select particles for refinement (b, c) or reconstruction (d).
Extended Data Figure 2. Resolution assessment of the cryo-EM reconstruction and model refinement statistics.
a, Gold-standard FSC curve of the cryo-EM reconstruction. The average resolution of the final density map is 4.2 Å as determined by the FSC = 0.143 criterion44. b, c, Local resolution assessment by ResMap52. A 6403-voxel sub-volume of the final density map was subjected to ResMap processing. Four slices of the input volume (b) and the local resolution heat map (c) are shown. Note that many regions of the density map have better resolution than the FSC-measured average resolution of 4.2 Å. The penton tower region has the lowest resolution because of its flexibility. d, Model refinement statistics reported by the Phenix real space refinement program47.
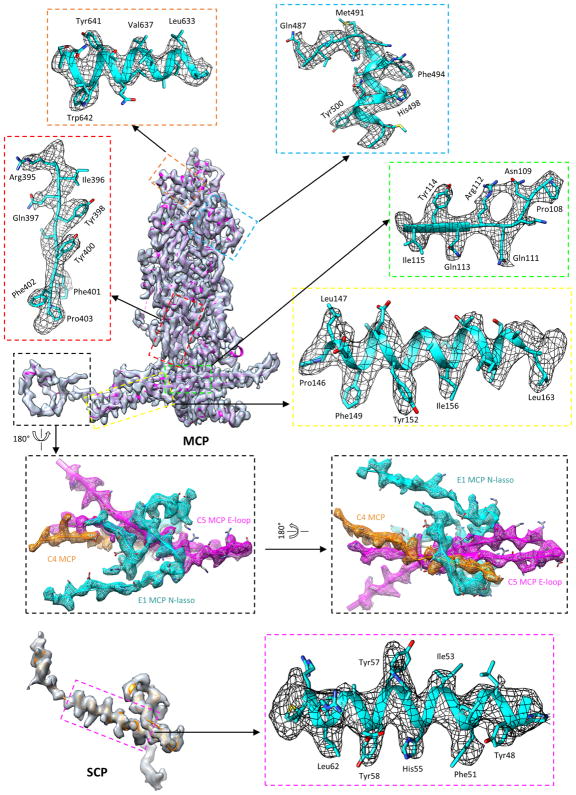
Extended Data Figure 3. Density maps and atomic models of MCP and SCP.
Insets correspond to zoomed-in views of boxed regions and illustrate residue features in the density map.
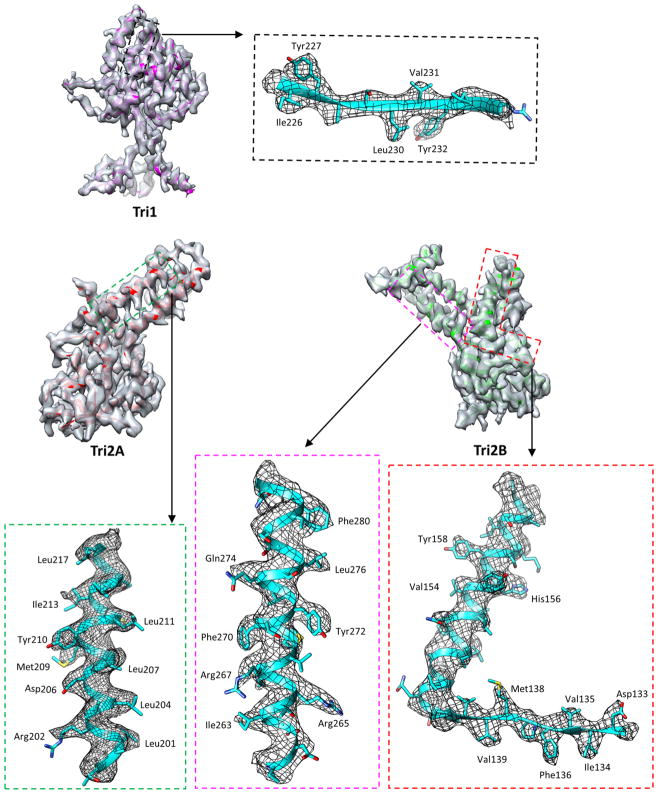
Extended Data Figure 4. Density maps and atomic models of Tri1, Tri2A and Tri2B.
Insets correspond to zoomed-in views of boxed regions and illustrate residue features in the density map.
Extended Data Figure 5. Structure-guided point mutations of MCPud to identify essential amino acid interactions in MCP–SCP binding.
a, Specific amino acid interactions between SCP and MCPud. The SCP model is coloured according to the hydrophobicity of its residues. The MCPud is coloured pink, except for one helix (amino acids 763–778, shown in cyan) that borders the groove for the binding of SCP stem helix. The corresponding region (amino acids 767–781) in the highly homologous HSV-1 MCPud is a loop structure, which thus forms a relatively flat surface for SCP binding. b, c, Demonstration of specific interaction between SCP and MCPud (b) or between the SCP-mimicking polypeptide 3SH–Flag and MCPud (c); 293T cells were co-transfected with expression plasmids of MCPud (amino acids 478–1033, wild type or mutants) and SCP–Flag (b) or of MCPud and 3SH–Flag (c). Two days later, cell lysates were subjected to a co-immunoprecipitation assay using mouse anti-Myc antibody, and further analysed by western blotting with rabbit anti-Flag and anti-Myc antibodies. As expected, expressed wild-type SCP (b) and 3SH–Flag (c) both bound to expressed wild-type MCPud. Conversely, four out of the seven MCPud point mutations that substitute a hydrophobic residue with a hydrophilic residue disrupted these interactions for both wild-type SCP (b) and 3SH–Flag (c). These results suggest that SCP-mimicking polypeptides interact with MCPud in a similar way to wild-type SCP. Experiments were repeated independently twice with similar results.
Extended Data Figure 6. Structural differences between hexon and penton.
a, Superimposed models of a hexon MCP and a penton MCP, which shows the hinged tilting of the floor region of a penton MCP towards the centre of the capsid. b–d, Comparison of channel constrictions between a bacteriophage HK97 hexon (b), a KSHV hexon (c) and a KSHV penton (d). The hexon channel in HK97 is tightly constricted by a loop in the A-domain (Fig. 2k) of the Johnson fold (b, top). In the crystal structure of HK97, this channel is completely blocked by a sulfate ion53 (b, bottom). The hexon channel in KSHV is not constricted by the HK97-like Johnson fold. The diameter of the channel at this position is 25 Å (c, middle). Note the large gap between adjacent Johnson folds, and also the absence of a long loop corresponding to the channel-constricting loop in HK97. Instead, the KSHV hexon channel is most constricted at the channel domain (c, top). Side view of the hexon (c, bottom) shows that the helix-hairpin domain insertion (blue) seals a hole at the root of the capsomer tower. The penton channel in KSHV is constricted by the Johnson-fold domain (d, middle). The diameter of the penton channel at this position is 5 Å (d, bottom). Owing to the hinged tilting of the floor region of penton MCP towards the centre of the capsid (a), adjacent Johnson-fold domains move closer to one another and constrict the penton channel (d, top).
Extended Data Figure 7. The MCP network in KSHV capsid.
a, The network forged by MCP N-lassoes in the KSHV capsid floor, illustrated with atomic models. A short continuous segment of MCP N-terminal region (amino acids 1–186) including the N-lasso, N-arm, E-loop and spine helix is shown in each MCP model. b, A schematic representation of part of the network. An analogy can be drawn between the ‘dancer’ in the schematic representation and the MCP atomic model as shown in the inset.
Extended Data Figure 8. Truncation mutagenesis of the MCP N-lasso or Tri1 N-anchor does not notably affect KSHV DNA replication or gene expression.
a, b, Viral genome copy number in cells replicating the wild type (WT), MCP-truncated (a) or Tri1-truncated (b) KSHV. Design of MCP truncations or Tri1 truncations is shown in Figs 3i and 4j, respectively. KSHV lytic replication was induced in cells harbouring the wild-type or the mutated KSHV genome. Total DNA was extracted from cells, and viral genome copy number was determined by real-time PCR. Data are mean ± s.e.m. (n = 3 biologically independent samples). c, d, Viral RNA expression in cells replicating the wild-type, MCP-truncated (c) or Tri1-truncated (d) KSHV. Total RNA was extracted from cells induced for KSHV lytic replication. Viral RNA transcripts were quantified by real-time PCR with reverse transcription and presented as fold changes over RNA level of wild-type virus. Data are mean ± s.e.m. (n = 3 or 4 biologically independent samples). e, f, Expression of viral and cellular proteins in cells replicating the wild-type, MCP-truncated (e) or Tri1-truncated (f) KSHV. Correct sizes of truncated Tri1 were verified by western blotting with an anti-Tri1 antibody as shown in f. Verification of truncated MCP was not carried out owing to the lack of anti-MCP antibody. Experiments were repeated independently twice with similar results.
Extended Data Figure 9. Hydrophobic interactions in the formation of triplexes and in the anchoring of triplexes to the capsid floor.
a–d, Hydrophobic interactions have a major role in the formation of triplex heterotrimers. Surface representations of Tri2A (a), Tri2B (b) and Tri1 (c) monomers or the Tri2 dimer (d) were calculated and coloured according to hydrophobicity. Red, hydrophobic; white, neutral; blue, hydrophilic. Large patches of hydrophobic residues at the interface of the Tri2A and Tri2B embracing arm domains hold the Tri2 dimer together, and contribute to interactions with the Tri1 third-wheel domain to form the heterotrimer. e–g, Triplexes are anchored to the capsid floor by the tripod-shaped Tri1 N-anchor (e, f) via hydrophobic interactions (g).
Extended Data Figure 10. Structural polymorphism in the Tri1 N-anchor.
a, b, Distribution of triplexes in the MCP network viewed from outside (a) or inside (b) the capsid. c, d, Zoomed-in views of triplex Ta (c) or Tb (d) from inside the capsid. e, Superimposed models of triplexes Ta and Tb reveal structural differences in their Tri1 N-anchor domains. f, The refolded Tri1 N-anchor in triplex Ta contributes to penton stabilization. The refolded helix in Ta Tri1 forms a hydrophobic cleft with the spine helix of a penton MCP, in which the refolded dimerization domain of an adjacent penton MCP (magenta) binds with a series of hydrophobic residues.
Extended Data Table 1.
Cryo-EM data collection, refinement and validation statistics
| KSHV capsid (EMD-7047) (PDB 6B43) | |
|---|---|
| Data collection and processing | |
| Magnification | 14,000 |
| Voltage (kV) | 300 |
| Electron exposure (e–/Å2) | 25 |
| Defocus range (μm) | 1–3 |
| Pixel size (Å) | 1.03 |
| Symmetry imposed | Icosahedral |
| Initial particle images (no.) | 44,343 |
| Final particle images (no.) | 29,100 |
| Map resolution (Å) | 0.143 |
| FSC threshold | |
| Map resolution range (Å) | 4.2 |
| Refinement | |
| Initial model used (PDB code) | N/A |
| Model resolution (Å) | N/A |
| FSC threshold | |
| Model resolution range (Å) | N/A |
| Map sharpening B factor (Å2) | 200 |
| Model composition | |
| Non-hydrogen atoms | 214,334 |
| Protein residues | 27,223 |
| Ligands | 0 |
| B factors (Å2) | N/A |
| Protein | |
| Ligand | |
| R.m.s. deviations | |
| Bond lengths (Å) | 0.008 |
| Bond angles (°) | 1.119 |
| Validation | |
| MolProbity score | 1.98 |
| Clashscore | 7.41 |
| Poor rotamers (%) | 0.08 |
| Ramachandran plot | |
| Favored (%) | 89.26 |
| Allowed (%) | 10.59 |
| Disallowed (%) | 0.15 |
Supplementary Material
Acknowledgments
This project was supported in part by grants from the National Institutes of Health (NIH) (DE025567, GM071940, AI094386, CA091791 and CA177322) and indirectly through a Clinical and Translational Science Institute core voucher award (UL1TR000124) from UCLA’s National Center for Advancing Translational Science. We acknowledge the use of instruments at the Electron Imaging Center for Nanomachines supported by UCLA and by instrumentation grants from the NIH (1S10OD018111, 1U24GM116792) and NSF (DBI-1338135, DMR-1548924).
Footnotes
Online Content Methods, along with any additional Extended Data display items and Source Data, are available in the online version of the paper; references unique to these sections appear only in the online paper.
Author Contributions Z.H.Z., X.D., D.G. and R.S. designed the project; Z.H.Z., R.S. and T.-T.W. supervised research; D.G. and X.D. prepared the samples; X.D. acquired cryo-EM data and determined the structure; X.D., H.L. and J.J. built atomic models; D.G. performed functional studies; X.D., D.G., Z.H.Z., R.S. and T.-T.W. interpreted the results; Z.H.Z., X.D. and D.G. wrote the paper; R.S. revised the paper; and all authors reviewed the paper.
The authors declare no competing financial interests.
Readers are welcome to comment on the online version of the paper.
Supplementary Information is available in the online version of the paper.
References
- 1.Chang Y, et al. Identification of herpesvirus-like DNA sequences in AIDS-associated Kaposi’s sarcoma. Science. 1994;266:1865–1869. doi: 10.1126/science.7997879. [DOI] [PubMed] [Google Scholar]
- 2.Moore PS, Chang Y. Detection of herpesvirus-like DNA sequences in Kaposi’s sarcoma in patients with and those without HIV infection. N Engl J Med. 1995;332:1181–1185. doi: 10.1056/NEJM199505043321801. [DOI] [PubMed] [Google Scholar]
- 3.Boshoff C, Weiss R. AIDS-related malignancies. Nat Rev Cancer. 2002;2:373–382. doi: 10.1038/nrc797. [DOI] [PubMed] [Google Scholar]
- 4.Chatlynne LG, Ablashi DV. Seroepidemiology of Kaposi’s sarcoma-associated herpesvirus (KSHV) Semin Cancer Biol. 1999;9:175–185. doi: 10.1006/scbi.1998.0089. [DOI] [PubMed] [Google Scholar]
- 5.Bauer DW, Huffman JB, Homa FL, Evilevitch A. Herpes virus genome, the pressure is on. J Am Chem Soc. 2013;135:11216–11221. doi: 10.1021/ja404008r. [DOI] [PMC free article] [PubMed] [Google Scholar]
- 6.Perkins EM, et al. Small capsid protein pORF65 is essential for assembly of Kaposi’s sarcoma-associated herpesvirus capsids. J Virol. 2008;82:7201–7211. doi: 10.1128/JVI.00423-08. [DOI] [PMC free article] [PubMed] [Google Scholar]
- 7.Henson BW, Perkins EM, Cothran JE, Desai P. Self-assembly of Epstein–Barr virus capsids. J Virol. 2009;83:3877–3890. doi: 10.1128/JVI.01733-08. [DOI] [PMC free article] [PubMed] [Google Scholar]
- 8.Dai X, et al. CryoEM and mutagenesis reveal that the smallest capsid protein cements and stabilizes Kaposi’s sarcoma-associated herpesvirus capsid. Proc Natl Acad Sci USA. 2015;112:E649–E656. doi: 10.1073/pnas.1420317112. [DOI] [PMC free article] [PubMed] [Google Scholar]
- 9.Dai X, et al. The smallest capsid protein mediates binding of the essential tegument protein pp150 to stabilize DNA-containing capsids in human cytomegalovirus. PLoS Pathog. 2013;9:e1003525. doi: 10.1371/journal.ppat.1003525. [DOI] [PMC free article] [PubMed] [Google Scholar]
- 10.Zhang X, Zhou ZH. Limiting factors in atomic resolution cryo electron microscopy: no simple tricks. J Struct Biol. 2011;175:253–263. doi: 10.1016/j.jsb.2011.05.004. [DOI] [PMC free article] [PubMed] [Google Scholar]
- 11.Zhou ZH, et al. Four levels of hierarchical organization, including noncovalent chainmail, brace the mature tumor herpesvirus capsid against pressurization. Structure. 2014;22:1385–1398. doi: 10.1016/j.str.2014.05.019. [DOI] [PMC free article] [PubMed] [Google Scholar]
- 12.Wikoff WR, et al. Topologically linked protein rings in the bacteriophage HK97 capsid. Science. 2000;289:2129–2133. doi: 10.1126/science.289.5487.2129. [DOI] [PubMed] [Google Scholar]
- 13.Fokine A, et al. Structural and functional similarities between the capsid proteins of bacteriophages T4 and HK97 point to a common ancestry. Proc Natl Acad Sci USA. 2005;102:7163–7168. doi: 10.1073/pnas.0502164102. [DOI] [PMC free article] [PubMed] [Google Scholar]
- 14.Zhang X, et al. A new topology of the HK97-like fold revealed in Bordetella bacteriophage by cryoEM at 3.5 Å resolution. eLife. 2013;2:e01299. doi: 10.7554/eLife.01299. [DOI] [PMC free article] [PubMed] [Google Scholar]
- 15.Lander GC, et al. Bacteriophage lambda stabilization by auxiliary protein gpD: timing, location, and mechanism of attachment determined by cryo-EM. Structure. 2008;16:1399–1406. doi: 10.1016/j.str.2008.05.016. [DOI] [PMC free article] [PubMed] [Google Scholar]
- 16.Parent KN, et al. P22 coat protein structures reveal a novel mechanism for capsid maturation: stability without auxiliary proteins or chemical crosslinks. Structure. 2010;18:390–401. doi: 10.1016/j.str.2009.12.014. [DOI] [PMC free article] [PubMed] [Google Scholar]
- 17.Baker ML, Jiang W, Rixon FJ, Chiu W. Common ancestry of herpesviruses and tailed DNA bacteriophages. J Virol. 2005;79:14967–14970. doi: 10.1128/JVI.79.23.14967-14970.2005. [DOI] [PMC free article] [PubMed] [Google Scholar]
- 18.Akita F, et al. The crystal structure of a virus-like particle from the hyperthermophilic archaeon Pyrococcus furiosus provides insight into the evolution of viruses. J Mol Biol. 2007;368:1469–1483. doi: 10.1016/j.jmb.2007.02.075. [DOI] [PubMed] [Google Scholar]
- 19.Sutter M, et al. Structural basis of enzyme encapsulation into a bacterial nanocompartment. Nat Struct Mol Biol. 2008;15:939–947. doi: 10.1038/nsmb.1473. [DOI] [PubMed] [Google Scholar]
- 20.Bowman BR, Baker ML, Rixon FJ, Chiu W, Quiocho FA. Structure of the herpesvirus major capsid protein. EMBO J. 2003;22:757–765. doi: 10.1093/emboj/cdg086. [DOI] [PMC free article] [PubMed] [Google Scholar]
- 21.Dai X, Gong D, Wu TT, Sun R, Zhou ZH. Organization of capsid-associated tegument components in Kaposi’s sarcoma-associated herpesvirus. J Virol. 2014;88:12694–12702. doi: 10.1128/JVI.01509-14. [DOI] [PMC free article] [PubMed] [Google Scholar]
- 22.Zhou ZH, et al. Assembly of VP26 in herpes simplex virus-1 inferred from structures of wild-type and recombinant capsids. Nat Struct Biol. 1995;2:1026–1030. doi: 10.1038/nsb1195-1026. [DOI] [PubMed] [Google Scholar]
- 23.Huet A, et al. Extensive subunit contacts underpin herpesvirus capsid stability and interior-to-exterior allostery. Nat Struct Mol Biol. 2016;23:531–539. doi: 10.1038/nsmb.3212. [DOI] [PMC free article] [PubMed] [Google Scholar]
- 24.Yu X, Jih J, Jiang J, Zhou ZH. Atomic structure of the human cytomegalovirus capsid with its securing tegument layer of pp150. Science. 2017;356:eaam6892. doi: 10.1126/science.aam6892. [DOI] [PMC free article] [PubMed] [Google Scholar]
- 25.Aksyuk AA, et al. Subassemblies and asymmetry in assembly of herpes simplex virus procapsid. MBio. 2015;6:e01525–15. doi: 10.1128/mBio.01525-15. [DOI] [PMC free article] [PubMed] [Google Scholar]
- 26.Gilbert C, Bestman-Smith J, Boivin G. Resistance of herpesviruses to antiviral drugs: clinical impacts and molecular mechanisms. Drug Resist Updat. 2002;5:88–114. doi: 10.1016/s1368-7646(02)00021-3. [DOI] [PubMed] [Google Scholar]
- 27.Ternois F, Sticht J, Duquerroy S, Kräusslich HG, Rey FA. The HIV-1 capsid protein C-terminal domain in complex with a virus assembly inhibitor. Nat Struct Mol Biol. 2005;12:678–682. doi: 10.1038/nsmb967. [DOI] [PubMed] [Google Scholar]
- 28.Sticht J, et al. A peptide inhibitor of HIV-1 assembly in vitro. Nat Struct Mol Biol. 2005;12:671–677. doi: 10.1038/nsmb964. [DOI] [PubMed] [Google Scholar]
- 29.Deres K, et al. Inhibition of hepatitis B virus replication by drug-induced depletion of nucleocapsids. Science. 2003;299:893–896. doi: 10.1126/science.1077215. [DOI] [PubMed] [Google Scholar]
- 30.Zlotnick A, Ceres P, Singh S, Johnson JM. A small molecule inhibits and misdirects assembly of hepatitis B virus capsids. J Virol. 2002;76:4848–4854. doi: 10.1128/JVI.76.10.4848-4854.2002. [DOI] [PMC free article] [PubMed] [Google Scholar]
- 31.Myoung J, Ganem D. Generation of a doxycycline-inducible KSHV producer cell line of endothelial origin: maintenance of tight latency with efficient reactivation upon induction. J Virol Methods. 2011;174:12–21. doi: 10.1016/j.jviromet.2011.03.012. [DOI] [PMC free article] [PubMed] [Google Scholar]
- 32.Brulois KF, et al. Construction and manipulation of a new Kaposi’s sarcoma-associated herpesvirus bacterial artificial chromosome clone. J Virol. 2012;86:9708–9720. doi: 10.1128/JVI.01019-12. [DOI] [PMC free article] [PubMed] [Google Scholar]
- 33.Dai X, Zhou ZH. Purification of Herpesvirus virions and capsids. Bio Protoc. 2014;4:e1193. doi: 10.21769/bioprotoc.1193. [DOI] [PMC free article] [PubMed] [Google Scholar]
- 34.Suloway C, et al. Automated molecular microscopy: the new Leginon system. J Struct Biol. 2005;151:41–60. doi: 10.1016/j.jsb.2005.03.010. [DOI] [PubMed] [Google Scholar]
- 35.Li X, et al. Electron counting and beam-induced motion correction enable near-atomic-resolution single-particle cryo-EM. Nat Methods. 2013;10:584–590. doi: 10.1038/nmeth.2472. [DOI] [PMC free article] [PubMed] [Google Scholar]
- 36.Mindell JA, Grigorieff N. Accurate determination of local defocus and specimen tilt in electron microscopy. J Struct Biol. 2003;142:334–347. doi: 10.1016/s1047-8477(03)00069-8. [DOI] [PubMed] [Google Scholar]
- 37.Kivioja T, Ravantti J, Verkhovsky A, Ukkonen E, Bamford D. Local average intensity-based method for identifying spherical particles in electron micrographs. J Struct Biol. 2000;131:126–134. doi: 10.1006/jsbi.2000.4279. [DOI] [PubMed] [Google Scholar]
- 38.Ludtke SJ, Baldwin PR, Chiu W. EMAN: semiautomated software for high-resolution single-particle reconstructions. J Struct Biol. 1999;128:82–97. doi: 10.1006/jsbi.1999.4174. [DOI] [PubMed] [Google Scholar]
- 39.Liang Y, Ke EY, Zhou ZH. IMIRS: a high-resolution 3D reconstruction package integrated with a relational image database. J Struct Biol. 2002;137:292–304. doi: 10.1016/s1047-8477(02)00014-x. [DOI] [PubMed] [Google Scholar]
- 40.Liu H, et al. Symmetry-adapted spherical harmonics method for high-resolution 3D single-particle reconstructions. J Struct Biol. 2008;161:64–73. doi: 10.1016/j.jsb.2007.09.016. [DOI] [PubMed] [Google Scholar]
- 41.Zhang X, Zhang X, Zhou ZH. Low cost, high performance GPU computing solution for atomic resolution cryoEM single-particle reconstruction. J Struct Biol. 2010;172:400–406. doi: 10.1016/j.jsb.2010.05.006. [DOI] [PMC free article] [PubMed] [Google Scholar]
- 42.Zhang X, Jin L, Fang Q, Hui WH, Zhou ZH. 3.3 Å cryo-EM structure of a nonenveloped virus reveals a priming mechanism for cell entry. Cell. 2010;141:472–482. doi: 10.1016/j.cell.2010.03.041. [DOI] [PMC free article] [PubMed] [Google Scholar]
- 43.Yu X, Jiang J, Sun J, Zhou ZH. A putative ATPase mediates RNA transcription and capping in a dsRNA virus. Elife. 2015;4:e07901. doi: 10.7554/eLife.07901. [DOI] [PMC free article] [PubMed] [Google Scholar]
- 44.Rosenthal PB, Henderson R. Optimal determination of particle orientation, absolute hand, and contrast loss in single-particle electron cryomicroscopy. J Mol Biol. 2003;333:721–745. doi: 10.1016/j.jmb.2003.07.013. [DOI] [PubMed] [Google Scholar]
- 45.Pettersen EF, et al. UCSF Chimera—a visualization system for exploratory research and analysis. J Comput Chem. 2004;25:1605–1612. doi: 10.1002/jcc.20084. [DOI] [PubMed] [Google Scholar]
- 46.Emsley P, Lohkamp B, Scott WG, Cowtan K. Features and development of Coot. Acta Crystallogr D Biol Crystallogr. 2010;66:486–501. doi: 10.1107/S0907444910007493. [DOI] [PMC free article] [PubMed] [Google Scholar]
- 47.Adams PD, et al. PHENIX: a comprehensive Python-based system for macromolecular structure solution. Acta Crystallogr D Biol Crystallogr. 2010;66:213–221. doi: 10.1107/S0907444909052925. [DOI] [PMC free article] [PubMed] [Google Scholar]
- 48.Gong D, et al. Kaposi’s sarcoma-associated herpesvirus ORF18 and ORF30 are essential for late gene expression during lytic replication. J Virol. 2014;88:11369–11382. doi: 10.1128/JVI.00793-14. [DOI] [PMC free article] [PubMed] [Google Scholar]
- 49.Chan SR, Chandran B. Characterization of human herpesvirus 8 ORF59 protein (PF-8) and mapping of the processivity and viral DNA polymerase-interacting domains. J Virol. 2000;74:10920–10929. doi: 10.1128/jvi.74.23.10920-10929.2000. [DOI] [PMC free article] [PubMed] [Google Scholar]
- 50.Lin SF, et al. Identification, expression, and immunogenicity of Kaposi’s sarcoma-associated herpesvirus-encoded small viral capsid antigen. J Virol. 1997;71:3069–3076. doi: 10.1128/jvi.71.4.3069-3076.1997. [DOI] [PMC free article] [PubMed] [Google Scholar]
- 51.Gong D, et al. A herpesvirus protein selectively inhibits cellular mRNA nuclear export. Cell Host Microbe. 2016;20:642–653. doi: 10.1016/j.chom.2016.10.004. [DOI] [PMC free article] [PubMed] [Google Scholar]
- 52.Kucukelbir A, Sigworth FJ, Tagare HD. Quantifying the local resolution of cryo-EM density maps. Nat Methods. 2014;11:63–65. doi: 10.1038/nmeth.2727. [DOI] [PMC free article] [PubMed] [Google Scholar]
- 53.Helgstrand C, et al. The refined structure of a protein catenane: the HK97 bacteriophage capsid at 3.44 Å resolution. J Mol Biol. 2003;334:885–899. doi: 10.1016/j.jmb.2003.09.035. [DOI] [PubMed] [Google Scholar]
Associated Data
This section collects any data citations, data availability statements, or supplementary materials included in this article.
Supplementary Materials
Data Availability Statement
The cryo-EM density map and the atomic models have been deposited in the Electron Microscopy Data Bank and RCSB Protein Data Bank under accession numbers EMD-7047 and 6B43, respectively. All other data are available from the corresponding authors upon reasonable request.


