

Abstract
The current U.S. demographic shift toward an older population and the importance of intervening before conditions become severe warrant a concerted effort to ease the burden of access to healthcare for older adults. With regard to oral healthcare, more integrated services for older adults are needed to effectively serve their complex medical and dental needs. Using an agent-based simulation model, this paper examines the influence of social ties and transportation mode choices on opportunities for older adults to participate in community-based preventive screening events and access needed oral healthcare. This approach accounts for the heterogeneity of behavior that arises for a population exhibiting diversity in terms of social factors, including socioeconomic means and social support. In the context of older adults living in urban environments, the availability of different transportation modes ought to be taken into consideration. To explore alternative scenarios for the accessibility of preventive screening events offered at senior centers in northern Manhattan, an agent-based model (ABM) was created with a geographic information system (GIS) to simulate the influence of social ties and transportation choices on older adults seeking preventive screening services and oral healthcare. Results of simulation experiments indicate preferences for public transportation and inequities in accessibility that may be mitigated with social support. This simulation model offers a way to explore social support as an important factor in making transportation mode choices that mediate oral healthcare accessibility and thus oral health outcomes for older adults.
Keywords: Healthcare accessibility, Agent-based modeling, Multi-modal transportation analysis, Social influence, Geographic information science
Graphical abstract

1. Introduction
A particularly vexing problem in the United States is the historical existence of and enduring inequities in access to healthcare for poor and disabled populations. Medicaid expansion under the Affordable Care Act (ACA) was intended to partially alleviate this injustice, even as the ACA is currently under threat of repeal or rollbacks in its benefits. Further, racial/ethnic minority and immigrant populations continue to suffer disproportionately from oral diseases such as dental caries, periodontitis, and oral cancers as compared with the white majority and native-born populations due in part to inadequate access to oral healthcare. Inequities in oral healthcare access are exacerbated for older adults upon retirement and subsequent loss of employer-sponsored oral healthcare coverage. These injustices are then compounded by difficulties in conducting daily activities and navigating the built environment due to chronic diseases and disabilities, the inability to afford out-of-pocket expenses required by most private and public health insurance plans, and discriminatory treatment when they do visit healthcare providers (Park, 2009; Andersen, 1995; da Costa, et al., 2017).
Access to healthcare is a complex and multi-dimensional concept that has been advanced from multiple perspectives (Berk & Schur, 1998; Russell, et al., 2013; Neutens, 2015). Penchansky and Thomas (1981) summarized the concept of access to healthcare in both the healthcare system and patient aspects with more specific dimensions that include availability, geographic accessibility, accommodation, affordability, and acceptability. Specifically, the dimensions of availability, geographic accessiblility, and accommodation evaluate the ease of access to care in time and space through volume, geographic location, and organization of the healthcare system. In contrast, affordability and acceptability describe the socioeconomic characteristics of patients and their attitudes toward service providers. As an alternative to the static view of access to healthcare, Khan and Bhardwaj (1994) emphasize the dynamic processes underlying access as determined by the interplay between the healthcare system and the characteristics of potential patients. Both of these concepts consider access to healthcare as a complex problem with underlying dynamic interactions between and within the characteristics of the healthcare system and the characteristics of patients and providers.
Geographic accessibility measures are important for managing healthcare provision and reducing health inequalities between population groups. In particular, geographic accessibility of healthcare refers to the ease with which residents of a given area are able to reach health services and is primarily calculated using GIS software (Langford & Higgs, 2006). Many healthcare disparities result from uneven geographic population distributions (Messinger-Rapport, 2009), health facilities, and the transportation networks between them (Todd, et al., 1991). Methods for examining geographic accessibility range from simple to complex and include travel distance or time (Brabyn & Skelly, 2002), gravity models (Schuurman, et al., 2010), and kernel density approaches (Guagliardo, et al., 2004). Efforts to advance geographical research on healthcare accessibility have pointed to opportunities for more dynamic and individualized conceptualizations of accessibility (Neutens, 2015), in keeping with the agent-based simulation approach undertaken in this study. More broadly, this study extends the geographical research on healthcare accessibility by considering the effects of social support in mediating access to care via transportation choice.
Social support refers to assistance provided by other people, groups, and the larger community through social ties (Lin, et al., 1979) and plays an important role in mitigating multiple barriers to healthcare access. Social communication affects awareness of, attitudes toward, and behaviors regarding healthcare. Instrumental support to individuals through social ties directly improves their access to healthcare. In this study, social support is simulated as an influence on access to oral healthcare for older adults via preventive screening and restorative treatment opportunities as mediated by transportation choices. This simulated social support influences access to care through the dimensions of geographic accessibility as well as acceptability.
1.1. Study aim
The aim of this study is to model social support as a pathway to improved oral healthcare accessibility and thereby utilization. By considering a community-based program in which social support has the potential to improve healthcare accessibility, this study points to opportunities for health geography research that incorporates social dynamics that may influence care-seeking behaviors. This approach contrasts with previous research on healthcare accessibility that has focused on assessing population needs and healthcare service supply using Floating Catchment Area methods (Luo & Wang, 2003; Mao & Nekorchuk, 2013; Li, et al., 2017; Jamtsho, et al., 2015). The transportation mode choice mechanism implemented in this study is based upon previous work by Jin (2014). This mechanism was also adapted by Zhang et al. (2018) to include spatially explicit road transportation networks, travel time, and a van sharing option. The social influence mechanism of the model presented herein extends beyond the earlier work of Jin (2014) by incorporating a dynamic social network that is affected by shared experiences at community centers. This dynamic network mechanism also builds upon the work of Wang et al. (2016) in a model that did not account for transportation choice.
1.2. Oral health and healthcare
Oral health is fundamental to maintaining and promoting overall health and quality of life for older adults. Poor oral health adversely impacts quality of life through processes involving declines in nutritional intake, social engagement, and economic productivity; these may in turn exacerbate adverse social, psychological, and economic circumstances, resulting in further deteriorations of overall health (Petersen & Kwan, 2011). An aging U.S. population requires both more comprehensive care for older patients and improved access to care for underserved population groups, in addition to technological solutions such as interactive self-management platforms that are developed with the active engagement of older adults (Jongstra, et al., 2017).
The present study is motivated by the ElderSmile program, a community-based initiative operated by the Columbia University College of Dental Medicine and its partners. Its clinical program provides oral and general health screening at senior centers and other places where older adults gather throughout the medically and dentally underserved neighborhoods of northern Manhattan, New York City with the overarching goal to improve health and care-seeking behaviors for primarily racial/ethnic minority older adults (Marshall, et al., 2009). Screened program participants are then referred to their own primary care and dental providers or an affiliated community-based treatment center whenever indicated.
ElderSmile exerts positive influences on the oral healthcare access of racial/ethnic minority older adults through the dimensions of availability and accommodation. Social support links the dimensions of geographic accessibility and acceptability through social ties. Communication through “word of mouth” about ElderSmile program events has a reinforcing effect on health seeking behavior as expressed through increased participation of older adults in ElderSmile screenings (Metcalf, et al., 2013; Kum, et al., 2015a; Chakraborty, et al., 2017; Zhang, et al., 2018). Moreover, social support may also increase the geographic access of older adults to screening and restorative opportunities through extending their transportation mode choices via, e.g., arranging a car or van ride to an ElderSmile event or treatment center.
Current research on healthcare accessibility has centered on population needs and healthcare service supply using a family of methods known as Floating Catchment Area (Luo & Wang, 2003; Mao & Nekorchuk, 2013; Li, et al., 2017; Jamtsho, et al., 2015). This study extends this body of research by considering a “real world” community-based program in which social support has the potential to improve oral healthcare accessibility. A hybrid agent-based model using GIS and social networks was created to simulate both the social support of older adults and their multi-modal transportation choices that may affect their access to oral healthcare, based upon the experiences of providers and patients in the ElderSmile community-based screening program in northern Manhattan. This model formalizes the hypothesis that the social support of older adults improves their access to oral healthcare. It operates by providing motivation for older adults to engage in social activities and seek oral healthcare through multiple dimensions. It also extends access to oral healthcare for older adults through the transportation mode choice by, e.g., arranging a car or van ride. Policy scenarios are then tested to examine the efficiency of the ElderSmile program on improving oral health outcomes and exploring potential opportunities to improve oral health equity for racial/ethnic minority older adults.
2. Conceptual framework
The conceptual framework presented as Fig. 1 is a causal loop diagram created to better understand the complexity of oral healthcare access, here represented as feedback mechanisms involving the oral healthcare system and older adults. In particular, it illustrates how social support affects oral healthcare access through social ties and highlights the positive influence of utilization of the preventive screening program.
Fig. 1.

Causal loop diagram of feedback mechanisms in model
In essence, a causal loop diagram is designed to identify possible dynamic behaviors of a system and consists of a set of variables and the causal links between them. The positive and negative causal links mean that the two variables change in either the same or opposite directions, respectively. Causal loop diagrams display how the feedback loops operate in the model, which is particularly useful in communicating model structure to interested stakeholders and engaging them in the design of dynamic models (Booth Sweeney & Meadows, 2010; Kum, et al., 2015b). When a chain of causal links completes a closed cycle, it is identified as either a reinforcing or a balancing loop. A reinforcing loop is a cycle in which the effect of a change in any variable propagates through the loop and returns to the variable, amplifying the initial deviation; a balancing loop is a cycle in which the effect of a change in any variable propagates through the loop and returns to the variable, counteracting the initial deviation (Sterman, 2000).
Fig. 1 presents the causal loop diagram depicting the causal mechanisms among the major model components, including social influence (social network, social engagement, and social support), availability of transportation mode choices, accessibility to oral healthcare, oral healthcare utilization, and oral health. Positive links are drawn as solid arrows and negative links are drawn as dotted arrows. A reinforcing feedback loop (R1) links social influence to accessibility to oral healthcare and oral health through participation in the preventive screening program. For instance, participation in the preventive screening program increases accessibility to oral healthcare through the referral network mechanism and thereby improves oral health. Social support deriving from social engagement increases participation in the preventive screening program directly via the “word of mouth” effect of communication. Improved oral health leads to greater social engagement. A second reinforcing loop (R2) emphasizes how participation in the preventive screening program increases oral healthcare utilization through awareness of oral healthcare. The third reinforcing loop (R3) highlights that the social network structure changes with encounters at senior centers where preventive screening events are held. Reinforcing loop R4 indicates that accessibility to the preventive screening program may be enhanced via social support increasing the availability of transportation choices, such as traveling together via a car service or van to an event. Likewise, reinforcing loop R5 illustrates that these socially influenced transportation choices also mediate access to oral healthcare. The only balancing feedback loop (B1) indicates the counteracting effect that oral health has on the need for oral healthcare as a trigger for visiting the dentist. For example, poor oral health may motivate oral healthcare utilization, which then leads to better oral health.
3. Materials and methods
3.1. Model scope
Based on the conceptual framework presented above, an agent-based simulation model was designed to simulate the influence of social support on the oral healthcare accessibility of adults aged 65 years and older living in northern Manhattan, New York City. The study context is the ElderSmile clinical program, and the study area encompasses the northern Manhattan neighborhoods of East Harlem, Central Harlem/West Harlem, and Washington Heights/Inwood. This high population density urban area roughly corresponds to the northern portion of Manhattan above Central Park. According to block group data from the 2010 U.S. Census, this area is home to 303,245 adults aged 50 years or older and 133,268 adults aged 65 years and older (Census, 2014). Northern Manhattan comprises about 8.1 square miles and consists of 126 blocks. The ElderSmile clinical program partners with 53 senior centers in northern Manhattan.
3.2. Model design
A population of 500 agents representing adults aged 65 years and older (hereafter referred to as older adults) is simulated in the agent-based model, which was designed in the AnyLogic software platform.1 Facilities include senior centers that host ElderSmile preventive screening events, and dental clinics to which older adults are referred for treatment. Preventive screening events occur every 7 days at a randomly selected senior center in the ElderSmile network under baseline assumptions. Older adult agents are initialized at a random home location within northern Manhattan as a simplifying assumption in order to be able to evaluate accessibility throughout the study area. The locations of the senior centers and dental clinics were obtained from ElderSmile program data for the time period 2007 through 2013.
A traditional method for allocating the service area of each facility (senior center) is to use a Voronoi diagram, as per the Thiessen Polygons method. As early as 1854, a Voronoi diagram was used by the British physician John Snow to visualize and study the areas with the most deaths from a cholera outbreak on Broad Street in the Soho section of London, England (Johnson, 2006). Since then, the Thiessen Polygons method has been widely applied in the study of spatially distributed data (Aurenhammer, et al., 2013), including for locating the nearest facilities assignment (Moise, et al., 2011; Fiedler, 2003).
In the context of this research, however, the ordinary Voronoi diagram method fails to consider heterogeneity among senior centers, such as the levels and types of services offered in each facility. This may introduce error in the estimation of the transportation model choice and the travel distance of the participants. A multiplicatively weighted Voronoi diagram is an improvement over the ordinal Voronoi diagram, since it considers both locational and non-locational attributes of facilities and assumes that the selection is based on a trade-off between distance and attractiveness that derives from the attributes of the facilities (Boots & South, 1998). Using this method, the average annual number of participants is used as the weight attribute, and a multiplicatively weighted Voronoi diagram (as shown in Fig. 2) is generated for the study area to allocate the service area of each senior center.
Fig. 2.

A screenshot of the study area during model simulation
There are four transportation modes available to agents to move within the study area: by foot (walk), by bus, by subway, and by car. Older adult agents need to select one or more of these modes every time they travel to senior centers to participate in activities such as preventive screenings or to dental clinics to receive indicated treatments. When determining which transportation mode to use, older adults are more likely to walk if the distance to be traveled is approximately five blocks (0.25 mile) or less (Kim & Ulfarsson, 2004).
Other transportation mode choices are determined by the network distance and affordability. If the travel distance is farther than 0.25 mile (hereafter referred to as the “walking accessible distance”), older adults will instead use public transportation options. According to the 2008 Metropolitan Transit Authority (MTA) Transportation Planning Survey (Zmud, 2009), the two favored public transportation options are subway and bus, which are assigned the probabilities of 36.1% and 63.9%, respectively. Using an approach similar to that of Mao and Nekorchuk (2013), 30-minute multi-modal accessible areas are calculated to estimate the boundaries of different transportation modes. Due to the complex traffic conditions in New York City, the transportation modes of subway and bus are considered together as “public transportation” using the same accessibility area boundary and further divided by the assigned probabilities.
Based on bus and subway timetables available from the MTA (MTA, 2016a; MTA, 2016b), the average 30-minute travel distances of a New York City bus and subway are 1.7 miles and 4.8 miles, respectively. An approximation of the average waiting time for each mode is calculated as half of the gap between two consecutive services, meaning about 4 minutes for a bus and about 6 minutes for a subway. By multiplying these travel distances with the corresponding transportation mode choice probabilities above, the 30-minute accessible area of a bus or subway in northern Manhattan is about 3.681 miles (hereafter referred to as “public transportation accessible distance”).
Finally, in this model, older adults will drive to senior centers under the joint circumstance that the distance to be traveled is farther than the public transportation accessible distance and also that they can afford to own a car. Affordability of a car is quantified based on vehicle availability by age of householder in the borough of Manhattan, New York City as obtained from the 2010–2014 American Community Survey reported on the U.S. Census Bureau website (Census Bureau, 2014). Specifically, 33.7% of older adults who self-report as home owners in Manhattan own 1 or more vehicles, compared to 93.6% of their peers in the United States overall. Further, 13.9% of older adults who self-report as home renters in Manhattan own 1 or more vehicles, compared to 61.1% of their peers in the United States overall. From these data, the probability of car affordability is calculated to be 19.7%, based on the simplifying assumption that the vehicle availability distribution in northern Manhattan is consistent with that of Manhattan overall.
Multiple levels are incorporated into this model, namely, individual, interpersonal, and community. At the individual level, older adults make decisions about where to go (senior center, dental clinic) and transportation mode (by foot, by bus) before they travel to each destination. The interpersonal level is simulated through a dynamic social network by sending an invitation to a peer to participate in a preventive screening event at a senior center (when available) or travel to an event together (share a transportation mode). The community level is used for the analysis of simulation results about participant behavior in the aggregate.
3.3. Daily routine of agents
As depicted in Fig. 3, the daily routine for each agent in the model may usefully be divided into two parts: decisions and actions. Once an agent leaves home, two decisions need to be made: (1) which center to visit (senior center, dental clinic); and (2) what transportation mode to choose. The decision of which center to visit is determined by a combination of factors: oral health status, treatment appointment, and social network.
Fig. 3.

Daily routine of older adult agents in the model
In this model, oral health status is represented by an index that ranges from 0 to 1, where 0 signifies the poorest possible oral health status (emergency dental need) and 1 signifies the best possible oral health status (not even a dental hygiene appointment indicated). Each day the value of oral health status will decrease by a randomly-generated amount from 0 to 0.01, in line with a six-month dental recall schedule. Receipt of treatment improves the oral health status for older adults. If they fail to receive oral healthcare on a regular basis, however, their oral health status decreases below a threshold for experiencing symptoms such as tooth pain, providing a motivation to attend the next available screening event.
Through the screening program, older adult agents may accept a treatment referral by scheduling an appointment at the nearest dental clinic and receive treatment the following day. If instead they already have a dentist or dental home, they may elect to visit their own dental provider for treatment. Nonetheless, if older adult agents experience dental emergencies before they are able to attend screening events, their urgent needs for treatment would lead these agents to immediately visit the nearest dental clinic for care.
An additional variable for health seeking behavior is incorporated into the model to influence the likelihood that older adult agents will participate in the screening program. This individual-level attribute is dynamically updated depending on how the oral health status of an agent changes over time. Previous research on health seeking behavior and health status (Javadzade, et al., 2012; Reinfeld-Kirkman, et al., 2010) reveals the existence of a bidirectional relationship between health seeking behavior and health status. Accordingly, in the model, the adjusted cosine function
is used to characterize this relationship. The value of oral health seeking is thus 0 when oral health status is 0.5, and 1 when oral health status is 0 or 1. A threshold parameter value for oral health seeking then determines whether or not a given agent exhibits oral health seeking behavior.
The older adult agents are further divided into two different groups according to their “social activeness,” hereafter referred to as social involvement, as described next. Agents with oral health seeking behavior are considered to be more interested in the screening program and possess a certain probability to transition into a “socially motivated” state. In this state, agents will actively send invitations to all of their social ties to join them in their daily activities, and also provide these connections with any necessary car transportation support, when available. The connected older adult agents who receive these invitations (excluding agents with symptoms) also have a probability of accepting them, and if they do, these agents will visit the same center as their “socially motivated” connections who extended the invitations, if the center is within their public transportation accessible distance. These agents are together considered as a population with social involvement, and their behavior is influenced for social purposes. The remaining agents who either didn’t receive or declined extended invitations will still visit their preferred centers and are together considered as a population without social involvement.
Next, a dynamic social network structure is embedded into the older adult agents to simulate communication. This dynamic social network is initialized by randomly connecting two agents with a probability of 2%. As there are 500 older adult agents in the model, this heuristic creates approximately 10 social ties for each agent upon initialization. Social ties are dynamically formed if two agents encounter each other at senior centers on one or more occasions (a threshold of 5 encounters is used for the baseline scenario), and break if they no longer encounter each other at senior centers after a period of time (28 days in the baseline scenario). Once a social tie has broken, agents would need to accumulate enough encounters to form a new relationship.
In the determination of transportation mode, influencing factors include geographic location and social network. The default mode of each agent is based on the geographic distance from home location to the intended destination. If the distance is shorter than the walking accessible distance, the agent will choose to walk. If the distance is farther than the public transportation accessible distance and a car is affordable, the agent will choose to travel by car. Otherwise, the agent will choose public transportation, i.e., a subway or bus, with probabilities of 36.1% and 63.9%, respectively. Regarding the social networking aspect of the model, agents invited by their connections will travel by car instead of by their default transportation mode if at least one of the connections who invited them owns a car. As a simplifying assumption, the capacity of a car is not considered.
After making their destination and transportation mode choices, the agents undertake actions via algorithms that are encoded in the model, as they leave home and visit either of the two types of centers (senior center, dental clinic). For senior center attendees, the agents participate in a screening event if they are invited by their social connections to join the screening program. The older adult agents will update their social networks based upon the agents they meet at the senior centers. Agents who are not socially involved may also participate in a screening event, based on the probability of screening, if they are visiting a center where a screening event is held. Screening program participants have opportunities to be assigned referrals for treatment if their oral health status is lower than 0.5. The probability of accepting these referrals is determined by a non-linear function of the value for oral health seeking behavior. This assumption for acceptability is consistent with a finding from the 2010 Gallup annual health and health care survey that most Americans follow a doctor’s advice without seeking a second opinion (Newport, 2010). Another condition is that the affordability of treatment must be higher than 0.5 in the baseline case, meaning agents have a 50% chance of having affordable treatment. Older adult agents who visit dental clinics on a given day will receive their indicated treatment and improve their oral health status. Afterwards, the agents return home using the same transportation mode as they did when they arrived at the facility.
The influence of cumulative experience is considered in this model on the probability of agents attending screening events. Palmer et al. (2014) reported that feeling well may lead to low perceived relevance of screening and thus poor uptake, whereas talking with others may have a positive impact on screening and subsequent uptake. Accordingly, in the model, the cumulative experience of participating in the screening program, particularly the experience with the last event, is used in conjunction with a second order inverse function for oral health seeking behavior to represent the influence of experience on both positive and negative attitudes toward screening.
3.4. Sensitivity analysis
The default or baseline settings of model parameters such as threshold values and probabilities can have significant impacts on the agent population in various states and outcomes. Whereas some parameter settings were derived from published resources such as the walking accessible distance (Kim & Ulfarsson, 2004), settings for other model parameters were tested using sensitivity analysis. Here, a widely-used sensitivity analysis approach known as One- Factor-At-a-Time (OFAT) was used as a method for exploring the parameter space of the model. Generally, it involves changing one factor at a time while keeping the other factors at their baseline values to ascertain the effect of the given change on the output (Murphy, et al., 2004). In this research, OFAT helped to evaluate the individual influence of each parameter on the output of the agent-based model. Full results of sensitivity analysis for key model parameters are provided in the Supplementary Material.
This sensitivity testing of model parameters over a set of reasonable ranges helps reveal the model behavior without imposing strong assumptions on the model structure and enables selection of appropriate default values. As one example, Fig. 4 depicts the sensitivity analysis results for the threshold value of health seeking behavior on three output indices after 3 months of simulated time over 10 simulation runs for each parameter setting: number of people with health seeking behavior, number of people with social involvement, and number of people without social involvement. Because the influence of social support is one of the key factors analyzed in this paper, setting a threshold value of 0.8 for health seeking behavior will minimize the difference in population size in these two cases (with and without social involvement), thus magnifying the significance of other social-related analyses. Therefore, the 0.8 threshold was employed in the baseline scenario for the simulation results presented in the following section.
Fig. 4.

Sensitivity analysis for the threshold value of health seeking behavior
4. Results
4.1. Scenarios for social support and geographic accessibility of oral healthcare
Participation in screening events provides a means of improving access to oral healthcare for older adults through referrals to dental providers for needed treatment. Hence, the number of screening program participants is used to compare access to oral healthcare across simulation scenarios. For the baseline scenario of the model used in this study, it is assumed that: (1) a screening event is held at one senior center in the study area every week; and (2) older adults will not attend an event when it is held outside of their public transportation accessible distance (unless they own a car or obtain a car ride from someone in their social network).
Social ties influence the geographic accessibility of oral healthcare for the study population in two ways. First, social support extends the transportation mode choice of older adults through the opportunity to obtain a car ride. Second, communication among social ties about preventive screening events links the dimension of acceptability to geographic accessibility. The effects of these mechanisms are illustrated by the “no car support” and “no social network” scenarios described next.
In the “no car support” scenario, agents form and update their social networks in the same way as in the baseline scenario, but the “socially motivated” agents only send invitations for participation in activities to their connections without providing car transportation support. By comparing the “no car support” scenario with the baseline scenario, the focus is set on the extended transportation mode choice from sharing a car ride (see Fig. 5).
Fig. 5.
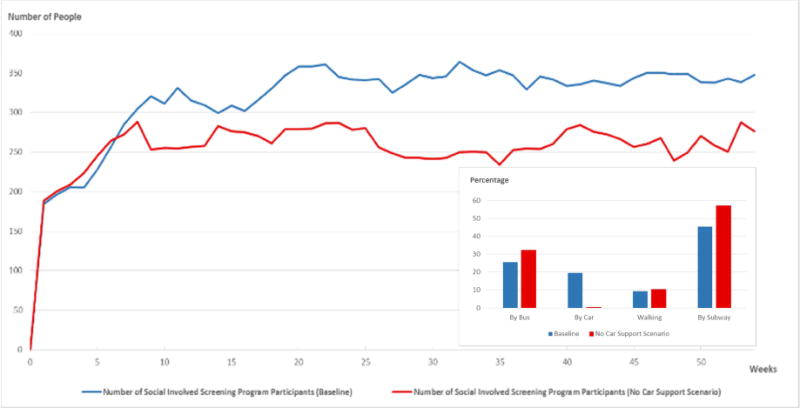
The simulated trend in the number of screening program participants for a socially involved population, comparing the output from the baseline scenario (blue) to the “no car support” scenario (red). The histogram in the inset depicts the transportation mode choice distributions after a year, comparing percentages for the baseline scenario to the “no car support” scenario.
The major difference between the baseline and “no car support” scenario is the additional car mode availability that derives from social support. The larger number of screening program participants resulting from the baseline scenario supports the notion that social support influences the geographic accessibility of oral healthcare by making more transportation mode choices available to older adults.
The histogram inset in Fig. 5 highlights that the simulated prevalence of transportation by car is much higher in the baseline scenario (20%) than in the “no car support” scenario (0.42%). Further investigation of the simulation results reveals that most of the car mode choices in the “no car support” scenario are for the screening program, meaning that the screening program provides a successful platform for older adults to become involved in social activities and gain social support. One reason for the large difference between the car mode choices in the baseline scenario versus the “no car support” scenario is the simplifying assumption to ignore car capacity, which magnifies the influence of social support on transportation mode availability. Finally, the results demonstrate that most older adult agents (72%) choose public transportation options (bus and subway) as their transportation mode.
The second illustrative scenario is termed “no social network,” meaning that no social network exists among agents. Hence, older adults only visit their preferred centers or attend a screening event by their own means. By comparing the “no social network” scenario with the “no car support” scenario, the direct influence of social support on geographic accessibility through social ties may be examined (Fig. 6).
Fig. 6.
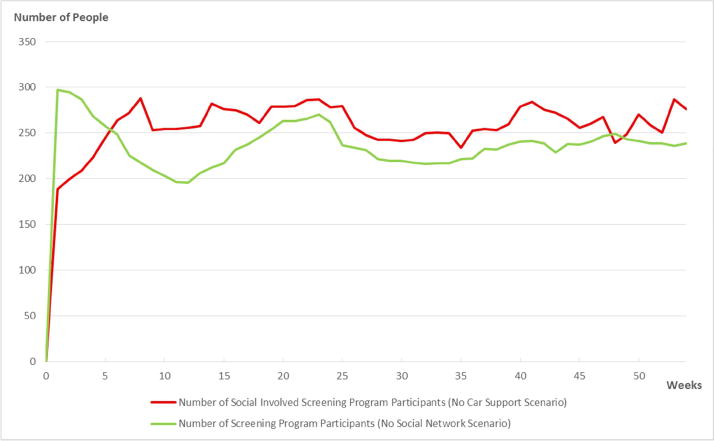
Comparison of the “no car support” scenario with the “no social network” scenario
Specifically, Fig. 6 compares the number of socially involved screening program participants in the “no car support” scenario with the number of screening program participants in the “no social network” scenario. This comparison leaves out the influence of social support on the transportation mode choice, and measures only the influence of social support through social ties. The results underscore that social support links the dimensions of geographic accessibility and acceptability through social ties.
Finally, a comparison of the average travel distance for screening program participants for the baseline scenario, the “no car support” scenario, and the “no social network” scenario is provided in Fig. 7.
Fig. 7.

Average travel distance for screening program participants in the baseline scenario, the “no car support” scenario, and the “no social network” scenario
The simulated results indicate that most of the time, agents in the baseline scenario have the longest average travel distance to a screening event. A potential interpretation of these results is that social support may help in overcoming a geographic barrier (e.g., distance) in two ways: by providing additional transportation mode choices and via social ties. The latter may take the form of communication of healthcare opportunities through word of mouth or screening event (or other health activity) invitations, thus improving access to oral healthcare and thereby health equity.
4.2. Frequency of events and coverage of the screening program
As mentioned previously, ElderSmile is a community-based initiative operated by the Columbia University College of Dental Medicine and its partners. The clinical outreach program provides oral and general health screening at senior centers throughout the underserved neighborhoods of northern Manhattan to improve oral health equity and care-seeking behaviors for racial/ethnic minority older adults (Marshall, et al., 2009).
A scenario analysis is conducted here to test the impact of this program on oral health status, social networks, and oral healthcare accessibility by comparing the baseline simulation with the “no screening program” case. Further, the influence of the frequency of events and coverage of the screening program are also tested using the cases of “one screening event held per day” and “ten screening events held per week,” as compared with the baseline simulation. Network density is an attribute of a social network that denotes the portion of potential social ties that are realized (Valente, 2010). In this study, network density is used as a structural property to evaluate the connectivity of the social network. The simulation results for average oral health status, social network density, and distance travelled are presented in Fig. 8 under these different screening program scenarios.
Fig. 8.
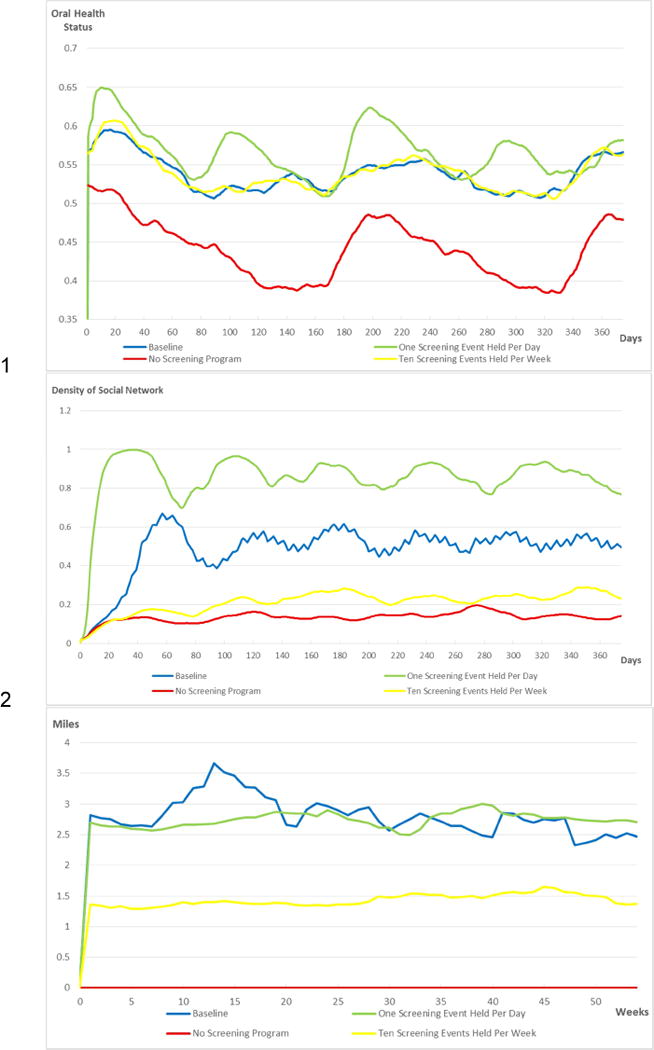
Model simulation results using different screening program assumptions: baseline (blue; one screening event held per week), one screening event held per day (green), ten screening events held per week (yellow), and no screening program (red). The top graphic provides results for the average oral health status of the older adult agents, the middle graphic provides results for the density of their social networks, and the bottom graphic provides results for the average travel distance to attend a screening event.
Results shown in the top panel of Fig. 8 reveal that the “no screening program” scenario achieves the lowest average oral health status value among the four scenarios considered, underscoring the positive impact of the ElderSmile program. Conversely, the “one screening event held per day” scenario achieves the highest average oral health status, meaning that the frequency of screening events positively impacts the oral health of the target population. Since the “ten screening events held per week” scenario signifies the greatest program coverage, it would be expected to result in meaningful improvements to the oral health status of the target population. On the other hand, having more than one event on a given day results in lower network density because the population is distributed among multiple centers. Because of this effect, and since capacity constraints on screening events were not imposed in the model, the improvement in oral health status from having more than one event per day is not evident in the simulation results, which are similar to those of the baseline scenario of once per week.
The simulation results presented in the middle graphic of Fig. 8 are consistent with the interpretation that the program helps build and maintain social network connections among older adults. Among the four scenarios tested, the highest social network density is achieved for the “one screening event held per day” scenario and the lowest social network density is obtained for the “no screening program” scenario. The scenario of “ten screening events held per week” corresponds to a lower network density than the weekly or daily frequency of events, since older adults are distributed among multiple centers on a given day. In other words, the frequency of events held is relevant to both the oral health (Fig. 8, top) and social support (Fig. 8, middle) experienced by older adults.
In the bottom graphic of Fig. 8, note that the average travel distance to attend a screening event is similar for the baseline and the “one screening event held per day” scenarios. While increasing the frequency of screening events serves to improve the oral health and social support of older adult agents as explained above, they still need to travel relatively long distances to obtain these benefits, thereby incurring travel costs. For the “ten screening events held per week” scenario, the increased coverage of the screening program facilitates the ability of older adults to attend a screening event without traveling long distances. In this way, increased program coverage leads to improved geographic accessibility and thus enhanced oral healthcare accessibility. Nonetheless, both increased frequency of screening events and increased coverage of the program lead to increased operation costs, so trade-offs are inevitable and worthy of further investigation.
5. Discussion
A major finding of this study is that social support may exert substantial influence on the daily activities and health behaviors of older adults. In particular, it may help to overcome geographic barriers (e.g., distance), lead to greater participation in health activities, and improve awareness of and accessibility to healthcare. This finding points to the potential effect of social support to improve healthcare accessibility and extends previous research demonstrating that involvement with a community-based outreach program can improve healthcare accessibility (Luo & Wang, 2003; Mao & Nekorchuk, 2013). A second major finding is that the frequency of screening events and the coverage of a program are both important determinants of improved health status at the individual and community levels, and also affect the social involvement and daily activities of older adults. These insights arise from explicit consideration of oral healthcare access in both time and space, pursuant to the directions for advances in transportation geography with respect to healthcare accessibility (Neutens, 2015). Indeed, experimentation with this simulation platform can provide guidance for healthcare service delivery in community- based settings (Buultjens, et al., 2013).
Caution is warranted, however, in extrapolating from these simulation results to inform strategies for healthcare service delivery, due to both the simplifying assumptions and the specific geographical context of the agent-based model presented herein. In Manhattan, New York City, travel by private car is not a transportation choice that would be expected to meaningfully influence oral healthcare accessibility. Instead, public transportation options meet the demands of most older adult residents, given the extensive coverage of bus and subway networks and the high frequency of bus and subway schedules in space and time. In other cities, subway and bus access may be markedly different, and thus it would be appropriate to adjust the availability or distance threshold for each mode accordingly. Further, the 30-minute multi-modal accessible areas that were calculated to estimate the boundaries of different transportation modes do not directly correspond to transportation choices made in the real world.
In this study, factors considered in the choice of transportation mode were time, cost, social support, and affordability. Additional factors are no doubt very important to the decision-making process of older adults, notably convenience, cognitive functioning, and safety. These factors may be incorporated in future extensions of the model. Planned extensions of this model also include further testing of alternative social network structures among older adults in urban environments.
A simplifying assumption in the present study was to consider only four transportation modes: by foot, by bus, by subway, and by car. For older adults in the study area, additional transportation services exist that provide free transportation, including the New York City Community Arranged Resident Transportation Program Project. Future simulation models will consider the impact of these alternative transportation modes on access to healthcare for older adults.
For this study, the smallest temporal resolution, or time unit, of the model, is “hour.” Because the model is simulated on an hourly basis, this feature of the model enables future work to simulate the specific effects of morning and evening rush hours and the operating hours of a preventive screening event on a specific day. This fine scale also enables spatio-temporal analysis of the potential clustering of participants both in time and location. While this fine resolution allows for rich representation of individual behaviors, expansion of the simulated time horizon will be pursued in future research to account for the oral health dynamics associated with aging throughout the life course.
Modeling the complexity of human agents is another goal for this line of research. For instance, when older adults utilize a transportation mode, they may then form either a positive or negative impression of it. This may subsequently induce positive or negative word of mouth about this transportation mode when they communicate with their social ties. Extensions of this simulation research will embed the richness of older adult experiences with transportation and healthcare into the model to facilitate the development of scenarios designed to improve healthcare accessibility and promote health equity for older adults.
6. Conclusions
This study employed an agent-based simulation model to explore and validate the role of social support in improving the accessibility of oral healthcare via multiple dimensions, notably through transportation mode choice. This hybrid model integrated a GIS simulation environment with a dynamic social network that was constructed to explore these mechanisms. Based on factors that may impact the decisions of older adults, this study focused specifically on how social support may influence oral health seeking behavior and healthcare accessibility at the interpersonal level through communication about preventive screening events and sharing car rides, ultimately influencing oral health outcomes at the individual level and oral health equity at the aggregate community level. The inclusion of social support through a dynamically changing social network contributes to understanding and characterization of mechanisms that might improve oral healthcare access and therefore oral health equity for older adults.
The simulation results reflect a general preference of older adults in northern Manhattan to travel by public transportation (bus or subway) instead of by foot or by car. Moreover, there is an uneven spatial distribution of oral healthcare accessibility in the study area, which may be helpful in planning suitable transportation services, such as vans that cater to older adults.
Finally, this research underscores that community-based programs such as ElderSmile may do more than raise the awareness of older adults regarding the importance of oral health and healthcare throughout the life course and improve oral health at the individual and community levels. They may also provide a social environment for older adults to communicate and connect with each other, leading to greater social engagement and influencing social network structure.
Supplementary Material
Highlights.
Social ties affect daily activities and health behaviors of older adults.
Social support influences access to care in part through transportation choices.
Community-based programs for older adults lead to greater social involvement.
More frequent screening events improve program coverage and access to care.
Program referrals to treatment improve oral health outcomes for older adults.
Acknowledgments
The authors thank members of the project team who participated in the group model-building workshops that helped refine the simulation model and improved the interpretation of the results.
Funding
This simulation research was supported by the National Institute for Dental and Craniofacial Research (NIDCR) and the Office of Behavioral and Social Sciences Research (OBSSR) of the US National Institutes of Health (NIH) for the project titled, “Integrating Social and Systems Science Approaches to Promote Oral Health Equity” (grant number R01DE023072).
Footnotes
Publisher's Disclaimer: This is a PDF file of an unedited manuscript that has been accepted for publication. As a service to our customers we are providing this early version of the manuscript. The manuscript will undergo copyediting, typesetting, and review of the resulting proof before it is published in its final citable form. Please note that during the production process errors may be discovered which could affect the content, and all legal disclaimers that apply to the journal pertain.
Additional model details are provided as Supplementary Material. The model is available upon request and may be run using the free PLE version of the AnyLogic software available for download from www.anylogic.com.
References
- Andersen RM. Revisiting the behavioral model and access to medical care: Does it matter? Journal of Health and Social Behavior. 1995;36(1):1–10. doi: 10.2307/2137284. [DOI] [PubMed] [Google Scholar]
- Aurenhammer F, Klein R, Lee DT. Voronoi Diagrams and Delaunay Triangulations. World Scientific. 2013;337 doi: 10.1007/978-1-4939-2864-4_507. [DOI] [Google Scholar]
- Berk ML, Schur CL. Measuring access to care: improving information for policymakers. Health Affairs. 1998;17(1):180–186. doi: 10.1377/hlthaff.17.1.180. [DOI] [PubMed] [Google Scholar]
- Booth Sweeney L, Meadows D. The Systems Thinking Playbook: Exercises to Stretch and Build Learning and Systems Thinking Capabilities. White River Junction, VT: Chelsea Green; 2010. [Google Scholar]
- Boots B, South R. Modeling retail trade areas using higher-order, multiplicatively weighted Voronoi diagrams. Journal of Retailing. 1998;4(519–536):73. doi: 10.1016/S0022-4359(97)90033-6. [DOI] [Google Scholar]
- Brabyn L, Skelly C. Modeling population access to New Zealand public hospitals. International Journal of Health Geographics. 2002;1:3. doi: 10.1186/1476-072X-1-3. [DOI] [PMC free article] [PubMed] [Google Scholar]
- Buultjens M, Robinson P, Murphy G, Milgrom J. The range and accessibility of maternity models of care and allied health service delivery across public hospitals within Victoria, Australia. GSTF Journal of Nursing and Health Care (JNHC) 2013;1(1):21–28. doi: 10.5176/2345-718X_1.1.3. [DOI] [Google Scholar]
- Census Bureau, US. American Fact Finder. 2014 Retrieved from https://factfinder.census.gov/faces/nav/jsf/pages/index.xhtml, Accessed date: 15 July 2017.
- Chakraborty B, Widener MJ, Salehabadi SM, Northridge ME, Kum SS, Jin Z, Kunzel C, Palmer HC, Metcalf SS. Estimating peer density effects on oral health for community-based older adults. BMC Oral Health. 2017;17(1):166. doi: 10.1186/s12903-017-0456-4. [DOI] [PMC free article] [PubMed] [Google Scholar]
- da Costa FA, Teixeira I, Duarte-Ramos F, Proença L, Pedro AR, Furtado C, da Silva JA, Cabrita J. Effects of economic recession on elderly patients’ perceptions of access to health care and medicines in Portugal. International Journal of Clinical Pharmacy. 2017;39(1):104–112. doi: 10.1007/s11096-016-0405-3. [DOI] [PubMed] [Google Scholar]
- Fiedler F. Simple, practical method for determining station weights using Thiessen Polygons and Isohyetal Maps. Journal of Hydrological Engineering. 2003;8(4):219–221. doi: 10.1061/(ASCE)1084-0699(2003)8:4(219). [DOI] [Google Scholar]
- Guagliardo M, Ronzio C, Cheung I, Chacko E, Joseph J. Physician accessibility: An urban case study of pediatric providers. Health & Place. 2004:273–283. doi: 10.1016/j.healthplace.2003.01.001. [DOI] [PubMed] [Google Scholar]
- Jamtsho S, Corner R, Dewan A. Spatio-temporal analysis of spatial accessibility to primary health care in Bhutan. International Journal of Geo-Information. 2015;4(3):1584–1604. doi: 10.3390/ijgi4031584. [DOI] [Google Scholar]
- Javadzade SH, Sharifirad G, Radjati F, Mostafavi F, Reisi M, Hasanzade A. Relationship between health literacy, health status, and healthy behaviors among older adults in Isfahan, Iran. Journal of Education and Health Promotion. 2012;1(31) doi: 10.4103/2277-9531.100160. [DOI] [PMC free article] [PubMed] [Google Scholar]
- Jin Z. Master’s Thesis. University at Buffalo Department of Geography; 2014. The Influence of Social Support and Transportation on Older Adults’ Access to Oral Healthcare. [Google Scholar]
- Johnson S. The Ghost Map: The Story of London’s Most Terrifying Epidemic--And How It Changed Science, Cities, and the Modern World. New York: Riverhead Books; 2006. [Google Scholar]
- Jongstra S, Beishuizen C, Andrieu S, Barbera M, van Dorp M, van de Groep B, Guillemont J, Mangialasche F, van Middelaar T, Moll van Charante P, Soininen H, Kivipelto M, Richard E. Development and validation of an interactive Internet platform for older people: The healthy ageing through Internet counselling in the elderly study. Telemedicine and e-Health. 2017;23(2) doi: 10.1089/tmj.2016.0066. [DOI] [PubMed] [Google Scholar]
- Khan AA, Bhardwaj SM. Access to health care: A conceptual framework and its relevance to health care planning. Evaluation & the Health Professions. 1994;17(1):60–76. doi: 10.1177/016327879401700104. [DOI] [PubMed] [Google Scholar]
- Kim S, Ulfarsson G. Travel mode choice of the elderly – Effects of personal, household, neighborhood, and trip characteristics. Journal of the Transportation Research Board. 2004;(1894):117–126. doi: 10.3141/1894-13. [DOI] [Google Scholar]
- Kum SS, Wang H, Wang P, Jin Z, De La Cruz L, Northridge ME, Kunzel C, Marshall SE, Metcalf SS. The ElderSmile TimeMap: Benefits of connecting statistics with time and place. American Journal of Public Health. 2015a;105(9):1748–1750. doi: 10.2105/AJPH.2015.302730. [DOI] [PMC free article] [PubMed] [Google Scholar]
- Kum SS, Wang H, Jin Z, Xu W, Mark J, Northridge ME, Metcalf SS. Proceedings of the 33rd International Conference of the System Dynamics Society. Cambridge, MA: System Dynamics Society; 2015b. Boundary objects for group model building to explore oral health equity. Retrieved from http://www.systemdynamics.org/conferences/2015/proceed/papers/P1302.pdf, Accessed date: 12 April 2018. [Google Scholar]
- Langford M, Higgs G. Measuring Potential Access to Primary Healthcare Services: The Influence of Alternative Spatial Representations of Population. The Professional Geographer. 2006:294–306. doi: 10.1111/j.1467-9272.2006.00569.x. [DOI] [Google Scholar]
- Li Y, Vo A, Randhawa M, Fick G. Designing utilization-based spatial healthcare accessibility decision support systems: A case of a regional health plan. Decision Support Systems. 2017;99:51–63. doi: 10.1016/j.dss.2017.05.011. [DOI] [Google Scholar]
- Lin N, Ensel WM, Simeone RS, Kuo W. Social support, stressful life events, and illness: A model and an empirical test. Journal of Health and Social Behavior. 1979;20(2):108–119. doi: 10.2307/2136433. [DOI] [PubMed] [Google Scholar]
- Luo W, Wang F. Measures of spatial accessibility to health care in a GIS environment: synthesis and a case study in the chicago region. Environment and Planning B: Urban Analytics and City Science. 2003;30(6) doi: 10.1068/b29120. [DOI] [PMC free article] [PubMed] [Google Scholar]
- Mao L, Nekorchuk D. Measuring spatial accessibility to healthcare for populations with multiple transportation modes. Health & Place. 2013;24:115–122. doi: 10.1016/j.healthplace.2013.08.008. [DOI] [PubMed] [Google Scholar]
- Marshall S, Northridge ME, De La Cruz LD, Vaughan RD, O’Neil-Dunne J, Lamster IB. ElderSmile: A comprehensive approach to improving oral health for older adults. American Journal of Public Health. 2009;99:595–599. doi: 10.2105/AJPH.2008.149211. [DOI] [PMC free article] [PubMed] [Google Scholar]
- Messinger-Rapport B. Disparities in long-term healthcare. Nursing Clinics of North America. 2009:179–185. doi: 10.1016/j.cnur.2009.02.005. [DOI] [PubMed] [Google Scholar]
- Metcalf SS, Northridge ME, Widener MJ, Chakraborty B, Marshall SE, Lamster IB. Modeling social dimensions of oral health in urban environments. Health Education & Behavior. 2013;40(1S):63S–73S. doi: 10.1177/1090198113493781. [DOI] [PMC free article] [PubMed] [Google Scholar]
- Moise IK, Kalipeni E, Zulu LC. Analyzing geographical access to HIV Sentinel in relation to other health clinics in Zambia. Journal of Map & Geography Libraries. 2011;7(3):254–281. doi: 10.1080/15420353.2011.599756. [DOI] [Google Scholar]
- MTA. New York City Transit Bus Timetable, effective September 4, 2016. 2016a Retrieved from http://web.mta.info/nyct/bus/schedule/manh/m003cur.pdf, Accessed date: 15 July 2017.
- MTA. New York City Transit Subway Timetable, effective June 12, 2016. 2016b Retrieved from http://web.mta.info/nyct/service/pdf/t2cur.pdf, Accessed date: 15 July 2017.
- Murphy JM, Sexton DM, Barnett DN, Jones GS, Webb MJ, Collins M, Stainforth DA. Quantification of modelling uncertainties in a large ensemble of climate change simulations. Nature. 2004:768–772. doi: 10.1038/nature02771. [DOI] [PubMed] [Google Scholar]
- Neutens T. Accessibility, equity and health care: Review and research directions for transport geographers. Journal of Transport Geography. 2015;43:14–27. doi: 10.1016/j.jtrangeo.2014.12.006. [DOI] [Google Scholar]
- Newport F. Most Americans Take Doctor’s Advice Without Second Opinion. Washington, DC: Gallup News Poll; 2010. Retrieved from http://news.gallup.com/poll/145025/Americans-Doctor-Advice-Without-Second-Opinion.aspx, Accessed date: 15 July 2017. [Google Scholar]
- Northridge ME, Chakraborty B, Kunzel C, Metcalf S, Marshall S, Lamster IB. What contributes to self‐rated oral health among community‐dwelling older adults? Findings from the ElderSmile program. Journal of Public Health Dentistry. 2012;245(3):235. doi: 10.1111/j.1752-7325.2012.00313.x. [DOI] [PMC free article] [PubMed] [Google Scholar]
- Palmer CK, Thomas MC, von Wagner C, Raine R. Reasons for non-uptake and subsequent participation in the NHS Bowel Cancer Screening Programme: a qualitative study. British Journal of Cancer. 2014;110(7):1705–1711. doi: 10.1038/bjc.2014.125. [DOI] [PMC free article] [PubMed] [Google Scholar]
- Park DS. Challenges of delivering oral health care to older adults. The New York State Dental Jounal. 2009;75(5):36–40. [PubMed] [Google Scholar]
- Penchansky R, Thomas JW. The concept of access: definition and relationship to consumer satisfaction. Medical Care. 1981;19(2):127–140. doi: 10.1097/00005650-198102000-00001. [DOI] [PubMed] [Google Scholar]
- Petersen PE, Kwan S. Equity, social determinants and public health programmes – the case of oral health. Community Dentistry & Oral Epidemiology. 2011;39(6):481–487. doi: 10.1111/j.1600-0528.2011.00623.x. [DOI] [PubMed] [Google Scholar]
- Reinfeld-Kirkman N, Kalucy E, Roeger L. The relationship between self-reported health status and the increasing likelihood of South Australians seeking Internet health information. Australian and New Zealand Journal of Public Health. 2010:422–426. doi: 10.1111/j.1753-6405.2010.00576.x. [DOI] [PubMed] [Google Scholar]
- Russell DJ, Humphreys JS, Ward B, Chisholm M, Buykx P, McGrail M, Wakerman J. Helping policy-makers address rural health access problems. The Australian Journal of Rural Health. 2013:61–71. doi: 10.1111/ajr.12023. [DOI] [PubMed] [Google Scholar]
- Schuurman N, B´erub´e M, Crooks VA. Measuring potential spatial access to primary health care physicians using a modified gravity model. The Canadian Geographer. 2010;1:29–45. doi: 10.1111/j.1541-0064.2009.00301.x. [DOI] [Google Scholar]
- Sterman JD. Business Dynamics: Systems Thinking and Modeling for a Complex World. United States: McGraw-Hill; 2000. [Google Scholar]
- Todd JS, Seekins SV, Krichbaum JA, Harvey LK. Health Access America—Strengthening the US Health Care System. The Journal of the American Medical Association. 1991;265(19):2503–2506. doi: 10.1001/jama.1991.03460190079024. [DOI] [PubMed] [Google Scholar]
- Wang H, Northridge ME, Kunzel C, Zhang Q, Kum SS, Gilbert JL, Metcalf SS. Lecture Notes in Computer Science. Vol. 9708. Cham: Springer; 2016. Modeling social capital as dynamic networks to promote access to oral healthcare. In: Xu K, Reitter D, Lee D, Osgood N (eds) Social, Cultural, and Behavioral Modeling. SBP-BRiMS 2016; pp. 117–130. [DOI] [PMC free article] [PubMed] [Google Scholar]
- Valente TW. Social Networks and Health. New York: Oxford University Press; 2010. [Google Scholar]
- Zhang Q, Northridge ME, Jin Z, Metcalf SS. Modeling accessibility of screening and treatment facilities for older adults using transportation networks. Applied Geography. 2018;93:64–75. doi: 10.1016/j.apgeog.2018.02.013. [DOI] [PMC free article] [PubMed] [Google Scholar]
- Zmud J. 2008 New York Customer Travel Survey Final Report. 2009 Retrieved from http://web.mta.info/mta/planning/data/NYC-Travel-Survey/NYCTravelSurvey.pdf, Accessed date: 15 July 2017.
Associated Data
This section collects any data citations, data availability statements, or supplementary materials included in this article.