. 2018 Jul 10;7:e34961. doi: 10.7554/eLife.34961

Figure 1. Expression variations among HLA-Bw6 alleles.

Forty-three healthy donors (Figure 1—source data 1) with either heterozygosity for HLA-Bw4/Bw6 or homozygosity for HLA-Bw6 alleles were sorted into six groups based on their Bw6 alleles. ABC values were calculated by flow cytometry based on staining freshly isolated PBMCs with anti-Bw6 or W6/32 and normalizing the resulting geometric MFI values against beads with known amounts of Fc receptors. Averaged ABC values for each donor are shown, grouped by the donor’s HLA-Bw6 alleles and lymphocyte subset analyzed (B cells (top row), CD4+ T cells (second row), CD8+ T cells (third row), and NK cells (last row)). For homozygous donors, 50% of the derived ABC values are plotted. Bw6 ABC values alone (column 1), W6/32 ABC values alone, (column 2) and the Bw6/W6/32 ABC ratios (column 3) are shown. The number of replicate measurements for each donor and standard errors of the mean are shown in Figure 1—source data 1. Statistically significant differences between alleles were analyzed by one-way ANOVA analysis for each cell type. Each dot represents averaged Bw6, W6/32, or Bw6/W6/32 ABC measurements (n > 3) from a single donor. p *<0.05; **<0.01; ***<0.001; ****<0.0001. This figure has five supplementary figures and one source data table.

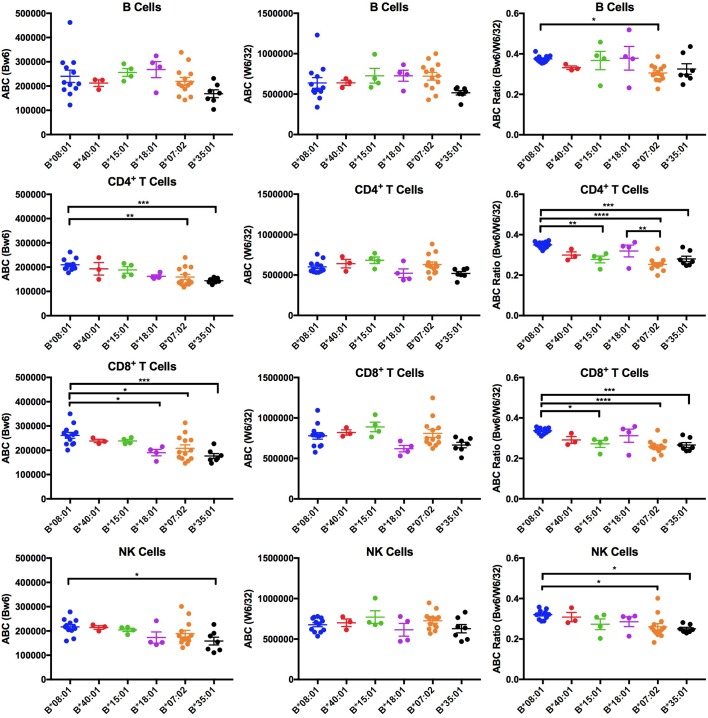
Figure 1—source data 1. Expression variations among HLA-Bw6 alleles.
HLA class I genotypes of donors used for Bw6 measurements, and mean of ABC values measured with anti-Bw6 and W6/32 for each lymphocyte subset. The HLA-B-Bw6 allele of each donor is highlighted in bold. Standard errors of the mean (SEM) values and the number of replicate measurements (N; with separate blood collections) are indicated.
DOI: 10.7554/eLife.34961.009

Figure 1.

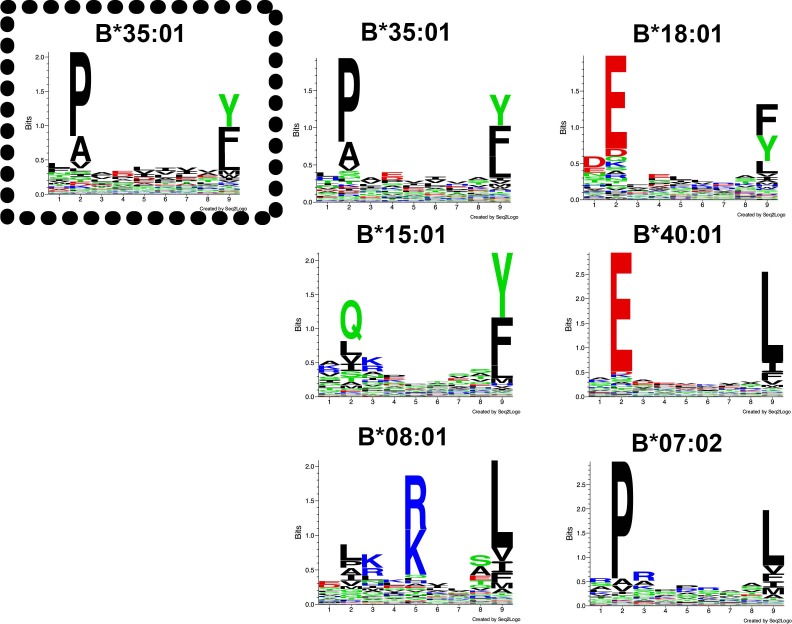
Figure 1—figure supplement 1. Peptide-binding motifs of several HLA-Bw6 allotypes relevant to this study.

Figure 1—figure supplement 1.

Peptides were analyzed using seq2logo: http://www.cbs.dtu.dk/biotools/Seq2Logo/ (Thomsen and Nielsen, 2012). Peptides for the boxed allele (left panel) were derived from a published dataset based on the immunoaffinity method (Abelin et al., 2017) and others were obtained from a published dataset based on acid elution of cells and epitope predictions (Pearson et al., 2016).
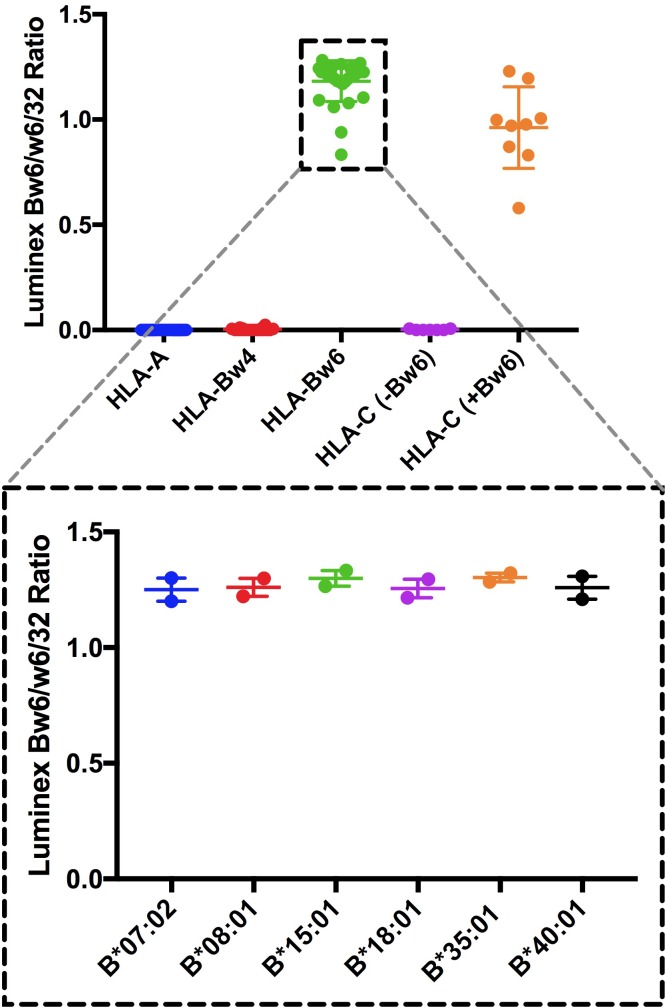
Figure 1—figure supplement 2. Validations of anti-Bw6.

Figure 1—figure supplement 2.

Top panel: Anti-Bw6 (One Lambda BiH0038) was assessed for binding to different HLA class I conjugated to Luminex beads (Class I-LS1A04NC. LABScreen, One Lambda Inc.). Signals are plotted as ratios relative to those obtained with W6/32, a pan HLA class I antibody. Bottom panels: Relative binding of anti-Bw6 to HLA-B allotypes relevant to this study. Binding was similar across the Bw6 allotypes for which expression and stability measurements are reported here. Data are based on two independent binding measurements.
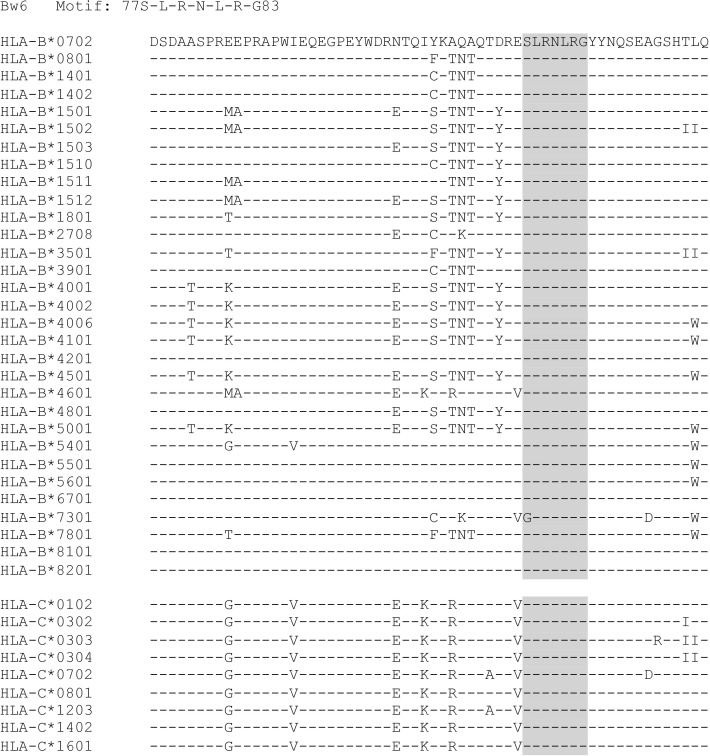
Figure 1—figure supplement 3. Sequences of HLA-B and HLA-C alleles with a Bw6 motif.

Figure 1—figure supplement 3.

Relevant HLA-B and HLA-C alleles are aligned at the Bw4/6 region.
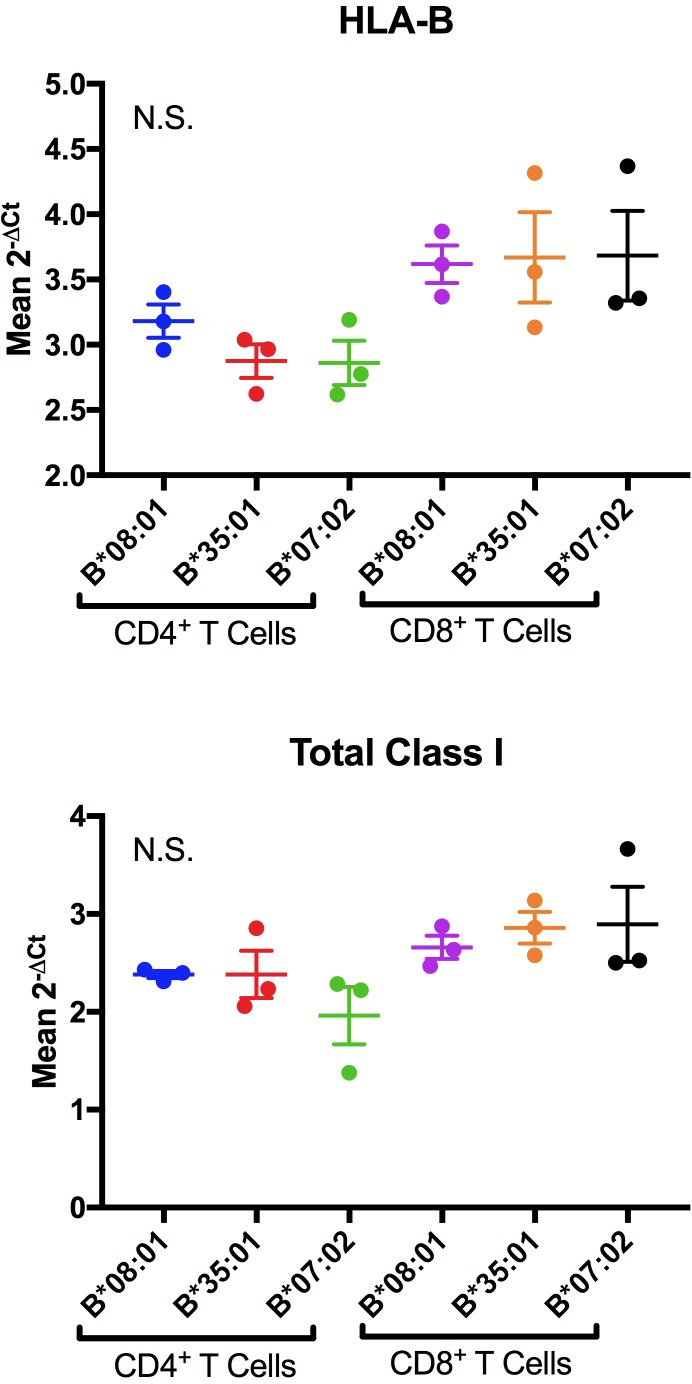
Figure 1—figure supplement 4. Representative RT-PCR measurements of HLA-B and total class I RNA levels for donors expressing indicated Bw6 alleles.

Figure 1—figure supplement 4.

Three technical replicates with the same cDNA samples were conducted and a one-way ANOVA analysis of the 2-ΔCt values was used to determine significance. Each dot represents the mean 2-ΔCt values across three technical replicates from isolated cells from individual donors expressing the indicated HLA-B allele. Neither the HLA-B specific primer (top panels) nor the total Class I primer (lower panels) showed significant differences in mRNA levels. There was a trend of higher expression in CD8+ T cells but it did not rise to significance. This result was consistent across two biological replicates comparing alleles that showed differences in ABC measurements.
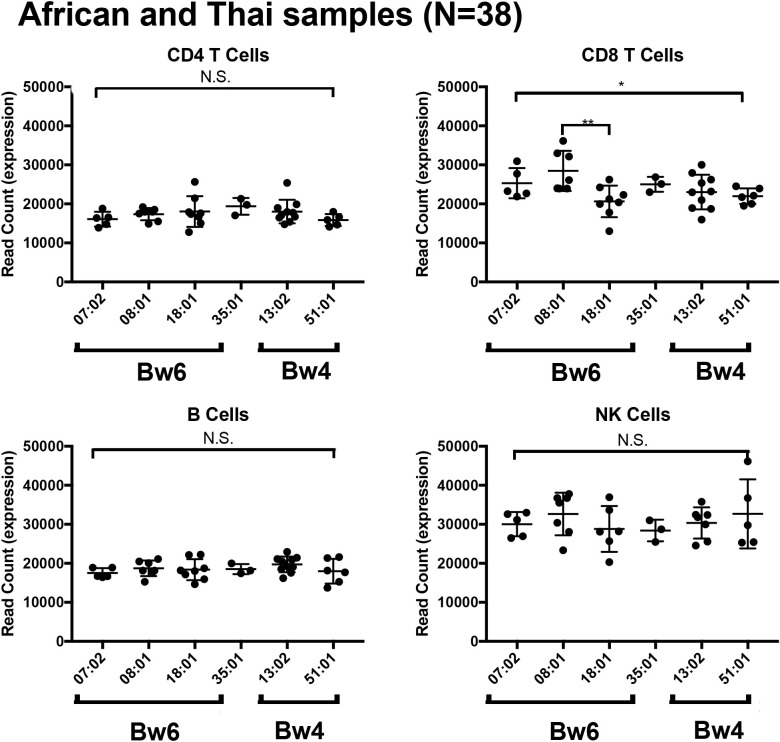
Figure 1—figure supplement 5. HLA-B mRNA expression within four lymphocyte populations in donors from Africa and Thailand.

Figure 1—figure supplement 5.

Total HLA-B expression of each individual was plotted for the HLA-B allele of interest and averaged expression was compared between alleles for each cell subset. There were no significant differences observed between HLA-B allele mRNA expression in CD4 T cells, B cells and NK cells in all donors consisting of samples from Africa and Thailand. A significant association was observed in the CD8 T cells.