

Abstract
Ertugliflozin, a sodium glucose cotransporter‐2 inhibitor, is approved in the United States for treatment of type 2 diabetes mellitus. A novel two‐period study design with 14C microtracer dosing in each period was used to determine absolute oral bioavailability (F) and fraction absorbed (Fa) of ertugliflozin. Eight healthy adult men received 100‐μg i.v. 14C‐ertugliflozin (400 nCi) dose 1 h after a 15‐mg oral unlabeled ertugliflozin dose (period 1), followed by 100 μg 14C‐ertugliflozin orally along with 15 mg oral unlabeled ertugliflozin (period 2). Unlabeled ertugliflozin plasma concentrations were determined using high‐performance liquid‐chromatography tandem mass spectrometry (HPLC‐MS/MS). 14C‐ertugliflozin plasma concentrations were determined using HPLC‐accelerator mass spectrometry (AMS) and 14C urine concentrations were determined using AMS. F ((area under the curve (AUC)p.o./14C‐AUCi.v.)*(14C‐Dosei.v./Dosep.o.)) and Fa ((14C_Total_Urinep.o./14C_Total_Urinei.v.)* (14C‐Dosei.v./14C‐Dosep.o.)) were estimated. Estimates of F and Fa were 105% and 111%, respectively. Oral absorption of ertugliflozin was complete under fasted conditions and F was ∼100%. Ertugliflozin was well tolerated.
Study Highlights
WHAT IS THE CURRENT KNOWLEDGE ON THE TOPIC?
✓ Ertugliflozin is a highly selective and potent inhibitor of the sodium glucose cotransporter‐2 approved in the United States for the treatment of type 2 diabetes mellitus. Assessment of absolute bioavailability (F) and fraction absorbed (Fa) can assist formulation development and increase understanding of a drug's absorption and metabolism.
WHAT QUESTION DID THIS STUDY ADDRESS?
✓ This study determined F and Fa of ertugliflozin using a novel two‐period study design with 14C microtracer dosing in each period.
WHAT DOES THIS STUDY ADD TO OUR KNOWLEDGE?
✓ This approach successfully enabled determination of F. As both F and Fa were ∼100%, ertugliflozin is considered to be highly permeable, an attribute supportive of a request for waiver of bioequivalence studies.
HOW THIS MIGHT CHANGE DRUG CLINICAL PHARMACOLOGY OR TRANSLATIONAL SCIENCE
✓ To our knowledge, this novel approach, which estimates both F and Fa in a single study, has not been reported in the literature to date and may aid in the discovery and development of future medicines.
Ertugliflozin, a highly selective and potent inhibitor of the sodium glucose cotransporter‐2,1, 2 has been approved in the United States for the treatment of type 2 diabetes mellitus at doses of 5 and 15 mg once daily. Recent phase III trials have demonstrated that ertugliflozin is associated with statistically significant reductions in hemoglobin A1c, fasting plasma glucose, and body weight when used as monotherapy (compared with placebo),3 and when added to sitagliptin4 or metformin plus sitagliptin.5 When dosed in the fasting state, ertugliflozin pharmacokinetics are characterized by rapid absorption following oral administration (with median time to maximum concentration (Tmax) occurring at 0.5–1.5 h postdose), dose proportionality in exposure (area under the curve (AUC) and maximum concentration (Cmax)) over a dose range of 0.5–300 mg, and a terminal elimination half‐life (t1/2) of 11–17 h.1 The metabolism and excretion of ertugliflozin was characterized following a single 25‐mg oral dose of 14C‐ertugliflozin to healthy male subjects.2 In humans, the principal biotransformation pathway was shown to be glucuronidation, whereas oxidative metabolism was minor and renal excretion of unchanged ertugliflozin was negligible (1.5%). The mean urinary 14C recovery suggested that the human fraction of ertugliflozin dose absorbed (Fa) is at least 50%.2 Metabolism of ertugliflozin is catalyzed mainly by uridine diphosphate‐glucuronosyltransferase‐1A9, with minor contributions from uridine diphosphate‐glucuronosyltransferase‐2B7 and cytochrome P450 isoenzymes.1, 2
Absolute bioavailability studies improve our understanding of the key pharmacokinetic properties of new chemical entities in drug development. This is particularly important for compounds with low exposure after oral administration, in which an absolute bioavailability study can help clarify whether low exposure is due to poor absorption or high systemic clearance. Measurement of parameters such as clearance and volume of distribution after i.v. administration enable the development of physiologically based pharmacokinetic models for the simulation of drug–drug interactions, which can be submitted as part of regulatory filings.6
Traditionally, the absolute bioavailability (F) of a compound administered via the oral route is determined using a two‐period crossover study design in which dose‐normalized exposure following an oral dose is compared with that following an i.v. dose. However, this approach requires the development of a suitable i.v. formulation and extensive toxicity studies after i.v. administration prior to dosing in humans. Another approach is to use a radiolabeled microdose for the i.v. component of the study, wherein in a single‐period study design, the i.v. microdose (14C‐isotopically labeled compound) is administered simultaneously at the Tmax of the oral (unlabeled) therapeutic dose.7 The single‐period design offers advantages in terms of study duration as i.v. assessment can be conducted concurrently with oral assessment rather than at a separate time following a washout period. Simultaneous administration of the microdose i.v. dose at the Tmax of the oral dose determines i.v. pharmacokinetics at therapeutically relevant concentrations of the compound, thereby addressing concerns regarding pharmacokinetic linearity of the microdose, and improves precision of the bioavailability estimate due to the lack of interoccasion variability.8, 9, 10, 11
The microtracer approach, where doses are typically 1/100th to 1/1,000th of the therapeutic dose (or ≤100 μg), and, in cases in which radioisotopes are administered, radioactivity is <1,000 nCi, provides several advantages over traditional methods.8, 9, 10, 11 If the radioactive dose administered is very low (<1,000 nCi), subjects are exposed to extremely low amounts of radiation; therefore, supporting data from dosimetry studies in animals are not required.8 Because the i.v. dose is low relative to the oral dose, and adequate exposure multiples have been achieved following oral dosing, toxicity studies following i.v. administration are typically not necessary. In addition, the use of very low i.v. tracer doses means that a liquid formulation for i.v. administration can be readily and rapidly manufactured under aseptic conditions. The microdose i.v. formulation development package is abbreviated and flexible, allowing manufacturing within 1–3 days of dosing and demonstration of stability only over the period from manufacture to dosing, whereas minimum stability requirements for conventional i.v. manufacture would be longer (e.g., 6 months). The microdose study design does require the use of sensitive analytical methods capable of discriminating isotopically labeled compound from unlabeled material. Examples of such techniques include high‐performance liquid chromatography with tandem mass spectrometric (HPLC‐MS/MS) detection and accelerator mass spectrometry (AMS).12 When planning studies, appropriate time needs to be allotted for analytical method development and validation. For AMS, the development of a method for the offline separation of analyte from any metabolites also needs to be considered.
For orally administered new chemical entities, bioequivalence (BE) studies are typically required for formulation changes both during drug development and postapproval. However, biowaivers for clinical BE studies have been granted for immediate‐release dosage forms with rapid in vitro dissolution for compounds that are highly permeable and highly soluble based on the Biopharmaceutical Classification System, as outlined in the US Food and Drug Administration guidance for industry.13 Ertugliflozin is highly soluble; 15 mg is completely soluble in 250 mL aqueous media, and ertugliflozin immediate‐release tablets display rapid in vitro dissolution characteristics, with ≥85% dissolved in 15 min over the gastrointestinal pH range (1.2–6.8; data on file). A compound is classified as having high permeability when (Fa is determined to be ≥85% of an administered dose based on results from human mass balance or absolute bioavailability studies. In the ertugliflozin human mass balance study, ertugliflozin Fa was estimated to be ≥50%,2 whereas in preclinical species, estimated Fa was ∼75% and ∼100% in rats and dogs, respectively.1 In Caco‐2 cells, ertugliflozin permeability coefficient was 4.1 × 10⁻⁶ cm/s in the apical (A) to basolateral (B) direction (BA/AB ratio of 2.1).1 In light of these data, a clinical study was conducted to get a better understanding of permeability and obtain an estimate of the absolute bioavailability of ertugliflozin. An F >85% indicates high permeability. If F is <85%, then Fa can be estimated using the observed clinical data and in vitro results.14, 15 However, in vitro estimates of permeability used in such estimations are limited by the variability between studies, which in turn reflects on the quantitative prediction of Fa and represents a great challenge for in vitro‐in vivo extrapolations.
Considering the impact of high‐permeability designation and Biopharmaceutical Classification System classification on the drug development of ertugliflozin, it was deemed advantageous to measure Fa directly in a clinical study. This was achieved by modification of the single‐period microtracer study design to enable measurement of Fa. Fa can be measured by adding a second period (period 2) after washout of the radiolabel from period 1. In period 2 of this fixed‐sequence design study, the microdose (14C‐labeled compound) is administered orally and simultaneously with the oral (unlabeled) therapeutic dose. Following collection of urine from periods 1 and 2, Fa can be measured by comparison of dose‐adjusted urine (14C) from period 1 (i.v.) and period 2 (oral). This novel two‐period crossover microdose study design for measurement of Fa enables clear assessment of human permeability to support regulatory filings.
Certain challenges exist with measurement of both F and Fa using this method. When measuring F in period 1, the i.v. component is administered as a microdose; therefore, sensitive analytical methods are needed to adequately quantify the concentration‐time profile and subsequently AUC. For Fa, accurate measurement of urine 14C in both periods as well as precise measurement of the dose administered is critical.
The purpose of this study (ClinicalTrials.gov NCT02411929) was to characterize the absolute bioavailability using the microtracer approach described above. This article describes the study design and results of the single two‐period study that enabled determination of both F and Fa for ertugliflozin.
MATERIALS AND METHODS
Study design
This phase I, open‐label, nonrandomized, fixed‐sequence, two‐period, single‐dose study was conducted between October 2014 and February 2015 at Quotient Clinical, Nottingham, UK. The primary objective was to determine F for ertugliflozin. Secondary objectives were to determine the pharmacokinetics of ertugliflozin following i.v. administration, including Fa, and assess the safety and tolerability of ertugliflozin following simultaneous oral/i.v. administration. The study was conducted in compliance with the ethical principles of the Declaration of Helsinki and in compliance with all International Conference on Harmonisation Good Clinical Practice guidelines. The final protocol and informed consent documentation were reviewed and approved by the independent ethics committee at the investigational center (HSC Rec A, Lisburn, Antrim, UK).
Participants
Eight healthy male subjects aged 18 to 65 years inclusive, with a body mass index of 17.5–30.5 kg/m2 and total body weight >50 kg (110 lb), who had provided a signed informed consent form and were willing and able to comply with the study plan were enrolled. Subjects with the following were not eligible to participate in the study: positive urine screen for drugs of abuse or recreational drugs, history of alcohol abuse or binge drinking, and/or any other illicit drug use or dependence within 6 months of screening; radiation exposure (including this study) exceeding 5 mSV within the last 12 months, 10 mSV in the last 5 years, or any occupational exposure; estimated glomerular filtration rate of <90 mL/min/1.73 m2 based on the four‐variable Modification of Diet in Renal Disease equation16; known hypersensitivity or intolerance to any sodium glucose cotransporter‐2 inhibitor.
Study treatments
Each subject received two treatment regimens (Figure 1). In period 1, subjects received a 15‐mg oral dose of unlabeled ertugliflozin (administered as three 5‐mg tablets), followed 55 min later by an i.v. dose of 100 μg 14C‐ertugliflozin (10 mL of a 10‐μg/mL solution containing ∼400 nCi (radiolabeled ertugliflozin)) infused over ∼5 min, with the infusion ending at the expected Tmax of 1 h for the oral dose. Oral ertugliflozin was administered after an overnight fast of at least 8 h. In period 2, subjects received a 15‐mg oral dose of unlabeled ertugliflozin (administered as three 5‐mg tablets) along with a 100‐μg 14C‐ertugliflozin oral dose (containing ∼400 nCi (radiolabeled ertugliflozin)). Both the unlabeled and the 14C‐ertugliflozin doses were administered at the same time (no more than 5 min apart), with the unlabeled dose administered before the 14C‐labeled dose. Both doses were administered after an overnight fast of at least 8 h.
Figure 1.
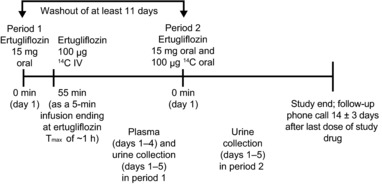
Study design. Tmax, time to maximum concentration.
The i.v. and oral 14C‐ertugliflozin formulation was manufactured as a 10‐μg/mL solution at Quotient Clinical using Quotient's rapid small‐scale, aseptic manufacturing process for parenterals, which is licensed by the Medicines and Healthcare Products Regulatory Agency. Administration of 14C‐ertugliflozin was performed by qualified investigator site personnel. Following oral administration of the 14C‐ertugliflozin solution, ∼240 mL of ambient temperature water was given to each subject. Dosing in periods 1 and 2 was separated by a washout of at least 11 days. Eligible subjects were confined to the clinical research unit from the day prior to administration of the study drug until day 5 of each treatment period. Subjects who withdrew from the study were not replaced unless the number of evaluable subjects fell below six.
Analysis of dosing solution and determination of administered dose for 14C‐ertugliflozin
In both periods 1 and 2, the 14C‐ertugliflozin dosing solution was analyzed for total 14C using liquid scintillation counting. For both i.v. and oral administration of 14C‐ertugliflozin, the difference in the syringe assembly weight before and after administration (corrected for specific density of the dosing solution) was used in conjunction with the dosing solution concentration data to determine the exact dose administered.
Pharmacokinetic assessments
Serial blood samples for pharmacokinetic assessment were collected at the following times over days 1–4 in period 1: samples for unlabeled ertugliflozin were collected predose and 0.25, 0.5, 1, 1.5, 2, 3, 4, 6, 8, 12, 24, 48, and 72 h postdose; those for 14C‐ertugliflozin were collected 5 min predose (prior to infusion start), at the end of infusion, at 10, 20, 30, and 45 min, and at 1, 1.5, 2, 3, 4, 6, 8, 11, 23, 47, and 71 h post end of infusion (end of i.v. infusion = 1 h post oral dose). To standardize the conditions on pharmacokinetic sampling days, all subjects were required to refrain from lying down, eating, and drinking beverages other than water during the first 4 h after dosing. Total urine output for determination of 14C concentration was collected over days 1–5 (0–96 h postadministration of unlabeled ertugliflozin) in periods 1 and 2.
Plasma samples for unlabeled ertugliflozin concentrations were analyzed by WuXi AppTec (Shanghai, China), following Pfizer standard operating procedures, using a validated, sensitive, and specific HPLC‐MS/MS with a lower limit of quantification (LLOQ) of 0.5 ng/mL. The linear regression curve range was 0.500–500 ng/mL using a weighting factor of 1/x2. The method validation overall intra‐run accuracy (% relative error) for quality control (QC) samples at concentrations of 1.25 (QC‐low), 12.5 (QC‐geometric mid), 250 (QC‐mid), and 400 (QC‐high) ng/mL was between ‐5.6% and −1.6%, and intra‐run precision (percent coefficient of variation (%CV)) was ≤3.3%. The overall inter‐run accuracy for QCs was between −5.2% and 0.0%, and intra‐run precision was ≤4.4%. Analysis of plasma samples for 14C‐ertugliflozin concentrations was performed by Xceleron (Germantown, MD), following Xceleron standard operating procedures, using a validated, sensitive, and specific HPLC‐AMS method. The LLOQ for 14C‐ertugliflozin in plasma was 0.182 dpm/mL (20.4 pg/mL). The linear regression curve range was 0.182–5.00 dmp/mL using a weighting factor of 1/x2. The method validation intra‐batch accuracy (% relative error) for low, mid, and high QCs ranged from 3.9% to 10.1%. The intra‐batch precision for low, mid, and high QCs was ≤7.78%. The inter‐batch accuracy for low, mid, and high QCs ranged from 5.6% to 6.0%. The inter‐batch precision was ≤5.01%. Urine sample analysis for total 14C measurement was performed by Xceleron in compliance with Xceleron standard operating procedures, using AMS. No sample extraction was needed and no method validation was conducted. Total 14C was measured in the predose sample and the value obtained was used for background subtraction. The LLOQ for each subject was defined as average background percent Modern Carbon (pMC) + 15% of each subject's predose pMC value. AMS results were expressed as pMC, where 100 pMC equals 13.56 dpm/g carbon‐12 (12C) or 0.01356 dpm/mg 12C. Thus, AMS measures the 14C/12C content of a sample derived from all sources of carbon in the sample. In each batch run, triplicates of QC‐low (0.118 dpm/mL) and QC‐high (1.28 dpm/mL) were analyzed. The overall accuracy (% relative error) of QC‐low and QC‐high in the three batches during sample analysis ranged from −13.6% to 13.6%.
Safety assessments
Safety assessments included assessment of adverse events (AEs), vital signs, electrocardiograms, and laboratory tests, which were conducted at screening and throughout the duration of study participation. Subjects received a follow‐up telephone call 14 ± 3 days after administration of the last dose of study drug to assess for AEs.
Data analysis
Pharmacokinetic parameters
Ertugliflozin plasma pharmacokinetic parameters following oral (unlabeled ertugliflozin) and i.v. (14C‐ertugliflozin) administration were calculated for each subject in period 1 using noncompartmental analysis of ertugliflozin plasma concentration‐time data as follows. Cmax and Tmax were observed directly from the data. Area under the concentration‐time curve to the time of the last quantifiable concentration (AUClast) was calculated using the linear‐log trapezoidal method. Terminal elimination half‐life was calculated as ln(2)/kel, where kel was the terminal phase rate constant calculated by a linear regression of the log‐linear concentration‐time curve. AUC extrapolated to infinity (AUCinf) was calculated as AUClast + Clast */kel, where Clast * was the predicted concentration at the last quantifiable time point based on the linear regression. Clearance after i.v. administration (CL) and apparent clearance after oral administration (CL/F) were calculated as dose/AUCinf. Steady‐state volume of distribution (Vss) for i.v. administration was calculated as (CL * MRT), where MRT was the mean residence time calculated as (AUMCinf/AUCinf) and AUMCinf was the area under the first moment curve calculated using the linear‐log trapezoidal method, extrapolated to infinity. Apparent volume of distribution (Vz/F) for oral administration was calculated as dose/(AUCinf*kel). Actual sample times (relative to the oral dose for unlabeled ertugliflozin, and relative to the start of the i.v. infusion for 14C‐ertugliflozin) were used for the oral and i.v. parameter calculations, respectively. The total amount of 14C radioactivity excreted in urine within 96 h of drug administration (14C_Total) was calculated for each subject in periods 1 and 2 as the sum of 14C radioactivity concentration × urine volume for each collection interval. Pharmacokinetic parameter values were calculated using a Pfizer‐validated software system, electronic noncompartmental analysis version 2.2.4.
Statistical analysis
The F was estimated as the ratio of adjusted least squares geometric means of AUCinf(dose‐normalized) for oral unlabeled ertugliflozin and i.v. 14C‐ertugliflozin. Natural log transformed AUCinf(dose‐normalized) was analyzed using a mixed‐effects model with treatment as a fixed effect and subject as a random effect. Estimates of the adjusted mean difference (Test (oral dose‐normalized unlabeled ertugliflozin)–Reference (i.v. dose‐normalized 14C‐ertugliflozin)) and the corresponding 90% confidence interval (CI) were obtained from the model and exponentiated to provide an estimate of the ratio of the adjusted geometric mean (Test/Reference) and 90% CI for the ratio. Fa was estimated as the ratio of geometric means of dose‐normalized total radioactivity (14C_Total/dose) excreted into the urine following oral (Test, period 2) and i.v. (Reference, period 1) administration of 14C‐ertugliflozin microtracer doses. An additional statistical analysis for the estimation of Fa was conducted due to a protocol deviation resulting in an inconsistency in urine collections for two subjects following the 14C‐ertugliflozin i.v. dose in period 1. Due to this inconsistency, these two subjects were excluded from the protocol‐specified analysis for Fa described above. The additional analysis for the calculation of Fa included all available data for total 14C recovered in urine (14C_Total, N = 8 for oral; N = 6 for i.v.), using a similar mixed‐effects model as that for F (treatment as a fixed effect and subject as a random effect). The actual administered 14C‐ertugliflozin dose for each subject was used for dose normalization in pharmacokinetic parameter calculations and the analyses for F and Fa.
RESULTS
Subject baseline characteristics
Eight healthy adult male subjects were enrolled; all completed the study. All were white, aged between 25 and 54 years (mean (SD): 41.0 (11.5) years) and weighed between 66.6 and 95.1 kg (mean (SD): 77.8 (10.1) kg). Mean (SD) body mass index was 25.1 (3.4) kg/m2 with a range of 20.3–29.7 kg/m2.
Doses of 14C‐ertugliflozin administered
The 14C‐ertugliflozin dosing solution concentration was assayed and determined to be 9.5 μg/mL and 9.7 μg/mL for periods 1 (i.v.) and 2 (oral), respectively. Specific activity (SA) of the 14C‐ertugliflozin dosing solution was 3.9 μCi/mg for period 1 and 3.5 μCi/mg for period 2. The 10% difference in measured SA between the two periods was deemed to be within the variability of the analytical measurements for the calculation of SA. The 14C‐ertugliflozin administered doses were expressed as total radioactivity (both dpm and nCi) and the equivalent ertugliflozin mass units (μg). The administered radioactivity doses ranged from 366 to 369 nCi in period 1 (i.v.) and 328 to 344 nCi in period 2 (oral). Expressed as mass units, all individual doses were within the following ranges: i.v., 94.8–95.5 μg; and oral, 94.0–95.9 μg.
Pharmacokinetics
Median plasma concentration‐time profiles for oral (unlabeled; 15 mg) and i.v. (14C‐labeled; 100 μg) ertugliflozin are presented in Figure 2, and a summary of plasma pharmacokinetic parameter values is shown in Table 1. Ertugliflozin was rapidly absorbed following oral administration, with a median Tmax of 1 h (range, 1–1.5 h) for unlabeled ertugliflozin. Maximum concentrations of 14C‐ertugliflozin were also observed at 1 h after the oral dose and at the end of the 5‐min i.v. infusion (median Tmax: 0.083 h). Unlabeled ertugliflozin, administered orally, was quantifiable in plasma for 72 h postdose, using HPLC‐MS/MS (LLOQ = 0.5 ng/mL), whereas 14C‐ertugliflozin, administered as an i.v. microdose, was quantifiable for ∼24 h postdose using HPLC‐AMS (LLOQ = 20.4 pg/mL). CL/F and CL were similar, with geometric mean values of 178.7 mL/min and 187.2 mL/min, respectively. The Vz/F of ertugliflozin following oral administration was 215.3 L vs. 85.5 L for the Vss following i.v. administration. Mean ertugliflozin t1/2 was shorter following i.v. administration compared with oral administration (8.1 h and 14 h, respectively). Total variability in total ertugliflozin exposure (CV) was low (13% for oral and 15% for i.v.).
Figure 2.
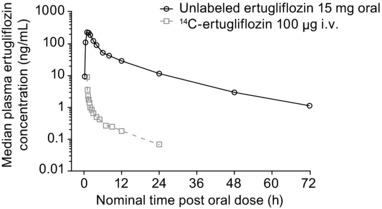
Median plasma concentration‐time profiles for oral (unlabeled; 15 mg) and i.v. (14C‐labeled; 100 μg) ertugliflozin.
Table 1.
Descriptive summary of plasma pharmacokinetic parameter values following administration of oral unlabeled ertugliflozin (15 mg) and i.v. 14C‐ ertugliflozin (100 μg)
| Parameter summary statisticsa by analyte | ||
|---|---|---|
| Unlabeled ertugliflozin (oral) N = 8 | 14C‐ertugliflozin (i.v.) N = 8 | |
| AUCinf, ng·h/mL | 1397 (13) | 8.477 (15) |
| AUCinf(dn), ng·h/mL/mg | 93.16 (13) | 88.96b (15) |
| AUClast, ng·h/mL | 1376 (12) | 7.859 (14) |
| Cmax, ng/mL | 256.3 (14) | 8.514 (32) |
| Cmax(dn), ng/mL/mg | 17.09 (14) | 89.34b (32) |
| Tmax, h | 1.00 (1.00–1.50) | 0.083 (0.083–0.100) |
| t1/2, h | 14.04 ± 2.17 | 8.098 ± 2.248 |
| CL/F, mL/min – oral | 178.7 (13) | NA |
| CL, mL/min – i.v. | NA | 187.2 (15) |
| Vz/F, L – oral | 215.3 (21) | NA |
| Vss, L – i.v. | NA | 85.53 (15) |
AUCinf, area under the plasma concentration‐time curve extrapolated to infinity; AUClast, area under the concentration‐time curve to the time of the last quantifiable concentration; CL, apparent clearance following i.v. dosing; CL/F, apparent clearance following oral dosing; Cmax, maximum concentration; dn, dose‐normalized to 1 mg; NA, not applicable; Tmax, time to maximum concentration; t1/2, terminal elimination half‐life; Vss, steady‐state volume of distribution; Vz/F, apparent volume of distribution.
Geometric mean (geometric percent coefficient of variation) for all except median (range) for Tmax and arithmetic mean ± SD for t1/2.
Actual 14C‐ertugliflozin doses were 94.8–95.5 μg (i.v.), 94.0–95.9 μg (oral).
Individual and geometric mean AUCinf(dose‐normalized) values for oral and i.v. administrations were similar, as illustrated in Figure 3. Ertugliflozin F, calculated as a geometric mean ratio, was estimated to be 105% (90% CI = 102%–108%; Table 2). Individual F values ranged from 97% to 111% for 8 subjects.
Figure 3.
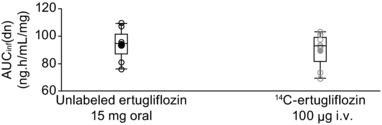
Individual and geometric mean dose‐normalized area under the plasma concentration‐time curve extrapolated to infinity (AUCinf(dn)) values for unlabeled ertugliflozin and 14C‐ertugliflozin. Circles represent individual values and dots represent geometric means. Box plot provides median and 25%/75% quartiles with whiskers to the last point within 1.5 × interquartile range.
Table 2.
Statistical analysis for ertugliflozin absolute oral bioavailability and fraction absorbed
| Absolute bioavailability (F) | ||||
|---|---|---|---|---|
| Adjusted least squares geometric means | ||||
| Unlabeled ertugliflozin, 15 mg oral (Test) | 14C‐ertugliflozin, 100 μg i.v. (Reference) | F: Ratio (Test/Reference) of adjusted means (%) | 90% CI for ratio | |
| No. of subjects | 8 | 8 | ||
| AUCinf(dn) ng·h/mL/mg | 93.16 | 88.96 | 104.73 | 101.64, 107.91 |
| Fraction absorbed (Fa) | ||||
|---|---|---|---|---|
| Geometric means | ||||
| Unlabeled ertugliflozin, 15 mg oral (Test) | 14C‐ertugliflozin, 100 μg i.v. (Reference) | Fa: ratio a (Test/Reference) of geometric means (%) | ||
| No. of subjects | 6 | 6 | ||
| 14C_Total(dn) | 0.432 | 0.390 | 110.71 | |
AUCinf(dn), area under the time curve 0 to infinite dose‐normalized to 1 mg; CI, confidence interval; 14C_Total(dn), 14C_Total in dpm/radioactivity dose in dpm.
Complete data available for only six subjects; data not available for two subjects due to cross‐contamination of the 11–23 h urine collection for i.v. treatment.
Note: Using the mixed‐effects model analysis with treatment as a fixed effect and subject as a random effect, geometric mean ratio (90% CI) for Fa was calculated to be 109.9 (102.6, 117.7).
14C‐Total urinary excretion, expressed in dpm, was similar following i.v. (period 1, N = 6) and oral (period 2, N = 8) administration of 100 μg 14C‐ertugliflozin (i.v.: mean (%CV) = 319,000 (19) dpm; oral: mean (%CV) = 320,400 (10) dpm). Thus, although urine samples were collected for an hour longer after oral 14C ertugliflozin administration relative to i.v. 14C administration, this did not have any relevant impact on the amount of radioactivity recovered in urine after oral and i.v. dosing. Total 14C in urine, expressed as a percent of administered dose (% 14C_Total), was 39% and 44% following i.v. and oral administration, respectively. Ertugliflozin Fa (using only data from the six subjects with complete urine data for both treatments; see Methods) was estimated to be 111% (Table 2); the estimate for Fa using all available data and the mixed effects model was similar, at 110%. Individual Fa values ranged from 0.99 to 1.26 for six subjects. For all subjects, urine predose 14C levels in both periods were below the LLOQ.
Safety
Ertugliflozin was well tolerated following both i.v. and oral administration. No vital signs, electrocardiogram measurements, or laboratory measurements met the criteria for potential clinical concern. Three subjects experienced three AEs (back pain and two episodes of headache) during period 1 (i.v. administration) and one subject experienced one AE (nasal congestion) during period 2 (oral administration). Of the four AEs, three were mild in severity and one (nontreatment‐related headache) was moderate in severity.
DISCUSSION
The microtracer approach with simultaneous administration of oral and i.v. 14C‐labeled ertugliflozin successfully enabled determination of F for ertugliflozin. Although a single‐period study design is sufficient for the determination of F using this methodology, the addition of a second period enabled estimation of ertugliflozin Fa within the same study. The use of the microtracer technique for estimation of F has previously been reported by Boulton et al.7 and Sarapa et al.9; however, the estimation of both F and Fa in a single study is a novel approach and, to our knowledge, has not been reported in the literature to date.
Following oral administration of ertugliflozin under fasted conditions, estimations of F and Fa were 105% and 111%, respectively. As these estimations were >100%, study procedures were reviewed for potential sources of bias resulting from dosing, sample collection and handling, and sample and data analysis; however, no errors were found, and estimations of both F and Fa were deemed to be within normal experimental and analytical variability.
For ertugliflozin F, a shorter t1/2 for i.v. ertugliflozin and a small underestimation of AUCinf following i.v. administration are probable explanations for the estimated value being slightly greater than 100%. The shorter mean t1/2 seen after i.v. administration compared with that after oral administration was likely due to the inability to quantify ertugliflozin concentrations following the i.v. microdose for the same duration of time (up to 24 h) as that following the oral dose (up to 72 h), despite the much higher sensitivity (lower LLOQ) of the HPLC‐AMS method. Despite the fact that AMS is a highly sensitive analytical tool, it is important to be mindful of the possibility that microdose i.v. administration of a drug might not allow for adequate quantification of drug concentrations over the entire concentration‐time profile, in which case, appropriate calculation checks need to be made to assess the impact of this on the overall estimation of F.
For Fa, no sources of error were found with urine collections, radioactivity dose calculations, or 14C analysis. Total urinary 14C excretion (recovery) was similar following both oral (320,400 dpm) and i.v. (319,000 dpm) administration of 14C‐ertugliflozin. Therefore, an ertugliflozin Fa value of >100%, estimated as the oral i.v. ratio of total urinary 14C excretion in dpm corrected for dose and expressed as a percentage, is likely attributable to experimental variability reported for the measurement of radioactive doses administered (as described previously in “Doses of 14C‐ertugliflozin Administered” section). The Fa calculation highlights the importance of dose radioactivity measurements from period 1 and period 2 dosing solutions.
Consistent with the results for F, ertugliflozin oral clearance was similar to systemic clearance following i.v. administration. The apparent volume of distribution following oral administration (Vz/F) of ertugliflozin was higher than that following i.v. administration (Vss). The observed difference between Vz and Vss might be attributable to the biexponential disposition of ertugliflozin, wherein a larger volume (Vz) could be needed to accommodate the amount of drug in the body to generate initial plasma concentrations, but after equilibrium is achieved and some of the drug is excreted, a smaller volume is needed to generate equilibrium concentrations (Vss).17, 18, 19 Additionally, determination of Vss (as CL * MRT, where MRT is the mean residence time calculated as (AUMCinf/AUCinf)) involves the estimation of two area terms. The underestimation in the extrapolated area (to infinite time) for both AUCinf and AUMCinf due to the nonquantifiable concentrations after 24 h post i.v. dosing may have also contributed to the smaller Vss relative to Vz/F after oral dosing. In general, ertugliflozin exposures and pharmacokinetic parameters after administration of a 15‐mg oral single dose in this study were consistent with those observed in other studies in healthy subjects (data on file).20
In summary, ertugliflozin F and Fa were estimated to be ∼100%, demonstrating that ertugliflozin is completely absorbed following oral administration. Based on these results, ertugliflozin is considered to be a highly permeable compound.
Conflict of Interest
S.R., E.C., V.S., A.V., H.S., K.S., K.M., D.P., R.F., D.S., and S.G.T. are employees of Pfizer. C.A. and E.F. were employees of Pfizer at the time of study conduct. E.J.W. and S.Z. are employees of Merck & Co., Inc., Kenilworth, NJ, USA. D.L.C. was an employee of Merck & Co., Inc., Kenilworth, NJ, USA, at the time of study conduct. D.G. is an employee of Quotient Clinical. L.S. was an employee of Quotient Clinical at the time of the study conduct. Quotient Clinical was a paid contractor for Pfizer for the conduct of this study.
Acknowledgments
The authors thank Lata Maganti, PhD, of Merck & Co., Inc., Kenilworth, NJ, USA, for reviewing the statistical analysis results.
Source of Funding
This study was sponsored by Pfizer Inc., Groton, CT, USA and Merck & Co., Inc., Kenilworth, NJ, USA. Editorial support was provided by Helen Jones, PhD, of Engage Scientific Solutions (Horsham, UK) and was funded by Pfizer Inc. and Merck & Co., Inc.
Author Contributions
S.R., E.C., V.S., A.V., H.S., E.F., E.J.W., K.S., K.M., C.A., S.Z., D.P., R.F., D.S., S.G.T., L.S., D.G., and D.L.C. wrote the manuscript. S.R., E.C., V.S., A.V., H.S., E.F., E.J.W., K.S., K.M., C.A., S.Z., D.P., R.F., D.S., S.G.T., L.S., D.G., and D.L.C. designed the research. L.S., D.G., and D.S. performed the research. S.R., E.C., V.S., A.V., H.S., E.F., E.J.W., K.S., K.M., C.A., S.Z., L.S., and D.L.C. analyzed the data.
References
- 1. Kalgutkar, A.S. et al Preclinical species and human disposition of PF‐04971729, a selective inhibitor of the sodium‐dependent glucose cotransporter 2 and clinical candidate for the treatment of type 2 diabetes mellitus. Drug Metab. Dispos. 39, 1609–1619 (2011). [DOI] [PubMed] [Google Scholar]
- 2. Miao, Z. et al Pharmacokinetics, metabolism, and excretion of the antidiabetic agent ertugliflozin (PF‐04971729) in healthy male subjects. Drug Metab. Dispos. 41, 445–456 (2013). [DOI] [PubMed] [Google Scholar]
- 3. Terra, S.G. et al Phase III, efficacy and safety study of ertugliflozin monotherapy in people with type 2 diabetes mellitus inadequately controlled with diet and exercise alone. Diabetes Obes. Metab. 19, 721–728 (2017). [DOI] [PubMed] [Google Scholar]
- 4. Pratley, R.E. et al Ertugliflozin plus sitagliptin versus either individual agent over 52 weeks in patients with type 2 diabetes mellitus inadequately controlled with metformin: the VERTIS FACTORIAL randomized trial. Diabetes Obes. Metab. https://doi.org/10.1111/dom.13194 [Epub ahead of print] (2018). [DOI] [PMC free article] [PubMed] [Google Scholar]
- 5. Dagogo‐Jack, S. et al Efficacy and safety of the addition of ertugliflozin in patients with type 2 diabetes mellitus inadequately controlled with metformin and sitagliptin: the VERTIS SITA2 placebo-controlled randomized study. Diabetes Obes. Metab. 20, 530–540 (2018). [DOI] [PMC free article] [PubMed] [Google Scholar]
- 6. Food and Drug Administration . Guidance for Industry: Drug interaction studies — study design, data analysis, implications for dosing, and labeling recommendations. http://www.fda.gov/downloads/drugs/guidancecomplianceregulatoryinformation/guidances/ucm292362.pdf (2012).
- 7. Boulton, D.W. et al Simultaneous oral therapeutic and intravenous 14C‐microdoses to determine the absolute oral bioavailability of saxagliptin and dapagliflozin. Br. J. Pharmacol. 75, 763–768 (2013). [DOI] [PMC free article] [PubMed] [Google Scholar]
- 8. International Conference on Harmonisation . ICH Topic M 3 (R2). Non‐clinical safety studies for the conduct of human clinical trials and marketing authorization for pharmaceuticals. International Conference on Harmonisation of Technical Requirements for Registration of Pharmaceuticals for Human Use (2009).
- 9. Sarapa, N. , Hsyu, P.H. , Lappin, G. & Garner R.C. The application of accelerator mass spectrometry to absolute bioavailability studies in humans: simultaneous administration of an intravenous microdose of 14C‐nelfinavir mesylate solution and oral nelfinavir to healthy volunteers. J. Clin. Pharmacol. 45, 1198–1205 (2005). [DOI] [PubMed] [Google Scholar]
- 10. Lappin, G. et al Use of microdosing to predict pharmacokinetics at the therapeutic dose: experience with 5 drugs. Clin. Pharmacol. Ther. 80, 203–215 (2006). [DOI] [PubMed] [Google Scholar]
- 11. Lappin, G. et al Pharmacokinetics of fexofenadine: evaluation of a microdose and assessment of absolute oral bioavailability. Eur. J. Pharm. Sci. 40, 125–131 (2010). [DOI] [PubMed] [Google Scholar]
- 12. Smith, D.A. The debate is over: accelerator MS provides the route to better drug‐development paradigms/protocols. Bioanalysis 3, 391–392 (2011). [DOI] [PubMed] [Google Scholar]
- 13. Food and Drug Administration . Guidance for Industry. Waiver of in vivo bioavailability and bioequivalence studies for immediate‐release solid oral dosage forms based on a biopharmaceutics classification system. https://www.fda.gov/downloads/Drugs/GuidanceComplianceRegulatoryInformation/Guidances/UCM070246.pdf (2017).
- 14. Yang, J. , Jamei, M. , Yeo, K.R. , Tucker, G.T. & Rostami‐Hodjegan, A . Prediction of intestinal first‐pass drug metabolism. Curr. Drug Metab. 8, 676–684 (2007). [DOI] [PubMed] [Google Scholar]
- 15. Yu, L.X. & Amidon, G.L. A compartmental absorption and transit model for estimating oral drug absorption. Int. J. Pharm. 186, 119–125 (1999). [DOI] [PubMed] [Google Scholar]
- 16. Levey, A.S. et al Using standardized serum creatinine values in the modification of diet in renal disease study equation for estimating glomerular filtration rate. Ann. Intern. Med. 145, 247–254 (2006). [DOI] [PubMed] [Google Scholar]
- 17. Evans, W.E. , Schentag, J.J. & Jusko, W.J. Guidelines for collection and analysis of pharmacokinetic data. Applied Pharmacokinetics. 3rd edn (Applied Therapeutics Inc., Spokane, WA, 1992). [Google Scholar]
- 18. Gibaldi, M. & Perrier, D. Pharmacokinetics. 2nd edn (Marcel Dekker, Inc., New York, NY, 1982). [Google Scholar]
- 19. Gobburu, J.V. & Holford, N.H. Vz , the terminal phase volume: time for its terminal phase? J. Biopharm. Stat. 11, 373–375 (2001). [PubMed] [Google Scholar]
- 20. Sahasrabudhe V., et al The effect of renal impairment on the pharmacokinetics and pharmacodynamics of ertugliflozin in subjects with type 2 diabetes mellitus. J. Clin. Pharmacol. 57, 1432–1443 (2017). [DOI] [PMC free article] [PubMed] [Google Scholar]