

Abstract
Sorafenib administered at the approved dose continuously is not tolerated long‐term in patients with acute myeloid leukemia (AML). The purpose of this study was to optimize the dosing regimen by characterizing the sorafenib exposure‐response relationship in patients with AML. A one‐compartment model with a transit absorption compartment and enterohepatic recirculation described the exposure. The relationship between sorafenib exposure and target modulation of kinase targets (FMS‐like tyrosine kinase 3 (FLT3)‐ITD and extracellular signal‐regulated kinase (ERK)) were described by an inhibitory maximum effect (Emax) model. Sorafenib could inhibit FLT3‐ITD activity by 100% with an IC50 of 69.3 ng/mL and ERK activity by 84% with an IC50 of 85.7 ng/mL (both adjusted for metabolite potency). Different dosing regimens utilizing 200 or 400 mg at varying frequencies were simulated based on the exposure‐response relationship. Simulations demonstrate that a 200 mg twice daily (b.i.d.) dosing regimen showed similar FLT3‐ITD and ERK inhibitory activity compared with 400 mg b.i.d. and is recommended in further clinical trials in patients with AML.
Study Highlights
WHAT IS THE CURRENT KNOWLEDGE ON THE TOPIC?
✓ The approved sorafenib dosing regimen of 400 mg b.i.d. in solid tumors is not well tolerated in patients with AML.
WHAT QUESTION DID THIS STUDY ADDRESS?
✓ We simulated different dosing regimens to evaluate the pharmacologic response in patients with AML.
WHAT DOES THIS STUDY ADD TO OUR KNOWLEDGE?
✓ The population PK/PD model describes the concentration‐time profile of sorafenib and the corresponding responses of FLT3 and ERK activities.
HOW THIS MIGHT CHANGE DRUG CLINICAL PHARMACOLOGY OR TRANSLATIONAL SCIENCE?
✓ This research enables us to evaluate and propose a lower dosing regimen of 200 mg b.i.d. without loss of pharmacological activities for the purpose of minimizing toxicities. This 200 mg b.i.d. dosing regimen is currently being evaluated in patients with AML in a subsequent clinical trial.
Acute myeloid leukemia (AML) remains a challenging subtype of leukemia with a 5‐year age‐adjusted relative survival rate for patients in 2007–2011 being only 18.8% in the United States and 19% in Europe.1, 2 The National Comprehensive Cancer Network guidelines recommend molecular characterization of several commonly mutated genes to allow for risk‐stratification and subsequent treatment paradigms.3, 4 Small molecule drugs are now emerging as an option for patients with AML to address the unmet clinical need, in addition to intensive chemotherapy regimens (e.g., cytarabine and daunomycin) and bone marrow transplantation. The FMS‐like tyrosine kinase 3 (FLT3) gene is mutated in a substantial proportion of AMLs and, as such, has been recognized as a potential target for the treatment of AML.5 FLT3 exerts its impact on the proliferation, differentiation, and death of hematopoietic cells through RAS pathway activation.6 FLT3 activating mutations are commonly present as internal tandem duplication (ITD) mutations (FLT3‐ITD) or point mutations in the second tyrosine kinase domain (FLT3‐TKD) in ∼25–30% or 5–10% of patients, respectively.5, 7 Currently, several FLT3 inhibitors are being investigated in patients with AML.8, 9 In 2017, the US Food and Drug Administration (FDA) approved the pan‐kinase/FLT3 inhibitor, midostaurin in patients with FLT3‐ITD and TKD‐positive AML based on prolongation of both event‐free and overall survival in the subgroup receiving midostaurin in combination with standard induction chemotherapy.10
Sorafenib is a multikinase inhibitor that is approved by the FDA for the treatment of hepatocellular carcinoma, renal cell carcinoma, and thyroid carcinoma at a dose of 400 mg orally twice a day (b.i.d.) without food. Moreover, sorafenib has been shown as a potent inhibitor of FLT3‐ITD but resistance emerges as FLT3‐TKD point mutations.9 Although sorafenib has not been approved by the FDA for the treatment of AML, off‐label use of sorafenib was reported in patients with AML.11 Numerous phase I and phase II clinical trials have been conducted to evaluate sorafenib safety and efficacy as monotherapy or in combination with traditional antileukemic chemotherapy in newly diagnosed and refractory or relapsed adult AML as well as in pediatric AML.9, 12, 13, 14, 15, 16 Overall survival benefits for the incorporation of sorafenib into combinational therapies have yet to be demonstrated, possibly due to mixed FLT3 mutations status and to a sorafenib dosing regimen that has not been optimized to balance tolerability with the achievement of 85% FLT3 inhibition, which is a predictor for clinical response.8, 17, 18 All randomized studies to date have evaluated the use of sorafenib with chemotherapy in an unselected AML population with or without FLT3 mutations at the full maximum tolerate dose (MTD) dose of 400 mg b.i.d. either continuously or intermittently. However, this approved dose has not been well tolerated in several AML clinical trials.9, 19 Only a small proportion of patients (18%) with AML were able to adhere to the continuous 400 mg b.i.d. dosing in comparison with lower dosing regimens (50% vs. 83%).20
There is large interindividual variability in systemic exposure to sorafenib.21, 22 Saturable absorption has been noted to occur at doses over 400 mg.23 Steady‐state is achieved by 7 days.22 Sorafenib is highly protein bound with an unbound fraction of 0.3% and a higher affinity to albumin than alpha 1‐acid glycoprotein.24 Sorafenib is primarily metabolized by cytochrome P450 (CYP)3A4 and UDP‐glucuronosyltransferase (UGT) 1A9 with the primary metabolite being sorafenib N‐oxide.25 Sorafenib N‐oxide has been noted to be 14.59‐fold more potent than the parent drug when assessing FLT3‐ITD potency.9 Sorafenib undergoes enterohepatic recirculation as an important disposition pathway with sorafenib hepatocellular uptake facilitated by organic anion‐transporting polypeptide (OATP) transporters and efflux to bile facilitated by ABC transporters after being metabolized to its glucuronide metabolite.26, 27, 28 The pharmacokinetics (PK) with enterohepatic recirculation have been quantified in humans using population PK21 and in mice using physiologically based PK modeling.29
In traditional oncology drug development, MTD has been based on the highest tolerable dose with the presumptive goal of maximizing drug exposure and, therefore, optimizing clinical efficacy. However, tolerability is essential for adherence to therapy especially if long‐term administration is anticipated. Recently, dosing selection based on exposure‐response relationship considering both efficacy and tolerability has drawn attention by both regulatory agency and industry in oncology drug development.30, 31 The purpose of this research was to select the sorafenib dosing regimen in patients with AML for further clinical trials by characterizing the exposure‐response relationship for inhibition of FLT3 by sorafenib and its active N‐oxide metabolite in patients with AML.
METHODS
Clinical study design and correlative studies
A phase I dose escalation study was conducted in 15 adult patients with relapsed and refractory AML after an intermittent dosing regimen given cyclically to evaluate the safety, tolerability in preliminary fashion, and efficacy of sorafenib in patients with AML (ClinicalTrials.gov Identifier: NCT00131989).9 Protocol and the consent form were approved by the Johns Hopkins School of Medicine Institutional Review Board. All patients gave informed consent according to the Declaration of Helsinki.
Detailed information on clinical trial design, outcome, and bioassay methods can be found in the clinical trial manuscript.9
Briefly, sorafenib was administered at a dose of 400 mg or 600 mg b.i.d. for 14 or 21 days in a 28‐day cycle. Three patients received 400 mg b.i.d. oral administration for 14 days, 9 patients received 400 mg b.i.d. for 21 days, and 3 patients received 600 mg b.i.d. for 14 days.
Serial blood samples for PKs were collected before and at 0.25, 0.5, 1, 2, 4, 6, and 8 hours after the administration of the first dose of sorafenib. Additional blood samples were collected before administration trough plasma concentration (Cmin) on days 2, 3, 8, and 15 of continuous dosing and before the start of cycle 2. Serial blood samples for FLT3 and extracellular signal‐regulated kinase (ERK) activity were collected at baseline and before administration on days 8 and 15 of continuous dosing and before the start of cycle 2. The total and unbound plasma concentration of sorafenib and the total plasma concentration of the sorafenib N‐oxide metabolite were measured using a liquid chromatography with tandem mass spectrometry method.24, 32 FLT3 and its downstream factor ERK ex vivo activities in TF‐1 cells expressing FLT3‐ITD were measured using Western blot, as previously described.33 FLT3 and ERK activity were reported as the percent change from baseline for each individual, with the individual baseline activity set at 100% for each patient.
EXPOSURE‐RESPONSE MODEL
Population PK model of sorafenib and its N‐oxide metabolite
A previously published population PK model of sorafenib in patients with solid tumors was adopted to develop the structural model of sorafenib in patients with AML as shown in Figure 1.21 The enterohepatic recirculation was controlled by a time‐dependent binary variable EHYN (enterohepatic as “yes or no”) that switches on the enterohepatic recirculation at a given time point after dose (TENT).
Figure 1.

Structural pharmacokinetics model of sorafenib and its N‐oxide metabolite using transit compartment and enterohepatic recirculation. Ka is the absorption rate constant, CL is the total clearance, is the fraction of sorafenib that go through enterohepatic circulation; CLm is the clearance of the N‐oxide metabolite. Sorafenib was absorbed from the dosing compartment (Aa) to the transit compartments (A1 to A3), then to the central compartment (A5). EHYN controlled the on and off status for sorafenib to go from the gallbladder (A6) back to the gastrointestinal track (A4) by a time controller TENT; K64 is the release rate constant from gallbladder back to the gastrointestinal track; V and V7 are the apparent volume of distribution for compartment A5 and A7, respectively.
Unbound plasma concentrations of sorafenib (Cu) were modeled simultaneously with total plasma concentration (Cp) using an unbound fraction parameter ().
A one‐compartment model for the N‐oxide metabolite was added onto the parent drug model, as shown in Figure 1. The volume of distribution of the N‐oxide metabolite (V7) was estimated, whereas the metabolism fraction for the N‐oxide metabolite was assumed to be 1 ‐ fENT (fraction of drug from the central compartment that was hepatobiliary excreted into a gall bladder compartment).
Although body weight was only added to the central volume of distribution of sorafenib due to statistical significance in patients with solid tumors,21 body weight centered at 80 kg was included on all the volumes of distribution parameters (V, V7) with an exponent of 1, and clearance parameters (CL and CLm) with an exponent of 0.75 following the allometric scaling approach.
where is the typical value () of sorafenib apparent clearance in a patient weighing 80 kg, is the typical value of sorafenib N‐oxide metabolite apparent clearance in a patient weighing 80 kg, is the typical value of sorafenib apparent volume of distribution in a patient weighing 80 kg, and is the typical value of sorafenib N‐oxide metabolite apparent volume of distribution in a patient weighing 80 kg, , , V, and V 7 are the individual parameters based on the corresponding body weight (WT).
Between‐subject variability (BSV) was modeled assuming a log‐normal distribution:
where, is the individual PK parameter for patient i, is the population value of that PK parameter, and is the corresponding BSV for patient i, which is assumed to follow a normal distribution with mean 0 and variance of . BSV was estimated from the data in this study.
Within‐subject variability (WSV) was modeled using a proportional residual error model for total and unbound plasma sorafenib concentrations as follows:
where Observed Sorafenib Total/Unbound Concentrationi,j, , and are the observed and individual concentration for patient i at time j, respectively, is the corresponding proportional error term for patient i at time j, which is assumed to follow a normal distribution with mean 0 and variance of σ2. Due to the high consistency between sorafenib total and unbound concentration, the same WSV was used for both of them.
WSV was modeled using a mixed residual error model for the total plasma concentration of the N‐oxide metabolite as follows:
where Observed N‐oxide Metabolite Concentrationi,j and are the observed and individual predicted concentrations for patient i at time j, respectively, is the corresponding proportional error term for patient i at time j, which is assumed to follow a normal distribution with mean 0 and variance of , and is the corresponding additive error term for patient i at time j, which is assumed to follow a normal distribution with mean 0 and variance of .
Covariate analysis was performed to assess the relationship between covariates of interest and the structural PK parameters. After body weight was included as a structural covariate on all clearance and volume parameters, clinically relevant covariates, including demographics (age and gender), concomitant medication (e.g., presence or absence of strong CYP3A4 inducers and inhibitors), and baseline disease status (asymptomatic and symptomatic) were explored as potential covariates. The likelihood ratio test was used to determine the statistical significance at P < 0.05.
The area under the curve (AUC) ratio of sorafenib and its N‐oxide metabolite (AUCm) was used to assess the change in the formation of the N‐oxide metabolite based on the formation clearance and elimination clearance of the N‐oxide, where .
Assessment of exposure‐response relationship
In an in vitro study, the N‐oxide metabolite showed 14.59‐fold higher potency on FLT3 inhibition than the parent compound sorafenib.9 Therefore, the total plasma concentration of sorafenib () and the N‐oxide metabolite () were transferred to the adjusted sorafenib concentration () using their corresponding molecular weight (MW) of 464.825 for sorafenib and 480.825 for the N‐oxide metabolite, and then the was used to build up the exposure‐response relationship.
The reported FLT3 and ERK activity were available as the percent change from baseline for each individual separately. Therefore, an inhibitory maximum effect (Emax) model was chosen to describe the relative change from baseline, in which the baseline level for each individual was selected to be at 100% of FLT3 or ERK activity. The maximum inhibitory effect () for FLT3 was fixed to 100%, and the for ERK activity was estimated.
The WSV was modeled using a proportional residual error model for FLT3 and ERK separately:
where and are the proportional residual error terms and assumed to follow a normal distribution with mean 0 and variance of and , respectively.
Model evaluation
Model evaluation was based on various goodness‐of‐fit indicators, including comparisons based on the objective function value, visual inspection of diagnostic scatter plots, and evaluation of estimates of population fixed and random effect parameters.
Normalized prediction distribution errors (NPDEs) were generated using 200 replicates of simulation for each observation in the original data set using the final PK/pharmacodynamic (PD) model.34 The NPDE were plotted against time after dose (TAD) and population prediction (PRED) to identify trends for model misspecification.
Simulation and dosing recommendation
The PD profiles at doses lower than 400 mg b.i.d. were simulated in order to address the previously mentioned issue of tolerability in patients with AML. The 200 mg strength of sorafenib is the only available strength on the market. Therefore, 200 mg every other day (q.o.d.), 200 mg once daily (q.d.), 200 mg b.i.d, and 400 mg q.d. dosing regimens were simulated in comparison with 400 mg b.i.d. dosing. The simulation results were used to support a practical dosing regimen in a clinical trial to evaluate the safety, tolerability, and clinical outcome of sorafenib administered to patients with FLT3‐ITD‐positive AML pre‐allogeneic and postallogeneic transplant (ClinicalTrials.gov Identifier: NCT01578109).35
Concentration‐time profile of sorafenib, its N‐oxide metabolite, and the percentage of activity for FLT3 and ERK after sorafenib administration were simulated utilizing the five aforementioned dosing regimens in 1,000 patients. The simulated body weight ranges from 50–80 kg following a uniform distribution. For each dosing scenario and each patient, the concentrations of sorafenib and its N‐oxide metabolite and the FLT3 and ERK activities were simulated every 1 hour up to 120 hours. After the simulation, the proportion of subjects at each dose level that consistently achieved 50%, 60%, 70%, 80%, or 90% inhibition of FLT3 and ERK during the entire dosing interval at steady state were calculated to construct a probability of target attainment curve, in which the targets were the different inhibition levels.
All modeling and simulation calculations were performed using Phoenix NLME version 7 (Certara, St. Louis, MO). The first order conditional estimation method with interaction (FOCE‐I) was utilized in the population PK modeling process. The PK model of sorafenib and its N‐oxide metabolite was linked to a PD model of FLT3 and ERK following a sequential PK/PD modeling approach.28, 29
RESULTS
Patient characteristics
Fifteen patients with relapsed or refractory AML from the previously conducted phase I dose escalation study were included. The patients’ demographics and baseline characteristics are summarized in Table 1. One hundred forty‐one total sorafenib plasma concentrations, 136 unbound sorafenib concentrations, and 100 total N‐oxide concentrations were obtained from all 15 patients. All the concentration data were used in the population PK analysis of sorafenib and its N‐oxide metabolite. Thirty‐five FLT3‐ITD activities and 36 ERK activities were measured in 11 patients. Only 8 patients were receiving voriconazole, a strong CYP3A4 inhibitor, as therapy for fungal pneumonia. Patients did not receive other strong inducers or inhibitors of CYP3A4 concomitantly.
Table 1.
Demographics and baseline characteristics (n = 15)
| Variables | |
|---|---|
| Age, years | |
| Median (range) | 58 (37–74) |
| Mean (SD) | 58.4 (11.3) |
| BSA, m2 | |
| Median (range) | 1.85 (1.56–2.26) |
| Mean (SD) | 1.88 (0.224) |
| BMI | |
| Median (range) | 26.5 (18.5–36.3) |
| Mean (SD) | 26.7 (4.88) |
| Weight, kg | |
| Median (range) | 74.6 (52.2–97.7) |
| Mean (SD) | 75.9 (15.3) |
| Baseline performance status | |
| Asymptomatic:symptomatic | 8:7 |
| Gender | |
| Male:female | 8:7 |
| Voriconazole | |
| Yes:no | 8:7 |
BMI, body mass index; BSA, body surface area.
EXPOSURE RESPONSE MODEL
Population PK model of sorafenib and its N‐oxide metabolite
A one‐compartment model with transit absorption model and enterohepatic recirculation (Figure 1) that was adopted from the solid tumor patient study successfully described the PK profile of sorafenib in patients with AML.21 The PK profile of sorafenib in patients with AML was similar to that for patients with solid tumors.
The fu of sorafenib was utilized to describe the relationship between total and unbound plasma concentrations and suggested that the plasma protein binding was concentration independent within the observed concentration range, as previously demonstrated.24 Due to the high consistency between unbound and total plasma concentration of sorafenib, their WSV cannot be distinguished and, therefore, was modeled using the same proportional residual error model.
Based on the covariate analysis, voriconazole was the only covariate that showed a clear impact on the formation of the N‐oxide metabolite. As shown in Figure 2, about 68.3% less of the N‐oxide metabolite was formed after co‐administration of voriconazole. However, voriconazole was not included in the final PK model for diverse reasons, including small sample size, instability in model estimation, and known lack of impact of other strong CYP3A4 inhibitors on sorafenib exposure.25 None of the other tested covariates, gender and age, were incorporated in the final model.
Figure 2.

Normalized prediction distribution errors. Top panel (left to right) represents sorafenib total concentration, sorafenib unbound concentration, and total N‐oxide metabolite concentration vs. time after dose, and the bottom panel, in the same order, vs. the corresponding population prediction.
NPDE vs. PRED and TAD for unbound and total concentration of sorafenib as well as the total concentration of the N‐oxide metabolite are shown in Figure 3. The figure suggests minimal bias and trends in the structural model (NPDE vs. TAD) and error model (NPDE vs. PRED).
Figure 3.
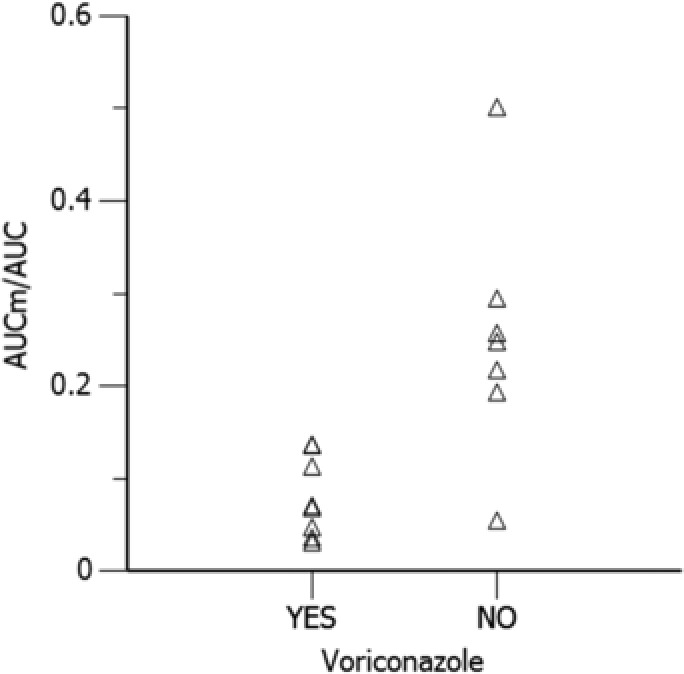
Model predicted effect of co‐administration of voriconazole on the AUC ratio of N‐oxide metabolite and sorafenib at steady state. AUC, area under the sorafenib concentration time curve; AUCm, area under the curve of sorafenib N‐oxide metabolite concentration time curve.
Assessment of exposure‐response relationship
The inhibitory Emax models adequately described the exposure‐response relationship between the adjusted sorafenib concentration and FLT3 and ERK activity separately. The of sorafenib on FLT3 was fixed to 100%, as sorafenib showed a strong inhibitory capacity on FLT3 activity, with an of 69.3ng/mL (). The of ERK was estimated to be 84%, with an of 85.7ng/mL (). As seen in Figure 4, the population model predictions capture the general trend of observations for both FLT3 and ERK activities, respectively. The final parameter estimates with bootstrap results for the PK/PD model are presented in Table 2. No BSV was able to be estimated on PD parameters.
Figure 4.

Observed and model predicted FMS‐related tyrosine kinase 3 (FLT3) and extracellular signal‐regulated kinase (ERK) percent activity vs. the adjusted sorafenib plasma concentration. The solid circles represent the observed FLT3 and ERK activities and the black line represent the model predicted FLT3 and ERK activities.
Table 2.
Final population pharmacokinetic/pharmacodynamic parameter FOCE‐I estimate and 95% confidence interval with median estimates and 95% percentile interval from 1,000 bootstraps
| FOCE‐I | Bootstrap | |||||||
|---|---|---|---|---|---|---|---|---|
| PK/PD parameter | Estimate | 95% confidence interval | BSV | Median | 95% percentile interval | BSV | ||
|
|
1/h | 3.75 | (2.49–5.00) | 63.40% | 3.78 | (2.63–5.17) | 61.80% | |
| V | L | 171 | (107–234) | 74.40% | 167 | (127–247) | 73.60% | |
| V 7 | L | 89.80 | (31.90–148) | 122% | 94.50 | (46.80–213) | 115% | |
|
|
L/h | 14.10 | (9.02–19.10) | 55.00% | 14.20 | (10.0–20.90) | 67.20% | |
|
|
50.20% | (48.40–52.0%) | 50.20% | (50.20–50.20%) | ||||
| K 64 | 1/h | 0.173 | (0.080–0.266) | 0.17 | (0.096–4.58) | |||
|
|
h | 5.48 | (3.90–7.05) | 5.47 | (3.00–7.22) | |||
|
|
1.81% | (2.57–1.28%) | 1.26% | 1.85% | (2.53–1.27%) | 1.22% | ||
|
|
L/h | 116 | (20.50–212) | 117% | 123 | (79.80–179) | 117% | |
| Proportional errorsorafenib | 47.60% | (38.90–56.20%) | 47.50% | (39.80–57.30%) | ||||
| Proportional errorN‐oxide | 42.40% | (35.00–49.90%) | 41.70% | (33.50–49.00%) | ||||
| Additive errorN‐oxide | ng/mL | 1.06 | (0.28–1.85) | 1.08 | (0.62–1.27) | |||
|
|
ng/mL | 69.30 | (18.30–120) | 87.60 | (35.80–150) | |||
|
|
ng/mL | 85.70 | (25.60–146) | 109 | (16.30–150) | |||
|
|
0.84 | (0.80–0.88) | 0.82 | (0.80–0.87) | ||||
| Proportional errorFLT3 | 87.90% | (66.60–109%) | 81.20% | (43.20–106%) | ||||
| Proportional errorERK | 39.40% | (24.30–54.50%) | 42.90% | (26.10–51.10%) |
BSV, body surface area; , total clearance; , is the clearance of the N‐oxide metabolite; , the fraction of sorafenib that goes through enterohepatic circulation; FOCE‐I, first order conditional estimation method with interaction; , the %fraction of unbound sorafenib; and , represent the adjusted sorafenib concentrations required to produce 50% of maximum inhibition of FLT3 or ERK, respectively; K 64, the release rate constant from gallbladder back to the gastrointestinal track; , the absorption rate constant; PK/PD, pharmacokinetic/pharmacodynamic; V and V 7, the apparent volume of distribution for compartment A5 and A7, respectively; , the time controller.
Simulation and dosing recommendation
The proportions of subjects who consistently achieved a certain level of inhibition during the entire dosing interval at steady state are presented in Figure 5 for FLT3 and ERK separately. The 400 mg b.i.d., 400 mg q.d., and 200 mg b.i.d. dosing regimens showed similar magnitudes of inhibition of both FLT3 and ERK activities. A fractionated dose of 200 mg b.i.d. yielded results similar to 400 mg q.d. with respect to the proportion of subjects achieving 80% FLT3 inhibition, and resulted in ∼10% higher proportion patients achieving with 80% ERK inhibition. The 200 mg q.d. and 200 mg q.o.d. dosing regimens showed a smaller proportion of patients who had >80% inhibition on FLT3 and >80% inhibition of ERK.
Figure 5.

Proportion of subjects in FMS‐related tyrosine kinase 3 (FLT3) and extracellular signal‐regulated kinase (ERK) inhibition after oral administration of 200 mg every other day (q.o.d.), 200 mg daily (q.d.), 200 mg twice a day (b.i.d.), 400 mg q.d., and 400 mg b.i.d.
DISCUSSION
The use of an exposure‐response relationship to inform the selection of optimal dosing regimen in oncology drug development and regulatory approval from 2010 to 2015 has resulted in a decreased use of MTD‐based (toxicity‐driven) dosing strategies.36 To optimize dose selection of sorafenib in AML clinical trials, we applied the exposure‐response relationship of sorafenib identified in the initial phase I study based on the magnitude of FLT3‐ITD and ERK activity, which are surrogate markers of the overall efficacy in this population.5 According to our simulation results, a dosing regimen of 200 mg b.i.d. is a safe and efficacious choice for ongoing and future trials in patients with AML (ClinicalTrials.gov Identifier: NCT01578109). Nonetheless, in the absence of therapeutic drug monitoring combined with large interindividual variability in sorafenib exposure,21, 22 it may be prudent to titrate the dose to an individual patient's level of tolerability, after starting at a 200 mg b.i.d. dose. This recommendation is a culmination of the totality of our assessment combined with the following: (i) Boudou‐Rouquette et al.37 have observed a decrease in sorafenib exposure over a prolonged time; (ii) Hornecker et al.23 have recommended fractionated dosing to overcome saturable absorption; and (iii) Gomberg‐Maitland et al.38 recommended a dose of 200 mg b.i.d. be further studied in patients with pulmonary arterial hypertension due to intolerability at higher doses over a 4‐month period.
Compared with the previously published sorafenib PK model in patients with solid tumors,21 a limited number of patients were included in this phase I clinical trial and a small number of samples were collected mainly after the first dose.9 Therefore, the previously published population PK model was adopted, and allometric scaling was implemented to improve the model reliability and stability, even though it was not included previously. The BSV in the PK parameters and WSV were high due to both the limited sample size and the known variability in sorafenib PK.21 However, BSV was similar and WSV was lower compared with that reported by Jain et al.21 Sorafenib undergoes enterohepatic recirculation in patients with AML, supported by both preclinical studies and physiologically based PK modeling of sorafenib in mice, which we imputed in our model.29
In this study, we found that ∼68.3% less of the N‐oxide metabolite was formed after co‐administration of voriconazole, another strong CYP3A4 inhibitor, as seen in Figure 2. However, we chose not to include voriconazole as a predictor on the formation clearance of the N‐oxide metabolite due to several reasons. First, given the small sample size we could not make a conclusive inference as the SEs of the covariate effect were large and the model was highly unstable. Second, it is well known from literature that ketoconazole, a strong CYP3A4 inhibitor, can substantially inhibit the formation of sorafenib N‐oxide metabolite by almost 100%, although it has limited impact on sorafenib PK profile.25 This suggests that the CYP3A4 pathway is a minor metabolic pathway in sorafenib metabolism and accounts for a limited portion of the total clearance of sorafenib. We observed no change in sorafenib exposure in the presence of voriconazole, although N‐oxide metabolite was inhibited. Moreover, no dosage adjustment is recommended in the sorafenib drug label (https://www.accessdata.fda.gov/drugsatfda_docs/label/2010/021923s008s009lbl.pdf). Last, as the exposures of the parent and the metabolite in this exposure‐response model are driven by the post hoc estimates of the model, these estimates would not be impacted in the presence or absence of voriconazole as a covariate. The addition of the covariate would only help reduce the variability of the population PK parameters. Thus, we were confident that there is no impact on the dose selection based on the exposure‐response in the study. However, the intricacies of this drug‐drug interaction need to be explored further given the relevance of the N‐oxide metabolite's contribution to FLT3 activity.9
Because of their prevalence, their association with poor overall survival, and the ability to detect and quantitate their presence even in the minimal residual disease state, FLT3 mutations as targets for AML therapy have drawn attention from industry and clinical practitioners.5, 6, 39 Because the quantitative relationship between FLT3 activity and clinical outcome (i.e., overall survival and objective response rate) has been establised,8, 17, 18 it is appropriate to utlilize the degree of target inhibition from early clinical trials as a surrogate marker to support dosing selection. Sorafenib and its N‐oxide metabolite showed a concentration‐dependent inhibitory effect on both FLT3 and ERK activities.9 With the doses given in this study, although FLT3‐ITD activity was fully inhibited by sorafenib, ERK activity could not be completely inhibited due to multiple pathways that can upregulate the ERK activity in cancer cells.40, 41
Midostaurin received approval from the FDA for newly‐diagnosed FLT3‐mutated AML utilizing a dosing regimen that was associated with an average of 57.5% FLT3 inhibitory activity in the intensively treated adults with FLT3‐ITD positive AML.42 Noting the poor tolerability of higher dosed sorafenib (i.e., 400 mg b.i.d.) and the fourfold higher in vitro sorafenib FLT3‐ITD inhibitory activity of sorafenib compared with midostaurin,43 it is possible that lower dosing (i.e., 200 mg b.i.d.) and lower exposure may still result in similar clinical efficacy as midostaurin and provide a better safety profile.
The dose‐limiting toxicity rate of ∼20% (2/9 patients) in our original clinical trial suggests an important tolerability issue at 400 mg b.i.d. regimen.9 Due to the small number of patients with dose‐limiting toxicities reported in our original clinical trial,9 we were unable to perform an exposure‐toxicity assessment. However, in accordance with previously reported clinical trials in patients with AML, a lower dose of sorafenib is associated with enhanced tolerability.19, 20 Recently, another observational study has shown that sorafenib‐related adverse events were associated with a relatively higher exposure of the N‐oxide metabolite after 400 mg b.i.d. dosing.44 Therefore, a decreased frequency and/or severity of adverse events may be expected in patients with AML with a lower dosing regimen, such as the proposed dose of 200 mg b.i.d.
Considering the simulated FLT3 and ERK activities across the spectrum of dosing regimens, sorafenib 200 mg b.i.d. is considered to be a practical choice for initiation of therapy and is recommended as the starting dose for ongoing and future clinical trials designed to evaluate the clinical efficacy and tolerability in AML. The dose may be titrated up to 400 mg b.i.d. if the drug is being well‐tolerated and titrated down as low as 200 mg q.o.d. if 200 mg b.i.d. is not tolerated well.
Conflict of Interest
The authors declared no competing interests for this work.
Acknowledgments
We are grateful to all the patients who participated in the clinical trial. We would also like to thank Dr Judith E. Karp for her critical review of this manuscript.
Source of Funding
The project described was supported in part by the National Cancer Institute (NCI) Cooperative Agreement U01CA070095, and UM1CA186691 (B.D.S., K.W.P., and M.A.R.) and by the Analytical Pharmacology Core of the Sidney Kimmel Comprehensive Cancer Center at Johns Hopkins (National Institutes of Health (NIH) grants P30CA006973 and UL1TR001079). Grant number UL1TR 001079 is from the National Center for Advancing Translational Sciences (NCATS) a component of the NIH, and NIH Roadmap for Medical Research. Its contents are solely the responsibility of the authors and do not necessarily represent the official view of the Johns Hopkins ICTR, NCATS, or NIH.
Author Contributions
T.L., V.I., B.D.S., K.W.P., and M.A.R. wrote the manuscript. T.L., V.I., J.J.W., B.D.S., K.W.P., and M.A.R. designed the research. T.L., V.I., P.S., J.V.S.G., J.M.G., and M.A.R. performed the research. T.L., V.I., P.S., B.D.S., K.W.P., and M.A.R. analyzed the data.
Contributor Information
Vijay Ivaturi, Email: vivaturi@rx.umaryland.edu.
Michelle A. Rudek, Email: mrudek2@jhmi.edu
References
- 1. Pulte, D . et al Survival in patients with acute myeloblastic leukemia in Germany and the United States: major differences in survival in young adults. Int. J. Cancer 139, 1289–1296 (2016). [DOI] [PubMed] [Google Scholar]
- 2. Visser, O . et al Incidence, survival and prevalence of myeloid malignancies in Europe. Eur. J. Cancer 48, 3257–3266 (2012). [DOI] [PubMed] [Google Scholar]
- 3. National Comprehensive Cancer Network . Acute Myeloid Leukemia (version 1.2018). February 12, 2018.
- 4. Dohner, H . et al Diagnosis and management of acute myeloid leukemia in adults: recommendations from an international expert panel, on behalf of the European LeukemiaNet. Blood 115, 453–474 (2010). [DOI] [PubMed] [Google Scholar]
- 5. Levis, M. & Small, D. FLT3: ITDoes matter in leukemia. Leukemia 17, 1738–1752 (2003). [DOI] [PubMed] [Google Scholar]
- 6. Stirewalt, D.L. & Radich, J.P . The role of FLT3 in haematopoietic malignancies. Nat. Rev. Cancer 3, 650–665 (2003). [DOI] [PubMed] [Google Scholar]
- 7. McCurdy, S.R. & Levis, M.J . Emerging molecular predictive and prognostic factors in acute myeloid leukemia. Leuk. Lymphoma 1–19 e‐pub ahead of print 2 November 2017. [DOI] [PubMed] [Google Scholar]
- 8. Knapper, S . et al A randomized assessment of adding the kinase inhibitor lestaurtinib to first‐line chemotherapy for FLT3‐mutated AML. Blood 129, 1143–1154 (2017). [DOI] [PMC free article] [PubMed] [Google Scholar]
- 9. Pratz, K.W . et al A pharmacodynamic study of sorafenib in patients with relapsed and refractory acute leukemias. Leukemia 24, 1437–1444 (2010). [DOI] [PMC free article] [PubMed] [Google Scholar]
- 10. Stone, R.M . et al Midostaurin plus chemotherapy for acute myeloid leukemia with a FLT3 mutation. N. Engl. J. Med. 377, 454–464 (2017). [DOI] [PMC free article] [PubMed] [Google Scholar]
- 11. Sammons, S.L. , Pratz, K.W. , Smith, B.D. , Karp, J.E. & Emadi, A . Sorafenib is tolerable and improves clinical outcomes in patients with FLT3‐ITD acute myeloid leukemia prior to stem cell transplant and after relapse post‐transplant. Am. J. Hematol. 89, 936–938 (2014). [DOI] [PMC free article] [PubMed] [Google Scholar]
- 12. Borthakur, G . et al Phase I study of sorafenib in patients with refractory or relapsed acute leukemias. Haematologica 96, 62–68 (2011). [DOI] [PMC free article] [PubMed] [Google Scholar]
- 13. Ravandi, F . et al Final report of phase II study of sorafenib, cytarabine and idarubicin for initial therapy in younger patients with acute myeloid leukemia. Leukemia 28, 1543–1545 (2014). [DOI] [PMC free article] [PubMed] [Google Scholar]
- 14. Ravandi, F . et al Phase I/II study of combination therapy with sorafenib, idarubicin, and cytarabine in younger patients with acute myeloid leukemia. J. Clin. Oncol. 28, 1856–1862 (2010). [DOI] [PMC free article] [PubMed] [Google Scholar]
- 15. Widemann, B.C . et al A phase I trial and pharmacokinetic study of sorafenib in children with refractory solid tumors or leukemias: a Children's Oncology Group Phase I Consortium report. Clin. Cancer Res. 18, 6011–6022 (2012). [DOI] [PMC free article] [PubMed] [Google Scholar]
- 16. Man, C.H . et al Sorafenib treatment of FLT3‐ITD(+) acute myeloid leukemia: favorable initial outcome and mechanisms of subsequent nonresponsiveness associated with the emergence of a D835 mutation. Blood 119, 5133–5143 (2012). [DOI] [PubMed] [Google Scholar]
- 17. Fischer, T . et al Phase IIB trial of oral midostaurin (PKC412), the FMS‐like tyrosine kinase 3 receptor (FLT3) and multi‐targeted kinase inhibitor, in patients with acute myeloid leukemia and high‐risk myelodysplastic syndrome with either wild‐type or mutated FLT3. J. Clin. Oncol. 28, 4339–4345 (2010). [DOI] [PMC free article] [PubMed] [Google Scholar]
- 18. Levis, M . et al Results from a randomized trial of salvage chemotherapy followed by lestaurtinib for patients with FLT3 mutant AML in first relapse. Blood 117, 3294–3301 (2011). [DOI] [PMC free article] [PubMed] [Google Scholar]
- 19. Tong, F.K. , Chow, S. & Hedley, D. Pharmacodynamic monitoring of BAY 43–9006 (Sorafenib) in phase I clinical trials involving solid tumor and AML/MDS patients, using flow cytometry to monitor activation of the ERK pathway in peripheral blood cells. Cytometry B Clin. Cytom. 70, 107–114 (2006). [DOI] [PubMed] [Google Scholar]
- 20. Crump, M . et al A randomized phase I clinical and biologic study of two schedules of sorafenib in patients with myelodysplastic syndrome or acute myeloid leukemia: a NCIC (National Cancer Institute of Canada) Clinical Trials Group Study. Leuk. Lymphoma 51, 252–260 (2010). [DOI] [PubMed] [Google Scholar]
- 21. Jain, L . et al Population pharmacokinetic analysis of sorafenib in patients with solid tumours. Br. J. Clin. Pharmacol. 72, 294–305 (2011). [DOI] [PMC free article] [PubMed] [Google Scholar]
- 22. Strumberg, D . et al Safety, pharmacokinetics, and preliminary antitumor activity of sorafenib: a review of four phase I trials in patients with advanced refractory solid tumors. Oncologist 12, 426–437 (2007). [DOI] [PubMed] [Google Scholar]
- 23. Hornecker, M . et al Saturable absorption of sorafenib in patients with solid tumors: a population model. Invest. New Drugs 30, 1991–2000 (2012). [DOI] [PubMed] [Google Scholar]
- 24. Villarroel, M.C . et al Plasma protein binding of sorafenib, a multi kinase inhibitor: in vitro and in cancer patients. Invest. New Drugs 30, 2096–2102 (2012). [DOI] [PMC free article] [PubMed] [Google Scholar]
- 25. Lathia, C . et al Lack of effect of ketoconazole‐mediated CYP3A inhibition on sorafenib clinical pharmacokinetics. Cancer Chemother. Pharmacol. 57, 685–692 (2006). [DOI] [PubMed] [Google Scholar]
- 26. Bins, S . et al Influence of OATP1B1 function on the disposition of sorafenib‐beta‐D‐glucuronide. Clin. Transl. Sci. 10, 271–279 (2017). [DOI] [PMC free article] [PubMed] [Google Scholar]
- 27. Zimmerman, E.I . et al Contribution of OATP1B1 and OATP1B3 to the disposition of sorafenib and sorafenib‐glucuronide. Clin. Cancer Res. 19, 1458–1466 (2013). [DOI] [PMC free article] [PubMed] [Google Scholar]
- 28. Swift, B . et al Sorafenib hepatobiliary disposition: mechanisms of hepatic uptake and disposition of generated metabolites. Drug Metab. Dispos. 41, 1179–1186 (2013). [DOI] [PMC free article] [PubMed] [Google Scholar]
- 29. Edginton, A.N. , Zimmerman, E.I. , Vasilyeva, A. , Baker, S.D. & Panetta, J.C. Sorafenib metabolism, transport, and enterohepatic recycling: physiologically based modeling and simulation in mice. Cancer Chemother. Pharmacol. 77, 1039–1052 (2016). [DOI] [PMC free article] [PubMed] [Google Scholar]
- 30. Nie, L . et al Rendering the 3 + 3 design to rest: more efficient approaches to oncology dose‐finding trials in the era of targeted therapy. Clin. Cancer Res. 22, 2623–2629 (2016). [DOI] [PubMed] [Google Scholar]
- 31. Sachs, J.R. , Mayawala, K. , Gadamsetty, S. , Kang, S.P. & de Alwis, D.P. Optimal dosing for targeted therapies in oncology: drug development cases leading by example. Clin. Cancer Res. 22, 1318–1324 (2016). [DOI] [PubMed] [Google Scholar]
- 32. Li, L . et al Quantitation of sorafenib and its active metabolite sorafenib N‐oxide in human plasma by liquid chromatography‐tandem mass spectrometry. J. Chromatogr. B Analyt. Technol. Biomed. Life Sci. 878, 3033–3038 (2010). [DOI] [PMC free article] [PubMed] [Google Scholar]
- 33. Pratz, K.W . et al A pharmacodynamic study of the FLT3 inhibitor KW‐2449 yields insight into the basis for clinical response. Blood 113, 3938–3946 (2009). [DOI] [PMC free article] [PubMed] [Google Scholar]
- 34. Comets, E. , Brendel, K. & Mentre, F. Computing normalised prediction distribution errors to evaluate nonlinear mixed‐effect models: the npde add‐on package for R. Comput. Methods Programs Biomed. 90, 154–166 (2008). [DOI] [PubMed] [Google Scholar]
- 35. Pratz, K.W . et al Prospective study of peri‐transplant use of sorafenib as remission maintenance for FLT3‐ITD patients undergoing allogeneic transplantation. Blood 126, 3164 (2015). [Google Scholar]
- 36. Lu, D . et al A survey of new oncology drug approvals in the USA from 2010 to 2015: a focus on optimal dose and related postmarketing activities. Cancer Chemother. Pharmacol. 77, 459–476 (2016). [DOI] [PMC free article] [PubMed] [Google Scholar]
- 37. Boudou‐Rouquette, P . et al Variability of sorafenib toxicity and exposure over time: a pharmacokinetic/pharmacodynamic analysis. Oncologist 17, 1204–1212 (2012). [DOI] [PMC free article] [PubMed] [Google Scholar]
- 38. Gomberg‐Maitland, M . et al A dosing/cross‐development study of the multikinase inhibitor sorafenib in patients with pulmonary arterial hypertension. Clin. Pharmacol. Ther. 87, 303–310 (2010). [DOI] [PMC free article] [PubMed] [Google Scholar]
- 39. Grafone, T. , Palmisano, M. , Nicci, C. & Storti, S. An overview on the role of FLT3‐tyrosine kinase receptor in acute myeloid leukemia: biology and treatment. Oncol. Rev. 6, e8 (2012). [DOI] [PMC free article] [PubMed] [Google Scholar]
- 40. Bruner, J.K . et al Adaptation to TKI treatment reactivates ERK signaling in tyrosine kinase‐driven leukemias and other malignancies. Cancer Res. 77, 5554–5563 (2017). [DOI] [PMC free article] [PubMed] [Google Scholar]
- 41. Sever, R. & Brugge, J.S . Signal transduction in cancer. Cold Spring Harb. Perspect. Med. 5, (2015). [DOI] [PMC free article] [PubMed] [Google Scholar]
- 42. Kayser, S . et al Pharmacodynamic analysis of the inhibitory potency of the tyrosine kinase inhibitor midostaurin in combination with intensive chemotherapy including allogeneic hematopoietic stem cell transplantation followed by maintenance therapy in FLT3‐ITD positive acute myeloid leukemia in the ongoing AMLSG 16‐10 trial. Blood 122, 1283 (2013). [Google Scholar]
- 43. Pratz, K.W . et al FLT3‐mutant allelic burden and clinical status are predictive of response to FLT3 inhibitors in AML. Blood 115, 1425–1432 (2010). [DOI] [PMC free article] [PubMed] [Google Scholar]
- 44. Shimada, M . et al Monitoring serum levels of sorafenib and its N‐oxide is essential for long‐term sorafenib treatment of patients with hepatocellular carcinoma. Tohoku J. Exp. Med. 237, 173–182 (2015). [DOI] [PubMed] [Google Scholar]