

Abstract
Activation of microglia by classical inflammatory mediators can convert astrocytes to a neurotoxic A1 phenotype in a variety of neurological diseases1,2. Development of agents that could inhibit the formation of A1 reactive astrocytes could be used to treat these diseases for which there are no disease modifying therapies. Glucagon-like peptide-1 receptor (GLP-1R) agonists have been touted as potential neuroprotective agents for neurologic disorders such as Alzheimer’s disease (AD) and Parkinson’s disease (PD)3-13. The mechanisms by which GLP-1R agonists are neuroprotective are not known. Here we show that a potent, brain penetrant long acting GLP-1R agonist NLY01 protects against the loss of dopamine neurons and behavioral deficits in the α-synuclein preformed fibril (α-syn PFF) model of sporadic PD14,15. NLY01 also prolongs the life and reduces the behavioral deficits and neuropathological abnormalities in the human A53T α-synuclein (hA53T) transgenic (Tg) model of α-synucleinopathy induced neurodegeneration16. We found that NLY01 is a potent GLP-1R agonist with favorable properties that is neuroprotective via the direct prevention of microglial mediated conversion of astrocytes to an A1 neurotoxic phenotype. In light of NLY01 favorable properties it should be evaluated in the treatment of PD and related neurologic disorders characterized by microglial activation.
NLY01 is a pegylated long-acting GLP-1R agonist with an extended half-life and pharmacodynamic profiles in non-human primates (88 hrs versus the 2 hrs half-life of Exendin-4) and in mice (38 hrs) while retaining comparable biologic activity to Exendin-4 in vitro (Supplementary Fig. 1, Supplementary Table 1). NLY01 does not increase the risk of hypoglycemia when administered in a normoglycemic state in both WT and hA53T Tg mice (Supplementary Fig. 1g). NLY01 efficiently penetrates the blood-brain barrier (BBB) in wild type (WT) mice and reaches high brain levels in ten-month-old hA53T Tg mice (Supplementary Fig. 2a-c). The high levels in the hA53T Tg mice may be due to the breakdown of the BBB (Supplementary Fig. 2d,e)5,17,18. The neuroprotective potential of NLY01 was first evaluated in the α-syn PFF model of sporadic PD14,15. Recombinant mouse α-syn was purified and depleted of endotoxin, and α-syn PFF were made and validated via atomic force microscopy (AFM) and transmission electron microscopy (TEM) and the ability to induce phospho-serine 129 α-synuclein (p-α-synser129) immunostaining15,19. We elected to initiate the treatment of NLY01 one month after the intrastriatal injection of α-syn PFF, since spread and initial manifestation of pathology in this model is beginning to be evident at this time point14,15. Six months after the intrastriatal injection of α-syn PFF in which mice received NLY01 for five months, a number of biochemical and behavioral assays were performed and comparisons were made between vehicle (PBS) and 3 mg/kg NLY01 subcutaneously (s.c.) injected mice twice a week (Fig. 1a). As previously described, there is substantial p-α-synser129 immunoreactivity in the striatum and ventral midbrain (VMB) of α-syn PFF injected mice indicative of pathologic α-syn15 (Fig. 1b,c and Supplementary Fig. 3a-d). NLY01 significantly reduces p-α-synser129 immunoreactivity in the striatum, ventral midbrain, and specifically in tyrosine hydroxylase (TH) immunoreactive neurons (Fig. 1b,c and Supplementary Fig. 3a,b). NLY01 also significantly reduces the amount of pathologic Triton X-100 (TX) insoluble α-syn and p-α-synser129 as determined by western blot (Supplementary Fig. 3c,d). α-Syn PFF injection induces a significant loss of TH and Nissl positive neurons in the SNpc, which is prevented by NLY01 (Fig. 1d-f). Western blot analysis reveals that α-syn PFF mediated reduction in TH and dopamine transporter (DAT) immunoreactivity is restored by NLY01 in the ventral midbrain (Supplementary Fig. 4a, b). In addition, the α-syn PFF induced reduction in striatal TH immunoreactivity (Supplementary Fig. 5a, b) and the striatal levels TH and DAT protein (Supplementary Fig. 5c, d) is rescued by NLY01. α-Syn PFF induced reductions in dopamine (DA) and its metabolites, homovanillic acid (HVA), 3-methoxytyramine (3MT) and 3,4-dihydroxyphenylacetic acid (DOPAC) and the increased DOPAC+HVA DA ratio and the DOPAC+3MT DA ratio are normalized by NLY01 treatment (Fig. 1g and Supplementary Fig. 5e-i). The amphetamine rotation test was utilized to monitor the behavioral consequences of unilateral α-syn PFF injection. There is marked ipsilateral amphetamine induced rotation in the α-syn PFF injected mice, which is prevented by NLY01 (Fig. 1h and Supplementary Fig. 6a). NLY01 also significantly reduces the behavioral deficits elicited by α-syn PFF injected as measured by the accelerating rotarod test (Supplementary Fig. 6b) and the pole test (Fig. 1i and Supplementary Fig. 6c,d). α-Syn PFF injection also reduces contralateral forepaw touches in the cylinder test, which is restored by NLY01 (Supplementary Fig. 6e). There are no defects in the ipsilateral forepaw (Supplementary Fig. 6f). The increase in grooming time and reduction in rearing induced by α-syn PFF is restored by NLY01 (Supplementary Fig. 6g,h).
Figure 1.

α-syn PFF-induced PD like pathology is rescued by NLY01. (a) Schematic diagram of the α-syn PFF experimental design. (b) Representative double-immunostaining for p-α-synser129 (p-α-syn) (green) and TH (red) in the SNpc. White arrows point to DA neuron loss. Low power images were generated by the tile scan algorithm in the Zen software (n=6, biologically independent animals). Scale bar, 100 μm or 10 μm, respectively. (c) Percentage of TH neurons with p-α-synser129 positive inclusion in the SNpc region. Error bars represent the mean ± S.E.M. (n=6, biologically independent animals, p value = 0.0007). Unpaired two-tailed Student’s test were used for statistical analysis. (d) Representative photomicrographs from coronal mesencephalon sections containing TH-positive neurons in the SNpc region (n=10, biologically independent animals). Scale bar, 500 μm. (e) Unbiased stereologic counts of TH and (f) Nissl-positive neurons in the SNpc region. Error bars represent the mean ± S.E.M. (n=10, biologically independent animals). (g) HPLC assessment of DA concentrations in the striatum of PBS and α-syn PFF stereotaxic injected mice that were treated with vehicle or NLY01. Error bars represent the mean ± S.E.M. (n=5, biologically independent animals). (h-i) Behavioral tests after PBS or α-syn PFF stereotaxic intrastriatal injection at six-months in vehicle or NLY01 treated mice. (h) Amphetamine rotation test, and (i) pole test. Error bars represent the mean ± S.E.M. (n=12 PBS with vehicle, n=13 PBS with NLY01, n=14 α-syn PFF with vehicle, and n=11 α-syn PFF with NLY01, biologically independent animals). Two-way ANOVA was used for statistical analysis followed by Tukey’s multiple comparisons test. #P < 0.05, ##P < 0.01, ###P < 0.001 vs. PBS stereotaxic injected mice with vehicle; *P < 0.05, **P < 0.01, ***P < 0.001 vs. α-syn PFF stereotaxic injected mice with NLY01. Maximum time to climb down the pole was limited to 60 sec.
The effects of NLY01 were further evaluated in a progressive, lethal constitutive α-synucleinopathy model, the hA53T Tg mice16,20. This model exhibits hyperactivity and evidence of pathologic α-syn at four to six months of age16,20. Accordingly, treatment with NLY01 in the hA53T Tg mice was started at six months of age and the mice were monitored until they were moribund (Supplementary Fig. 7). NLY01 significantly prolongs the lifespan of the hA53T Tg mice by over 100 days (Fig. 2a). Accompanying the prolonged survival is a reduction in p-α-synser129 immunoreactivity and aggregated α-syn, and a reduction of ubiquitin immunoreactivity in cells (Fig. 2b-h). NLY01 also reduces the accumulation of TX insoluble α-syn and p-α-synser129 (Fig. 2i-k). These results taken together indicate that NLY01 protects against the degenerative effects of injected α-syn PFF and constitutive expression of the hA53T α-syn.
Figure 2.
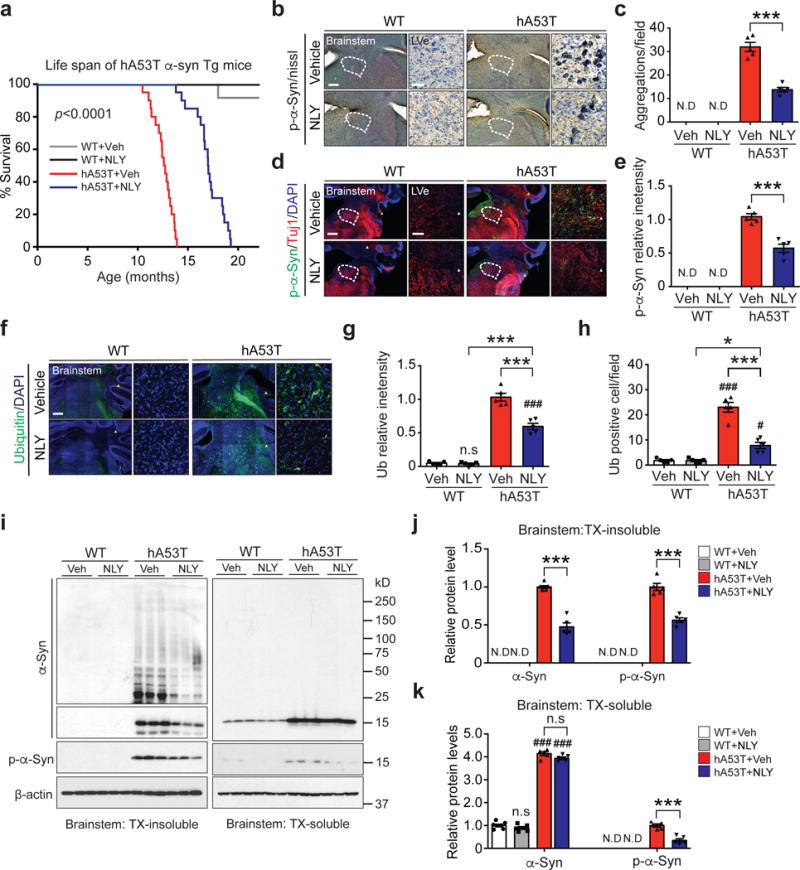
NLY01 reduces the pathology in the hA53T α-syn transgenic mice. (a) Kaplan-Meier survival curves of littermate wild type (WT) and hA53T α-syn Tg mice treated with vehicle or NLY01 (3 mg/kg, n=20, biologically independent animals, p value < 0.0001). Statistical analysis for the survival curves were performed by Log-rank (Mantel-Cox) test. (b, d) Representative p-α-synser129 (p-α-syn) immunohistochemistry and immunostaining (red) in the lateral vestibular nucleus (LVe) of the brainstem (n=5, biologically independent animals). Low power images were generated by the tile scan algorithm in the Zen software. White arrow head (tile image line). Scale bar, 200 μm or 25 μm, respectively. (c, e) Quantification of LVe neurons containing p-α-synser129 positive-immunoreactivity inclusions. Error bars represent the mean ± S.E.M. (n=5, biologically independent animals, p value < 0.0001 for panel c and p value = 0.0003 for panel e). (f) Representative ubiquitin immunostaining (green) in the LVe (n=5, biologically independent animals). Scale bar, 200 μm or 25 μm. (g, h) Quantification of LVe neurons that are ubiquitin-positive. Error bars represent the mean ± S.E.M (n=5, biologically independent animals). (i) Representative immunoblots of α-syn, p-α-synser129 and β-actin in detergent (Triton-X100) insoluble fractions and detergent soluble fractions of the brainstem from ten-month-old WT and hA53T α-syn Tg mice treated with vehicle or NLY01 for four months (cropped blot images are shown, see Supplementary Fig. 21 for full immunoblots). (j) Quantification of α-syn monomer, aggregation, and p-α-synser129 protein levels in detergent insoluble fractions normalized to β-actin. Error bars represent the mean ± S.E.M. (n=5, biologically independent animals, p value < 0.0001). (k) Quantification of α-syn monomer and p-α-synser129 protein levels in detergent soluble fractions normalized to β-actin. Error bars represent the mean ± S.E.M. (n=5, biologically independent animals, α-syn, p value < 0.0001 and p-α-syn, p value = 0.0002). Unpaired two-tailed Student’s test or two-way ANOVA was used for statistical analysis followed by Tukey’s multiple comparisons test. #P < 0.05, ###P < 0.001 vs. WT with vehicle; *P < 0.05, ***P < 0.001 vs. hA53T α-syn Tg with NLY01.
To determine the potential site of action of NLY01, the expression of GLP-1R was assessed in astrocytes, microglia and neuronal cultures. Glp1r mRNA expression is low in the mouse cortex, cerebellum and olfactory bulb, but there are high levels in the striatum, brainstem and ventral midbrain (Fig. 3a). GLP-1R protein is highly expressed in microglia and it is also expressed in astrocytes and neurons with reduced expression (Fig. 3b), which differs from the in vivo cortical Glp1r mRNA cellular expression profile21. This may be due to the regional heterogeneity of Glp1r mRNA expression (Fig. 3a). α-syn PFF treatment decreases Glp1r mRNA expression in neurons and increases Glp1r mRNA expression almost 2-fold in microglia (Fig. 3c). Glp1r mRNA expression is elevated greater than 10-fold in the substantia nigra of PD patients compared to controls (Supplementary Fig. 8a and Supplementary Table 2). GLP-1R immunoreactivity is mainly found in ionized calcium-binding adapter molecule (Iba-1) and transmembrane protein 119 (TMEM119) positive microglia in the substantia nigra pars compacta (SNpc) (Supplementary Fig. 8b-d). α-syn PFF treatment increases the immunoreactivity of GLP-1R in microglia, while the GLP-1R immunoreactivity is found at very low levels in neurons (Supplementary Fig. 8c,d) suggesting that the site of action of NLY01 is likely to be predominantly glial, particularly in the non-cortical brain regions. To determine the site of action of NLY01, the effects of NLY01 on microglial, astrocytic and neuronal cultures were assessed after treatment with α-syn PFF (Fig. 3d). In human dopaminergic (DA) neuronal cultures, direct treatment of NLY01 in the DA neurons fails to protect against α-syn PFF induced cell death as assessed by alamarBlue, lactate dehydrogenase (LDH) and trypan blue assays (Supplementary Fig. 9a-c), indicating that the site of action of NLY01 is likely to be upstream in either microglia and/or astrocytes. Previously, we reported that activated microglia convert astrocytes to toxic A1 astrocytes by releasing IL-1α, Tumor necrosis factor (TNF)α and C1q2. As such microglia were treated with α-syn PFF for 24 hrs and then the cytokine profile was assessed by an ELISA cytokine screening array. α-syn PFF induces secretion of a variety of cytokines including IL-1α and TNFα. NLY01 reduces the level of a subset of α-syn PFF induced cytokines including IL-1α, TNFα, IL-1ß, IL-6, typical markers of M1 microglia, and leptin (Supplementary Fig. 10a). Since C1q was not present on the ELISA cytokine array, C1q was directly monitored by western blot analysis and compared to TNFα. α-syn PFF induces both C1q and TNFα release into media, which are significantly inhibited by NLY01 (Supplementary Fig. 10b,c). Since NLY01 preferentially blocks microglia derived factors that induce A1 astrocytes, α-syn PFF microglial conditioned media (MCM) was applied to astrocytes for 24 hrs. The astrocyte conditioned media (ACM) was then collected, concentrated and applied to murine primary cortical cultures and human DA neurons in the presence or absence of NLY01 (Fig. 3d). α-syn PFF-ACM kills murine primary cortical cultures in a dose-dependent manner (Supplementary Fig. 11a). NLY01 applied to the α-syn PFF treated microglia significantly prevents α-syn PFF-ACM induced cell death in murine primary cortical cultures (Supplementary Fig. 11b) and human DA neurons (Supplementary Fig. 11c-e). The neuronal cell death of α-syn PFF-MCM is significantly less than that observed in α-syn PFF-ACM treatment (Supplementary Fig. 11f, g), suggesting that α-syn PFF induced A1 astrocytes are likely to be the primary glial culprit that mediates α-syn PFF toxicity. The observations that pretreatment of NLY01 in microglia, but not direct treatment of NLY01 into neurons, significantly reduced the levels of p-α-synser129 induced by α-syn PFF-ACM provide further support for the microglial action of NLY01 (Supplementary Fig. 12 and Supplementary Fig. 13).
Figure 3.
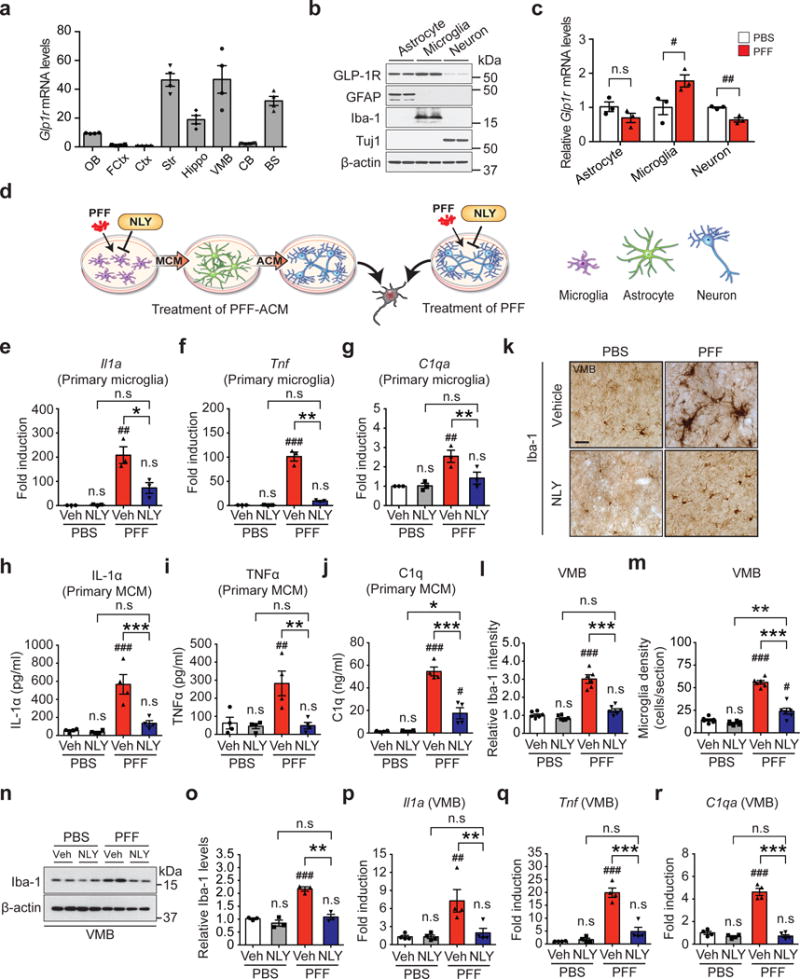
Inhibition of α-syn PFF-induced microglial activation by NLY01. (a) Glp1r mRNA expression was analyzed in various mouse brain regions. OB, olfactory bulb; FCtx, frontal cortex; Ctx, cerebral cortex; Str, striatum; Hippo, hippocampus; VMB, ventral midbrain; CB, cerebellum; BS, brainstem. Error bars represent the mean ± S.E.M. (n=4, biologically independent animals). (b) Predominant expression of GLP-1R in astrocytes and microglia. Mouse primary astrocytes (GFAP), microglia (Iba-1) and cortical neurons (Tuj1) were subjected to western blotting using GLP-1R antibody (cropped blot images are shown, see Supplementary Fig. 21 for full immunoblots). β-actin is provided as a loading control (n=3, biologically independent primary cells). (c) The Glp1r mRNA expression in α-syn PFF-activated primary cultured astrocyte, microglia, and neurons was analyzed by real-time RT-PCR. Bars represent the mean ± S.E.M. (n=3, biologically independent primary cells, primary microglia, p value = 0.0475 and primary cortical neuron, p value = 0.0045). (d) Schematic diagram showing treatment of α-syn PFF-astrocyte conditioned medium (ACM) or direct treatment of α-syn PFF into neurons. (e-g) Quantitative PCR analysis of NLY01 (1 μM) pretreatment on α-syn PFF-induced (1 μg/ml) microglial activation markers, (e) Il1a, (f), Tnfα, and (g) C1qa. Bars represent the mean ± S.E.M. (n=3, biologically independent primary microglia). (h-j) Cytokine analysis of α-syn PFF-activated microglia-conditioned medium (MCM) 18 hrs after α-syn PFF treatment by ELISA. NLY01 (1 μM) pretreatment prevented the increase of (h) IL-1α, (i) TNFα, and (j) C1q. Bars represent the mean ± S.E.M. (n=4, biologically independent primary microglia-conditioned medium). (k-m) Inhibition of α-syn PFF-induced microglial activation by NLY01 in vivo. (k) Representative immunohistochemical images of Iba-1. Scale bar, 50 μm. (l) Intensity of Iba-1 positive signals in the SNpc, (m) Quantification of Iba-1 positive cell number in the SNpc. Bars represent the mean ± S.E.M. (n=6, biologically independent animals). (n) Representative immunoblots of Iba-1 and β-actin in the ventral midbrain of PBS and α-syn PFF injected mice treated with vehicle or NLY01 (cropped blot images are shown, see Supplementary Fig. 21 for full immunoblots). (o) Quantification of Iba-1 levels in ventral midbrain normalized to β-actin. Bars represent the mean ± S.E.M. (n=3, biologically independent animals). (p-r) Quantitative PCR for (p) Il1a (q) Tnfα, and (r) C1qa in the ventral midbrain of α-syn PFF injected mice. Bars represent the mean ± S.E.M. (n=4, biologically independent animals). Unpaired two-tailed Student’s test or two-way ANOVA was used for statistical analysis followed by Tukey’s multiple comparisons test. #P < 0.05, ##P < 0.01, ###P < 0.001 vs. PBS with vehicle; *P < 0.05, **P < 0.01, ***P < 0.001 vs. or α-syn PFF with NLY01.
To further investigate the ability of α-syn PFF to activate microglia and the inhibitory effect of NLY01, the levels of IL-1α, TNFα, IL-1ß, IL-6, and C1q were monitored in response to α-syn PFF. α-syn PFF significantly induces mRNA for Il1a, Il1b, Tnfα, C1qa, and Il6 as determined by quantitative RT-PCR (qPCR) in primary microglia, and NLY01 significantly reduces this mRNA induction (Fig. 3e-g and Supplementary Fig. 10d,e). Protein levels for IL-1α, TNFα, IL-1ß, and C1q as determined by ELISA are increased with exposure to α-syn PFF and this induction is reduced by NLY01 (Fig. 3h-j and Supplementary Fig. 10f). To determine whether α-syn PFF induces microglia activation in vivo, Iba-1 immunoreactivity was monitored. Intrastriatal injection of α-syn PFF significantly increases Iba-1 immunoreactivity in the SNpc six months post injection and NLY01 significantly reduces the Iba-1 immunoreactivity and microglial density (Fig. 3k-m and Supplementary Fig. 10g). Western blot analysis for Iba-1 confirms the induction by α-syn PFF and the reduction by NLY01 (Fig. 3n,o). Consistent with the primary microglia results, intrastriatal injection of α-syn PFF induces mRNA for Il1a, Il1b, Tnfα, C1qa, and Il6 in the microglia of ventral midbrain. This induction is blocked by NLY01 (Fig. 3p-r and Supplementary Fig. 10h,i). Importantly, the inhibitory effect of NLY01 on α-syn PFF induced A1 microglia activation and α-syn PFF-ACM induced cell death is prevented by depletion of GLP-1R in TMEM119 positive-microglia, indicating that NLY01 exhibits protective effects primarily through microglial GLP-1R (Supplementary Fig. 14). NLY01 does not interfere with the uptake of α-syn PFF in microglia, but instead it inhibits the NF-kB pathway (Supplementary Fig. 15). The further inhibition of α-syn PFF induced microglia activation by NLY01 in TLR2 KO suggest that the effect of NLY01 is independent from TLR2 signaling22 (Supplementary Fig. 16).
To ascertain whether α-syn PFF treated microglia induces astrocytes, MCM from α-syn PFF treated microglia was applied to astrocytes and 24 hrs later, the expression of glial fibrillary acidic protein (GFAP) was monitored (Fig. 4a). α-syn PFF-MCM induces GFAP and this induction is blocked by NLY01 (Fig. 4b,c). To determine what type of astrocytes are induced by α-syn PFF-MCM, general astrocyte reactive, A1, and A2 specific mRNA levels were assessed by qPCR (Fig. 4d). α-syn PFF-MCM preferentially induces markers of A1 astrocytes, while not perturbing A2 specific transcripts (Fig. 4d and Supplementary Table 3). There is no remaining α-syn PFF in the MCM after 24 hrs treatment, indicating that this is not due to the astrocytes responding to α-syn PFF (Supplementary Fig. 17). Importantly, treatment of α-syn PFF-MCM prior to treatment of astrocytes with neutralizing antibodies to IL-1α, TNFα, and C1q prevents A1 type astrocyte formation (Supplementary Fig. 18a), and there is no neuronal death in primary cortical neurons (Supplementary Fig. 18b,c) and human DA neurons (Supplementary Fig. 18d,e) similar to the effects of NLY01. These results taken together indicate that microglia activated by α-syn PFF specifically convert astrocytes to neurotoxic A1 astrocytes and that NLY01 prevents this conversion. Consistent with the glial enriched expression of GLP-1R and the depletion of microglial GLP-1R (Supplementary Fig. 14), NLY01 treatment of microglia, but not that of astrocytes, prevents the induction of A1 astrocytic specific markers (Fig. 4d and Supplementary Fig. 19). Intrastriatal injection of α-syn PFF induces GFAP immunoreactivity in the ventral midbrain, which is blocked by NLY01 (Fig. 4e,f). Western blot analysis confirms that intrastriatally injected α-syn PFF induction of GFAP level in the ventral midbrain is blocked by NLY01 (Fig. 4g,h). Consistent with the induction of A1 specific transcripts, ventral midbrain C3d immunoreactivity is induced by intrastriatally injected α-syn PFF, which is blocked by NLY01 (Fig. 4g,h). To evaluate A1 astrocyte formation in the intrastriatally injected α-syn PFF model of sporadic PD, C3d immunohistochemistry was assessed in the ventral midbrain. C3d positive astrocytes are increased by α-syn PFF, which are blocked by NLY01 (Fig. 4i,j). NLY01 blocks the induction of C3 mRNA in isolated astrocytes in the ventral midbrain following intrastriatally injected α-syn PFF as determined by qPCR (Fig. 4k). General astrocyte reactive, A1, and A2 specific mRNA levels were also assessed by qPCR in astrocytes isolated from ventral midbrain. Intrastriatal injection of α-syn PFF primarily induces A1 astrocyte specific transcripts and this is prevented by NLY01 (Fig. 4l and Supplementary Table 4). Microglial and astrocytic activation has been previously described in the hA53T α-syn Tg mice16,23. Consistent with these observations, we confirmed both microglial and astrocytic activation as determined by Iba-1 and GFAP immunoreactivity, respectively. NLY01 significantly attenuates both microglial (Supplementary Fig. 20a-c) and astrocytic activation (Supplementary Fig. 20d,e). The mRNA for the A1 astrocyte marker C3 is markedly increased in ten-month-old hA53T α-syn Tg mice and this increase is prevented by NLY01 (Supplementary Fig. 20f).
Figure 4.
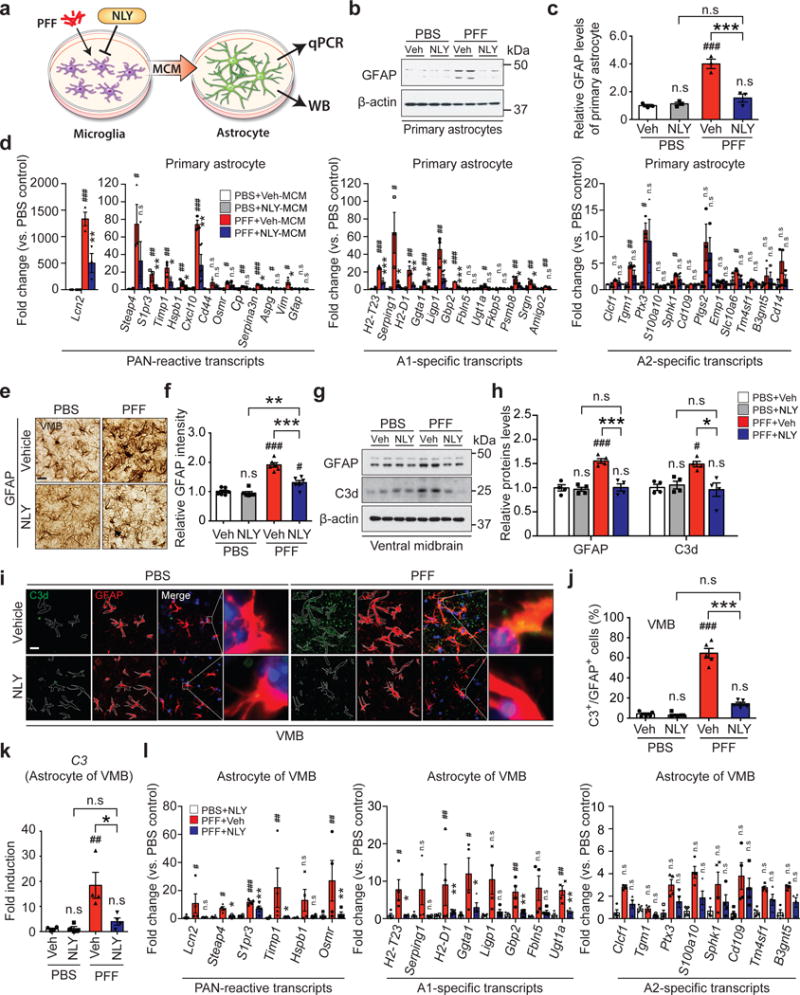
Inhibition of α-syn PFF-induced A1 reactive astrocytes by NLY01. (a) Schematic diagram showing the collection of astrocyte samples after treatment with MCM of α-syn PFF with or without NLY01 treated microglia. (b) Representative immunoblots of GFAP in primary astrocytes treated with α-syn PFF-MCM with vehicle or NLY01 (1 μM) (cropped blot images are shown, see Supplementary Fig. 21 for full immunoblots). (c) Quantification of GFAP levels. Bars represent the mean ± S.E.M. (n=3, biologically independent primary astrocytes). (d) Inhibition of α-syn PFF-induced A1 reactive astrocytes by NLY01 in purified primary astrocytes. Bars represent the mean ± S.E.M. (n=3, biologically independent primary astrocytes). (e, f) Inhibition of α-syn PFF-induced A1 reactive astrocytes by NLY01 in vivo. (e) Representative images of immunohistochemistry and (f) quantification of GFAP. Bars represent the mean ± S.E.M. (n=6, biologically independent animals). Scale bar, 50 μm. (g) Representative immunoblots of GFAP in the ventral midbrain region (cropped blot images are shown, see Supplementary Fig. 21 for full immunoblots). (h) Quantification of GFAP levels. Bars represent the mean ± S.E.M (n=4, biologically independent animals). (i) Co-localization of C3d and GFAP as assessed by confocal microscopy. Scale bar, 10 μm. (j) Percentage of GFAP positive cells that are C3d positive in the SNpc region. Bars represent the mean ± S.E.M. (n=5, biologically independent animals). (k) Increase in expression of C3 transcripts, which is prevented by NLY01 treatment in α-syn PFF injected mice. Bars represent the mean ± S.E.M. (n=4, biologically independent animals). (l) Quantitative PCR analysis of purified astrocytes from the ventral midbrain of α-syn PFF injected mice with vehicle or NLY01. Bars represent the mean ± S.E.M. (n=4, biologically independent animals). Two-way ANOVA was used for statistical analysis followed by Tukey’s multiple comparisons test. #P < 0.05, ##P < 0.01, ###P < 0.001 vs. PBS with vehicle; *P < 0.05, **P < 0.01, ***P < 0.001 vs. α-syn PFF with NLY01 or with Veh. n.s, not significant.
The major findings of this paper are the observation that the GLP-1R agonist, NLY01 protects in vivo against DA neuronal loss and behavioral deficits in the intrastriatal injection α-syn PFF mouse model of sporadic PD. Furthermore, NLY01 prolongs the survival and reduces the neuropathology of the hA53T α-syn Tg mice, a model of familial α-synucleinopathy. NLY01’s protective effects are independent of its potential action on neurons, but appear to primarily involve inhibition of microglia. We show that α-syn PFF induces microglial activation and that the microglia assume a “M1”-phenotype. The “M1”/“M2” macrophage nomenclature is under current refinement because macrophages clearly can display more than two states24,25. In any event this “M1” phenotype is consistent with prior reports that aggregated α-syn induces microglial activation and the observations that there are activated microglia in PD postmortem brains20,26. This M1 microglial activation then converts astrocytes into toxic A1 astrocytes1, which contributes to the demise of DA neurons in the α-syn PFF mouse model and in human DA neuronal cultures as well as contributing to the neurodegeneration in hA53T Tg mice. Prior reports are consistent with our findings suggesting that NLY01 site of action is microglia since the GLP-1R agonist, Exendin-4 prevents the activation of microglia both in vitro and in vivo following a variety of injury paradigms11,27-32. There is one report that Exendin-4 does not prevent the activation of microglia in vitro and in vivo following stimulation with lipopolysaccharide (LPS)33. What accounts for the variance of this report with our findings and others is not clear, but it may be due to methodological issues.
GLP-1R agonists are protective in models of stroke, traumatic brain injury (TBI), AD, and the MPTP intoxication model of PD4,5,8,12,13. Importantly, the GLP-1R agonist, Exendin-4 may have a disease modifying effect in PD4,13. The protective effects of GLP-1R agonists have been postulated to involve an insulinotrophic effect, activation of Akt, inhibition of microglial activation, beneficial effects on mitochondrial function through induction of PGC-1α, enhancement of neurogenesis or increased production of trophic factors30,34,35. Our results here provide evidence that GLP-1R agonist inhibition of microglia is the primary site of action. Interestingly, in the α-syn PFF model of sporadic PD and in the hA53T Tg mouse model, activated microglia express key factors that are responsible for the conversion of astrocytes to toxic A1 astrocytes1. This is consistent with what is observed in human postmortem PD brain2. NYL01 blocks the microglial activation and the generation of A1 astrocytes. Because of this, NLY01 may have broad neuroprotective properties in a variety of neurodegenerative disorders and neurologic injuries characterized and involving A1 astrocyte activation2.
ONLINE METHODS
Detailed information on experimental design and reagents can be found in Life Sciences Reporting Summary that accompanies this paper.
Animal models
All experimental procedures were according to the guidelines of Laboratory Animal Manual of the National Institute of Health Guide to the Care and Use of Animals, which were approved by the Johns Hopkins Medical Institute Animal Care and Use Committee. The PK studies in cynomolgus monkeys were approved by the Institutional Animal Care and Use Committee of Korea Institute of Toxicology (KIT, study plan JN13002) and performed at KIT, Daejeon, Republic of Korea. (1) Mouse strain for stereotaxic α-syn PFF injection. C57BL6 mice were obtained from the Jackson Laboratories (ME, USA). The mice do not develop any autoimmune or inflammatory phenotype. NLY01 (3 mg/kg) two times per week was subcutaneously administered one month after α-syn PFF stereotaxic injection until five months. (2) hA53T α-synuclein transgenic mice. hA53T α-synuclein transgenic mice were obtained from the Jackson Laboratories (B6; Prnp-SNCA*A53T)16. NLY01 (3 mg/kg) two times per week was subcutaneously administered to six-months-old hA53T α-synuclein transgenic mice until ten-months of age or until death. (3) Toll like receptor 2 (TLR-2) knockout mice. TLR-2 KO mice were obtained from the Jackson Laboratories (B6; 129-Tlr2 tm1kir/J).
α-Synuclein purification and α-syn preformed fibril (PFF) preparation
Recombinant mouse α-synuclein proteins were purified as previously described with IPTG independent inducible pRK172 vector system15,36. Endotoxin was depleted by ToxinEraser endotoxin removal kit (Genscript). α-Syn PFF (5 mg/ml) was prepared in PBS to by stirring with a magnetic stirrer (1,000 rpm at 37° C). After a week incubation of the α-synuclein protein, aggregates were diluted to 0.1 mg/ml with PBS and sonicated for 30 sec (0.5 sec pulse on/off) at 10% amplitude (Branson Digital sonifier, Danbury, CT, USA). α-Syn PFF was validated via atomic force microscopy (AFM) and transmission electron microscopy (TEM) and the ability to induce phospho-serine 129 α-synuclein (p-α-synser129) immunostaining15,19. α-Syn PFF was stored at -80˚ C until used.
Preparation of NLY01
NLY01 is pegylated [Cys40]Exendin-4 and is generously provided by Neuraly Inc. NLY01 was synthesized as described in our previous papers37,38 and the corresponding amino acid sequence is His-Gly-Glu-Gly-Thr-Phe-Thr-Ser-Asp-Leu-Ser-Lys-Gln-Met-Glu-Glu-Glu-Ala-Val-Arg-Leu-Phe-Ile-Glu-Trp-Leu-Lys-Asn-Gly-Gly-Pro-Ser-Ser-Gly-Ala-Pro-Pro-Pro-Ser-Cys(PEG50K)-NH2.
Characterization of NLY01
(1) HPLC analysis. NLY01 purified by preparative RP-HPLC was analyzed by using a Dionex Ultimate 3000 HPLC system (Sunnyvale, CA, USA) with a Phenomenex Gemini RP-18 column (250 × 4.6 mm, 5 μm) at ambient temperature and a constant flow-rate of 1.0 mL/min under UV monitoring at 280 nm. The mobile phase consisted of 0.1% (trifluoracetic acid (TFA) in deionized water (eluent A) and acetonitrile (AN) containing 0.1% TFA (eluent B), and these were applied as linear gradients from 30% B to 60% B over 20 min. (2) MALDI-TOF mass spectrometry. Molecular weight of NLY01 was determined by a Bruker Daltonics Microflex MALDI-TOF mass spectrometer (Bremen, Germany) with a 337 nm nitrogen laser. Mass spectrum was obtained in the linear and positive-ion mode with an acceleration voltage of 20 kV. As a matrix solution, a saturated solution of sinapinic acid in acetonitrile:water (50:50, v:v) containing 0.1% TFA was used. Each analyte was mixed with a matrix solution at a ratio of 1:1 (analyte:matrix, v:v) and 1 μl of the analyte-matrix solution was applied and air-dried on the sample plate.
Stereotaxic α-syn PFF injection
For stereotaxic injection of α-syn PFF, three-month-old male and female mice were anesthetized with xylazene and ketamine. An injection cannula (26.5 gauge) was applied stereotaxically into the striatum (mediolateral, 2.0 mm from bregma; anteroposterior, 0.2 mm; dorsoventral, 2.6 mm) unilaterally (applied into the right hemisphere). The infusion was performed at a rate of 0.2 μl per min, and 2 μl of α-syn PFF (2.5 μg/μl in PBS) or same volume PBS were injected into mouse.
Behavioral tests
To evaluate α-syn PFF-induced behavioral deficits, PBS and α-syn PFF injected mice were assessed by pole test, rotarod test, cylinder test and the amphetamine induced stereotypic rotation test 2 weeks prior to sacrifice. The experimenter was blinded to treatment group for all behavioral studies. All tests were recorded and performed between 10:00-16:00 in the lights-on cycle. (1) Amphetamine induced stereotypic rotation test. Six months after mice received the α-syn PFF injection into the right hemisphere with or without NLY01 treatment; 5 mg/kg amphetamine (Sigma-Aldrich) was intraperitoneally administered to the mice. Mice were placed in a white paper cylinder of 20 cm diameter and monitored for 30 min. The behavior of the mice was filmed at three one-minute intervals between 20 and 30 min following amphetamine administration. Full body ipsilateral rotations (clockwise) during the one minute session were counted for each mouse from the video recordings. (2) Pole test. Mice were acclimatized in the behavioral procedure room for 30 min. The pole was made of a 75 cm metal rod with a diameter of 9 mm. It was wrapped with bandage gauze39. Mice were placed on the top of the pole (7.5 cm from the top of the pole) facing head-up. The total time taken to reach the base of the pole was recorded. Before the actual test, mice were trained for two consecutive days. Each training session consisted of three test trials. On the test day, mice were evaluated in three sessions and the total time was recorded. The maximum cutoff time to stop the test and recording was 60 sec. Results for turn down, climb down, and total time (in sec) were recorded. (3) Rotarod test. For the rotarod test, mice were placed on an accelerating rotarod cylinder, and the time the animals remained on the rotarod was measured. The speed was slowly increased from 4 to 40 rpm within 5 min. A trial ended if the animal fell off the rungs or gripped the device and spun around for 2 consecutive revolutions without attempting to walk on the rungs. The animals were trained 3 days before test. Motor test data are presented as the percentage of the mean duration (3 trials) on the rotarod compared with the control. (4) Cylinder test. Spontaneous movement was measured by placing animals in a small transparent cylinder (height, 15.5 cm; diameter, 12.7 cm). Spontaneous activity was recorded for 10 min. The number of forepaw touches, rears and grooming were measured. Recorded files were viewed and rated in slow motion by an experimenter blinded to the mouse type and NLY01 treatment.
Immunohistochemistry and quantitative analysis
Immunohistochemistry (IHC) was performed on 30 μm thick serial brain sections. Primary antibodies and working dilutions are detailed in Supplementary Table 5. TH, Nissl, p-α-synser129 experimental procedures and quantitative analysis were performed as previously described39,40. Microglia and astrocytes from the SNpc region were stained with anti-Iba-1 (Wako, St. Louis, MO, USA) or anti-GFAP (Dako, Santa Clara, CA, USA) antibodies, followed by incubation with biotin-conjugated anti-rabbit antibody and ABC reagents. Sections were developed using SigmaFast DAB Peroxidase Substrate (Sigma-Aldrich). The number of microglia and densities of astrocytes in the SNpc region were measured with ImageJ software.
Immunofluorescence analysis
Immunofluorescence was performed on 30 μm thick serial brain sections. Primary antibodies and working dilutions are detailed in Supplementary Table 5. For histological studies, immunofluorescence in tissue sections was performed as described previously15.
Tissue and cell lysate preparation
Tissue lysates were prepared as described previously with some modifications15. Nonionic detergent-soluble and -insoluble fractions were made by homogenization of tissue in brain lysis buffer [10 mM Tris-HCl, pH 7.4, 150 mM NaCl, 5 mM EDTA, 0.5% Nonidet P-40, phosphatase inhibitor cocktail II and III (Sigma-Aldrich), and complete protease inhibitor mixture]. The homogenate was centrifuged at 22,000 x g for 20 min, and the resulting pellet (P1) and supernatant (S1, soluble part) fractions were collected. The P1 was washed once in brain lysis buffer containing nonionic detergent (0.5% Nonidet P-40) and the resulting pellet (P2, nonionic detergent insoluble) was homogenized in brain lysis buffer containing 1% SDS and 0.5% sodiumdeoxycholate. The homogenate was centrifuged and the resulting supernatant (nonionic detergent-insoluble) was collected. Total lysates were prepared by homogenization of tissue in RIPA buffer [50 mM Tris, pH 8.0, 150 mM NaCl, 1% Nonidet P-40, 1% SDS, 0.5% sodium-deoxycholate, phosphatase inhibitor cocktail II and III (Sigma-Aldrich), and complete protease inhibitor mixture]. The homogenate was centrifuged at 22,000 x g for 20 min, and the resulting supernatant (insoluble part) was collected.
Immunoblot analysis
Mouse brain tissues and primary neurons were homogenized and prepared in lysis buffer. Primary antibodies and working dilutions are detailed in Supplementary Table 5. Immunoblots of tissue and neuronal culture was performed as described previously15. All raw blot and gel images are available in Supplementary Figures 21 and 22.
Measurement of NLY01 accumulation in brain
The day after the PBS or NLY01 (3 mg/kg) injection in twelve-month-old WT and hA53T α-synuclein Tg mice, the levels of NLY01 in the brain were measured using a Exendin-4 (Heloderma suspectum)–EIA Kit (Phoenix pharmaceuticals, INC, Burlingame, CA, USA), according to the manufacturer’s instructions.
Monoamine analysis
High performance liquid chromatography with electrochemical detection (HPLC-ECD) was performed to measure biogenic anime concentrations as described previously39.
Differentiation of ESC into DA neurons
The H9 human embryonic stem cells (ESCs) were differentiated into DA neurons following a DA neuron induction protocol41. All experiments using human stem cells were monitored and approved by the JHU Institutional Stem Cell Research Oversight Committee.
Human postmortem brain tissues
This research uses anonymous autopsy material, substantia nigra from subjects with PD (n=10) and related disorders and controls (n=10) from the Division of Neuropathology, Department of Pathology of Johns Hopkins University School of Medicine. The John Hopkins Medical Institutions (JHMI) Joint Committee on Clinical Investigations decided that these studies are exempt from Human Subjects Approval because of Federal Register 46.101 Exemption Number 4. PD was confirmed by pathological and clinical criteria (Supplementary Table 2). Glp1r mRNA levels were monitored in human postmortem substantia nigra brain tissue from Parkinson’s disease patients and controls (Supplementary Figure 3a).
Primary neuron, microglia and astrocyte cell cultures
CD1 mice were obtained from Jackson Laboratories (Bar Harbor, ME). Primary cortical neurons were prepared from E15.5 pups and cultured in Neurobasal media (Gibco) supplemented with B-27, 0.5 mM L-glutamine, penicillin and streptomycin (Invitrogen, Grand Island, NY) on tissue culture plates coated with poly-L-lysine. The neurons were maintained by changing medium every 3–4 days. Primary microglial and astrocyte cultures were performed as described previously42. Whole brains from mouse pups at postnatal day age 1 (P1) were obtained. After removal of the meninges the brains were washed in DMEM/F12 (Gibco) supplemented with 10% heat-inactivated FBS, 50 U/mL penicillin, 50 μg/mL streptomycin, 2 mM L-glutamine, 100 μM non-essential amino acids, and 2 mM sodium pyruvate (DMEM-F12 complete medium) three times. The brains were transferred to 0.25% Trypsin-EDTA followed by 10 min of gentle agitation. DMEM-F12 complete medium was used to stop the trypsinization. The brains were washed three times in this medium again. A single cell suspension was obtained by trituration. Cell debris and aggregates were removed by passing the single cell suspension through a 100 μm nylon mesh. The final single cell suspension thus achieved was cultured in T-75 flasks for 13 days, with a complete medium change on day 6. The mixed glial cell population was separated into astrocyte rich and microglia rich fractions using the EasySep Mouse CD11b Positive Selection Kit (StemCell). The magnetically separated fraction containing microglia and the pour-off fraction containing astrocytes were cultured separately. The conditioned medium from the primary microglia treated with α-syn PFF (α-syn PFF-MCM) with either PBS or NLY01 treatment were collected and applied to primary astrocytes for 24 hrs. The conditioned medium from activated astrocyte by α-syn PFF-MCM, which defined as α-syn PFF-ACM, were collected with complete, Mini, EDTA-free Protease Inhibitor Cocktail (Sigma) and concentrated with Amicon Ultra-15 centrifugal filter unit (10 kDa cutoff) (Millipore) until approximately 50 X concentrated. The total protein concentration was determined using Pierce BCA protein assay kit (Thermo Scientific), and 15 or 50 μg/ml of total protein was added to murine primary neurons or human dopaminergic neuron, respectively, for neuronal cell death assay.
pLentiCRISPR GLP-1R KO microglia
The sgRNAs targeting GLP-1R (KO1, 5′-CCAGGAGTGGCGCTTCCGTG-3′; KO2, 5′-TCGTGAATGTCAGCTGCCCC-3′) were subcloned into a pLentiCRISPR vector (Addgene) and lentivirus was generated as previously described43. Microglia were transduced and GLP-1R levels were assessed by immunoblot.
Comparative quantitative real time PCR (qPCR)
Total RNA from cultured cells was extracted with a RNA isolation kit (Qiagen, CA) following the instruction provided by the company. RNA concentration was measured spectrophotometrically using NanoDrop 2000 (Biotek, Winooski, VT). 1-2 μg of total RNA were reverse-transcribed to cDNA using the High-Capacity cDNA Reverse Transcription System (Life Technologies, Grand Island, NY). Comparative quantitative RT-PCR (qPCR) was performed in duplicate or triplicate for each sample using fast SYBR Green Master Mix (Life Technologies) and ViiA 7 Real-Time PCR System (Applied Biosystems, Foster City, CA). The expression levels of target genes were normalized to the expression of β-actin and calculated based on the comparative cycle threshold Ct method (2−ΔΔCt). Name and sequences of primers are summarized in Supplementary Table 6.
Enzyme linked immunosorbent assay (ELISA) analysis
The secreted cytokines from primary microglia 18 hrs after α-syn PFF with either PBS or NLY01 treatment were screened using a mouse cytokine ELISA plate array (Signosis, Santa Clara, CA) according to the manufacturer instructions.
Cell viability analysis
Cell viability was tested via four methods: (1) Propidium iodide staining. Primary cultured cortical neurons were treated either with α-syn PFF-ACM or NLY01-α-syn PFF-ACM for 24 h. Cell viability was determined by an unbiased objective computer-assisted cell counting after staining of all nuclei with 7 μM Hoechst 33342 (Invitrogen) and dead cell nuclei with 2 μM propidium iodide (Invitrogen)44. The numbers of total and dead cells were counted with the Axiovision 4.3 software (Carl Zeiss). The percentage of cell death was determined as the ratio of live to dead cells as compared with the percentage of cell death in control wells to account for cell death attributed to mechanical stimulation of the cultures. (2-3) The alamarBlue and LDH assay. Cell death was assessed through alamarBlue assay (Invitrogen), according to the manufacturer’s protocol. LDH (Sigma) activity in culture medium, representing relative cell viability and membrane integrity, was measured using the LDH assay kit spectrophotometrically, following the manufacturer’s instructions. (4) Trypan Blue live cell counting. Neurons were dissociated into a single-cell suspension using trypsin. Mixtures of suspended cell and the trypan blue solution were (1:1) immediately put in the live cell counter (Countess™, Invitrogen), and the number of living cells and dead cells was measured. Three wells were assayed for each condition.
PK profile of NLY01 in cynomolgus monkeys and mice
The PK studies in cynomolgus monkeys were approved by the Institutional Animal Care and Use Committee of Korea Institute of Toxicology (KIT, study plan JN13002) and performed at KIT, Daejeon, Republic of Korea. Cynomolgus monkeys (Macaca fascicularis), 4-5 years old, male, 3-5 kg. The PK profile of NLY01 was evaluated in cynomolgus monkeys and compared to free [Cys40]Exendin-4. Monkeys were given a single subcutaneous injection of equimolar doses of NLY01 or [Cys40]Exendin-4 (32 μg/kg, n=2). In addition, the PK profile of NLY01 (1 mg/kg, a single subcutaneous injection) was studied in C57BL/6 mice (3 mice were used at each time point). Peptide levels were measured by a exenind-4 EIA kit (Phoenix Pharmaceuticals Inc.) in plasma samples collected at various time points. The PK parameters were calculated by non-compartmental analysis using WinNonlin software (Phasight Corporation, Mountain View, CA, USA).
In vitro biological activity of NLY01
GLP-1R transfected HEK-293/CRE-LUC/GLP1R cells (GenScript, Piscataway, NJ, USA) were treated with serial dilutions of [Cys40]Exendin-4 and NLY01 at the indicated concentrations. After 2 hrs of incubation intracellular cAMP levels were measured. Both GLP-1R transfected cells and cAMP detection reagents are part of the intracellular cAMP human recombinant GLP-1R stable cell line assay (GenScript). Luminescence was measured using SpectraMax M5 plate reader. The data were analyzed using 4 parameter logistic fit model using Prizm software.
Blood glucose level
The hypoglycemic effects of peptides were investigated in age-matched WT and hA53T Tg mice (10-month old). Under non-fasting conditions with free access to food and water, mice were subcutaneously treated with PBS and NLY01 (n=3, 3 mg/kg). A drop of blood was drawn from a tail vein of each animal at predetermined time points and blood glucose levels were measured using a one-touch blood glucose meter (ACCU-CHEK Sensor, Roche Diagnostics Corp., USA).
Injection of the Fluorescent Tracers for blood-brain barrier (BBB)
Fluorescein isothiocyanate-labeled dextran (FITC-dextran, molecular weights; 3kD, Sigma) and Rhodamine-labeled dextran (Rh-dextran, molecular weights; 2,000kD, Sigma) were used as gold standard for the evaluation of BBB permeability and disruption. The WT and hA53T α-syn Tg nice were intravenously injected with mixture of FITC-dextran and Rh-dextran in the tail vein, which circulated for 1 hr. After 1 hr, the mice were scarified, their brains were quickly removed.
Statistics
All data were analyzed using GraphPad Prism 6 software. PK parameters were calculated by non-compartmental analysis using WinNonlin software (Phasight Corporation, Mountain View, CA, USA). Statistics Data were presented as mean ± S.E.M. with at least 3 biologically independent experiments. Representative morphological images were taken from at least 3 biologically independent experiments with similar results. An unpaired two-tailed Student’s test or a two-way ANOVA test followed by Tukey’s multiple comparisons test to assess the statistical significance. Assessments with p < 0.05 were considered significant.
Data availability statement
The data that support the findings of this study are available from the corresponding author upon reasonable request.
Supplementary Material
Acknowledgments
All relevant ethical regulations were followed. This work was supported by grants from the NIH/NINDS NS38377 (H.S.K., V.L.D. and T.M.D.), NIH/NINDS NS082205 and NS098006 (H.S.K.), Maryland Stem Cell Research Foundation 2012-MSCRFE-0059 (H.S.K.), the JPB Foundation (T.M.D.), NIH/National Institute on Aging grant 1K01AG056841-01(X.M.), the American Parkinson Disease Association (APDA) Research Grant Awards (X.M.), and the National Research Foundation of Korea NRF-2016R1D1A1B03934847 (D.H.N). The authors acknowledge the joint participation by the Adrienne Helis Malvin Medical Research Foundation and the Diana Helis Henry Medical Research Foundation through their direct engagement in the continuous active conduct of medical research in conjunction with The Johns Hopkins Hospital and the Johns Hopkins University School of Medicine and the Foundation’s Parkinson’s Disease Programs M-1 (T.M.D, V.L.D.), M-2 (T.M.D. V.L.D.), H-2014 (T.M.D), M-2014 (H.S.K., T.M.D., V.L.D.), H-1 (H.S.K.), H-2013 (H.S.K.). T.M.D. is the Leonard and Madlyn Abramson Professor in Neurodegenerative Diseases. We thank Neuraly Inc. for providing NLY01.
Footnotes
Author Contributions
S.P.Y., and T.-I.K. designed majority of the experiments, performed the experiments, analyzed data, and wrote the manuscript. N.P., S.M.K., Y.O., J.-S.P., S.-H.K., S.-U.K., and D.K. performed experiments, and data interpretation. Y.J.P. injected NLY01 into mice. S.S.K. performed HPLC analysis. H.P., S.K., N.O., N.A.K., S.L., J.H.L., M.K., and D.A., performed sample preparation, and helped experiments. S.B., and X.M. provided and managed mice and PFF, and helped data interpretation. K.C.L., and D.H.N. provided and made NLY01. V.V.R performed mouse PK experiment, and data analysis. Y.L., S.H.L., S.A.L., and B.A.B. preformed manuscript writing, review and editing. Z.M provided human postmortem brain samples. V.L.D., S.L., T.M.D., and H.S.K. supervised project, formulated the hypothesis, designed experiments, analyzed data and wrote the manuscript.
Competing financial Interests Statement
Z.M., V.L.D., S.L., T.M.D., H.S.K are co-founders of Neuraly Inc. and hold ownership equity in the company. This arrangement has been reviewed and approved by the Johns Hopkins University in accordance with its conflict of interest policies. V.V.R. is the CSO of Neuraly Inc.
References
- 1.Liddelow SA, Barres BA. Reactive Astrocytes: Production, Function, and Therapeutic Potential. Immunity. 2017;46:957–967. doi: 10.1016/j.immuni.2017.06.006. [DOI] [PubMed] [Google Scholar]
- 2.Liddelow SA, et al. Neurotoxic reactive astrocytes are induced by activated microglia. Nature. 2017;541:481–487. doi: 10.1038/nature21029. [DOI] [PMC free article] [PubMed] [Google Scholar]
- 3.Athauda D, Foltynie T. The glucagon-like peptide 1 (GLP) receptor as a therapeutic target in Parkinson’s disease: mechanisms of action. Drug Discov Today. 2016;21:802–818. doi: 10.1016/j.drudis.2016.01.013. [DOI] [PubMed] [Google Scholar]
- 4.Aviles-Olmos I, et al. Exenatide and the treatment of patients with Parkinson’s disease. J Clin Invest. 2013;123:2730–2736. doi: 10.1172/JCI68295. [DOI] [PMC free article] [PubMed] [Google Scholar]
- 5.Chen S, et al. Glucagon-like peptide-1 protects hippocampal neurons against advanced glycation end product-induced tau hyperphosphorylation. Neuroscience. 2014;256:137–146. doi: 10.1016/j.neuroscience.2013.10.038. [DOI] [PubMed] [Google Scholar]
- 6.Harkavyi A, Whitton PS. Glucagon-like peptide 1 receptor stimulation as a means of neuroprotection. Br J Pharmacol. 2010;159:495–501. doi: 10.1111/j.1476-5381.2009.00486.x. [DOI] [PMC free article] [PubMed] [Google Scholar]
- 7.Li Y, et al. Liraglutide is neurotrophic and neuroprotective in neuronal cultures and mitigates mild traumatic brain injury in mice. J Neurochem. 2015;135:1203–1217. doi: 10.1111/jnc.13169. [DOI] [PMC free article] [PubMed] [Google Scholar]
- 8.Li Y, et al. GLP-1 receptor stimulation preserves primary cortical and dopaminergic neurons in cellular and rodent models of stroke and Parkinsonism. Proceedings of the National Academy of Sciences of the United States of America. 2009;106:1285–1290. doi: 10.1073/pnas.0806720106. [DOI] [PMC free article] [PubMed] [Google Scholar]
- 9.Meier JJ. GLP-1 receptor agonists for individualized treatment of type 2 diabetes mellitus. Nat Rev Endocrinol. 2012;8:728–742. doi: 10.1038/nrendo.2012.140. [DOI] [PubMed] [Google Scholar]
- 10.Rachmany L, et al. Exendin-4 induced glucagon-like peptide-1 receptor activation reverses behavioral impairments of mild traumatic brain injury in mice. Age (Dordr) 2013;35:1621–1636. doi: 10.1007/s11357-012-9464-0. [DOI] [PMC free article] [PubMed] [Google Scholar]
- 11.Teramoto S, et al. Exendin-4, a glucagon-like peptide-1 receptor agonist, provides neuroprotection in mice transient focal cerebral ischemia. J Cereb Blood Flow Metab. 2011;31:1696–1705. doi: 10.1038/jcbfm.2011.51. [DOI] [PMC free article] [PubMed] [Google Scholar]
- 12.Tweedie D, et al. Blast traumatic brain injury-induced cognitive deficits are attenuated by preinjury or postinjury treatment with the glucagon-like peptide-1 receptor agonist, exendin-4. Alzheimers Dement. 2016;12:34–48. doi: 10.1016/j.jalz.2015.07.489. [DOI] [PMC free article] [PubMed] [Google Scholar]
- 13.Athauda D, et al. Exenatide once weekly versus placebo in Parkinson’s disease: a randomised, double-blind, placebo-controlled trial. Lancet. 2017;390:1664–1675. doi: 10.1016/S0140-6736(17)31585-4. [DOI] [PMC free article] [PubMed] [Google Scholar]
- 14.Luk KC, et al. Pathological alpha-synuclein transmission initiates Parkinson-like neurodegeneration in nontransgenic mice. Science. 2012;338:949–953. doi: 10.1126/science.1227157. [DOI] [PMC free article] [PubMed] [Google Scholar]
- 15.Mao X, et al. Pathological alpha-synuclein transmission initiated by binding lymphocyte-activation gene 3. Science. 2016;353 doi: 10.1126/science.aah3374. [DOI] [PMC free article] [PubMed] [Google Scholar]
- 16.Lee MK, et al. Human alpha-synuclein-harboring familial Parkinson’s disease-linked Ala-53 –> Thr mutation causes neurodegenerative disease with alpha-synuclein aggregation in transgenic mice. Proceedings of the National Academy of Sciences of the United States of America. 2002;99:8968–8973. doi: 10.1073/pnas.132197599. [DOI] [PMC free article] [PubMed] [Google Scholar]
- 17.Cabezas R, et al. Astrocytic modulation of blood brain barrier: perspectives on Parkinson’s disease. Front Cell Neurosci. 2014;8:211. doi: 10.3389/fncel.2014.00211. [DOI] [PMC free article] [PubMed] [Google Scholar]
- 18.Gray MT, Woulfe JM. Striatal blood-brain barrier permeability in Parkinson’s disease. J Cereb Blood Flow Metab. 2015;35:747–750. doi: 10.1038/jcbfm.2015.32. [DOI] [PMC free article] [PubMed] [Google Scholar]
- 19.Polinski NK, et al. Best Practices for Generating and Using Alpha-Synuclein Pre-Formed Fibrils to Model Parkinson’s Disease in Rodents. J Parkinsons Dis. 2018 doi: 10.3233/JPD-171248. [DOI] [PMC free article] [PubMed] [Google Scholar]
- 20.Brahmachari S, et al. Activation of tyrosine kinase c-Abl contributes to alpha-synuclein-induced neurodegeneration. J Clin Invest. 2016;126:2970–2988. doi: 10.1172/JCI85456. [DOI] [PMC free article] [PubMed] [Google Scholar]
- 21.Zhang Y, et al. An RNA-sequencing transcriptome and splicing database of glia, neurons, and vascular cells of the cerebral cortex. J Neurosci. 2014;34:11929–11947. doi: 10.1523/JNEUROSCI.1860-14.2014. [DOI] [PMC free article] [PubMed] [Google Scholar]
- 22.Kim C, Lee HJ, Masliah E, Lee SJ. Non-cell-autonomous Neurotoxicity of alpha-synuclein Through Microglial Toll-like Receptor 2. Exp Neurobiol. 2016;25:113–119. doi: 10.5607/en.2016.25.3.113. [DOI] [PMC free article] [PubMed] [Google Scholar]
- 23.Daher JP, et al. Neurodegenerative phenotypes in an A53T alpha-synuclein transgenic mouse model are independent of LRRK2. Hum Mol Genet. 2012;21:2420–2431. doi: 10.1093/hmg/dds057. [DOI] [PMC free article] [PubMed] [Google Scholar]
- 24.Harms AS, et al. Peripheral monocyte entry is required for alpha-Synuclein induced inflammation and Neurodegeneration in a model of Parkinson disease. Experimental neurology. 2018;300:179–187. doi: 10.1016/j.expneurol.2017.11.010. [DOI] [PMC free article] [PubMed] [Google Scholar]
- 25.Martinez FO, Gordon S. The M1 and M2 paradigm of macrophage activation: time for reassessment. F1000Prime Rep. 2014;6:13. doi: 10.12703/P6-13. [DOI] [PMC free article] [PubMed] [Google Scholar]
- 26.Allen Reish HE, Standaert DG. Role of alpha-synuclein in inducing innate and adaptive immunity in Parkinson disease. J Parkinsons Dis. 2015;5:1–19. doi: 10.3233/JPD-140491. [DOI] [PMC free article] [PubMed] [Google Scholar]
- 27.Goncalves A, et al. Protective Effect of a GLP-1 Analog on Ischemia-Reperfusion Induced Blood-Retinal Barrier Breakdown and Inflammation. Invest Ophthalmol Vis Sci. 2016;57:2584–2592. doi: 10.1167/iovs.15-19006. [DOI] [PMC free article] [PubMed] [Google Scholar]
- 28.Gullo F, et al. Plant Polyphenols and Exendin-4 Prevent Hyperactivity and TNF-alpha Release in LPS-Treated In vitro Neuron/Astrocyte/Microglial Networks. Front Neurosci. 2017;11:500. doi: 10.3389/fnins.2017.00500. [DOI] [PMC free article] [PubMed] [Google Scholar]
- 29.Kim S, Moon M, Park S. Exendin-4 protects dopaminergic neurons by inhibition of microglial activation and matrix metalloproteinase-3 expression in an animal model of Parkinson’s disease. J Endocrinol. 2009;202:431–439. doi: 10.1677/JOE-09-0132. [DOI] [PubMed] [Google Scholar]
- 30.Lee CH, et al. Activation of Glucagon-Like Peptide-1 Receptor Promotes Neuroprotection in Experimental Autoimmune Encephalomyelitis by Reducing Neuroinflammatory Responses. Mol Neurobiol. 2017 doi: 10.1007/s12035-017-0550-2. [DOI] [PubMed] [Google Scholar]
- 31.Li Y, et al. Exendin-4 ameliorates motor neuron degeneration in cellular and animal models of amyotrophic lateral sclerosis. PLoS One. 2012;7:e32008. doi: 10.1371/journal.pone.0032008. [DOI] [PMC free article] [PubMed] [Google Scholar]
- 32.Wu HY, Tang XQ, Liu H, Mao XF, Wang YX. Both classic Gs-cAMP/PKA/CREB and alternative Gs-cAMP/PKA/p38beta/CREB signal pathways mediate exenatide-stimulated expression of M2 microglial markers. J Neuroimmunol. 2017 doi: 10.1016/j.jneuroim.2017.12.005. [DOI] [PubMed] [Google Scholar]
- 33.Ventorp F, et al. Exendin-4 Treatment Improves LPS-Induced Depressive-Like Behavior Without Affecting Pro-Inflammatory Cytokines. J Parkinsons Dis. 2017;7:263–273. doi: 10.3233/JPD-171068. [DOI] [PMC free article] [PubMed] [Google Scholar]
- 34.Ji C, et al. A novel dual GLP-1 and GIP receptor agonist is neuroprotective in the MPTP mouse model of Parkinson’s disease by increasing expression of BNDF. Brain Res. 2016;1634:1–11. doi: 10.1016/j.brainres.2015.09.035. [DOI] [PubMed] [Google Scholar]
- 35.Salcedo I, Tweedie D, Li Y, Greig NH. Neuroprotective and neurotrophic actions of glucagon-like peptide-1: an emerging opportunity to treat neurodegenerative and cerebrovascular disorders. Br J Pharmacol. 2012;166:1586–1599. doi: 10.1111/j.1476-5381.2012.01971.x. [DOI] [PMC free article] [PubMed] [Google Scholar]
- 36.Volpicelli-Daley LA, Luk KC, Lee VM. Addition of exogenous alpha-synuclein preformed fibrils to primary neuronal cultures to seed recruitment of endogenous alpha-synuclein to Lewy body and Lewy neurite-like aggregates. Nat Protoc. 2014;9:2135–2146. doi: 10.1038/nprot.2014.143. [DOI] [PMC free article] [PubMed] [Google Scholar]
- 37.Kim TH, et al. Mono-PEGylated dimeric exendin-4 as high receptor binding and long-acting conjugates for type 2 anti-diabetes therapeutics. Bioconjug Chem. 2011;22:625–632. doi: 10.1021/bc100404x. [DOI] [PubMed] [Google Scholar]
- 38.Kim TH, et al. Site-specific PEGylated Exendin-4 modified with a high molecular weight trimeric PEG reduces steric hindrance and increases type 2 antidiabetic therapeutic effects. Bioconjug Chem. 2012;23:2214–2220. doi: 10.1021/bc300265n. [DOI] [PubMed] [Google Scholar]
- 39.Karuppagounder SS, et al. The c-Abl inhibitor, nilotinib, protects dopaminergic neurons in a preclinical animal model of Parkinson’s disease. Sci Rep. 2014;4:4874. doi: 10.1038/srep04874. [DOI] [PMC free article] [PubMed] [Google Scholar]
- 40.Lee Y, et al. Parthanatos mediates AIMP2-activated age-dependent dopaminergic neuronal loss. Nat Neurosci. 2013;16:1392–1400. doi: 10.1038/nn.3500. [DOI] [PMC free article] [PubMed] [Google Scholar]
- 41.Kim S, et al. GBA1 deficiency negatively affects physiological alpha-synuclein tetramers and related multimers. Proceedings of the National Academy of Sciences of the United States of America. 2018;115:798–803. doi: 10.1073/pnas.1700465115. [DOI] [PMC free article] [PubMed] [Google Scholar]
- 42.Panicker N, et al. Fyn Kinase Regulates Microglial Neuroinflammatory Responses in Cell Culture and Animal Models of Parkinson’s Disease. J Neurosci. 2015;35:10058–10077. doi: 10.1523/JNEUROSCI.0302-15.2015. [DOI] [PMC free article] [PubMed] [Google Scholar]
- 43.Andrabi SA, et al. Iduna protects the brain from glutamate excitotoxicity and stroke by interfering with poly(ADP-ribose) polymer-induced cell death. Nat Med. 2011;17:692–699. doi: 10.1038/nm.2387. [DOI] [PMC free article] [PubMed] [Google Scholar]
- 44.Wang Y, et al. A nuclease that mediates cell death induced by DNA damage and poly(ADP-ribose) polymerase-1. Science. 2016;354 doi: 10.1126/science.aad6872. [DOI] [PMC free article] [PubMed] [Google Scholar]
Associated Data
This section collects any data citations, data availability statements, or supplementary materials included in this article.
Supplementary Materials
Data Availability Statement
The data that support the findings of this study are available from the corresponding author upon reasonable request.