Abstract
Despite the growing clinical interest in the tricuspid valve (TV), there is an incomplete understanding of TV biomechanics which is important in normal TV function and successful TV repair techniques. Computational models with patient-specific human TV geometries can provide a quantitative understanding of TV biomechanic. Therefore, this study aimed to develop finite element (FE) models of human TVs from multi-slice computed tomography (MSCT) images to investigate chordal forces and leaflet stresses and strains. Three FE models were constructed for human subjects with healthy TVs from MSCT images and incorporated detailed leaflet geometries, realistic nonlinear anisotropic hyperelastic material properties of human TV, and physiological boundary conditions tracked from MSCT images. TV closure from diastole to systole was simulated. Chordal lengths were iteratively adjusted until the simulated TV geometries were in good agreement with the “true” geometries reconstructed from MSCT images at systole. Larger chordal forces were found on the strut (or basal) chords than on the rough zone chords and the total forces applied on the anterior papillary muscles by the strut chords were higher than those on the posterior or septal papillary muscles. At peak systolic pressure, the average maximum stress on the middle sections of the leaflets ranged from 30–90 kPa, while the average maximum principal strain values ranged from 0.16 to 0.30. The results from healthy TVs can serve as baseline biomechanical metrics of TV mechanics and may be used to inform TV repair device design. The computational approach developed could be one step towards developing computational models that may support pre-operative planning in complex TV repair procedures in the future.
Keywords: Multi-slice computed tomography, Tricuspid Valve, Finite Element Analysis, Patient-specific Geometries, Biomechanics
1. INTRODUCTION
The tricuspid valve (TV) sits between the ventricle and the atrium on the right side of the heart. Similar to the mitral valve on the left side of the heart, the tricuspid valve consists of complex subvalvular structures: the annulus, the anterior, posterior, and septal leaflets, the chordae tendinae, and the papillary muscles. The tricuspid annulus forms a 3-dimensional structure that is less symmetric than the mitral annulus, where the posteroseptal portion is the lowest (toward the apex), and the anteroseptal portion is the highest 4. The three leaflets are hinged on the annulus and attach to the papillary muscles via the chordae. There are most commonly three papillary muscles, namely, the anterior, medial, and septal papillary muscles, but in many cases, in place of the septal papillary muscle, there is a cluster of smaller, less distinct, muscles as compared to the other two 39. The TV anatomy can vary greatly between patients. Proper TV function is dependent on each of these structures working harmoniously together.
TV function can be impaired by a number of different pathologies affecting one or more components of the TV apparatus, or even the pulmonary valve or the left heart. In Western society tricuspid regurgitation (TR) is the most common form of TV disease, which often develops secondary to dilation of the tricuspid annulus and right ventricle. The current prevalence of moderate to severe TR in the United States is estimated to be 1.6 million 32, and the prevalence of TR in patients with left heart diseases, such as mitral valve regurgitation and left heart failure, is about 50% 27. If left untreated, TR could lead to increased risk of mortality, prolonged hospitalization, and heart failure 2, 21, 25. Surgical ring annuloplasty is an effective treatment for TR and currently preferred over TV replacement for improved long-term survival and low risk 28. However, operative mortality rates are high in these high-risk patients ( about 10–20%) leaving them with limited treatment options 27.
The growing recognition of the importance of TV diseases and treatments, and the explosive growth of transcatheter heart valve therapies, has generated enormous interest in developing minimally invasive treatments for TV disease. There are many devices for transcatheter tricuspid valve (TTV) repair under development, most notably, the Trialign system (Mitralign, Inc.), TriCinch system (4Tech Cardio Ltd.), and Cardioband system (Edwards Lifesciences) transcatheter annuloplasty systems, and the MitraClip (Abbott Vascular) leafletplasty system which has proven efficacy in the mitral position 19. However, clinical data with these devices are scarce: only a few feasibility studies have been conducted in a small number of patients 3, 12, 19, 26, 38. TTV treatments face serious challenges due to the complex geometry and function of the tricuspid apparatus, as well as the fragile, non-calcified TV tissues. Clinicians have noted that the key to developing TTV techniques and correctly selecting patients who will benefit from them, is accurate knowledge of the TV and right heart anatomy, the dimensions of the caval vein and the course of the right coronary artery in relation to the atrioventricular groove, as well as the severity and mechanisms of TV disease 35. However, even with advanced imaging techniques, the TTV biomechanics necessary to predict the post-TTV anatomy and function are still missing.
As compared to the mitral valve, little has been done to quantify the biomechanics of the TV apparatus. There have been a few ex vivo studies that have looked into the mechanical properties of the tricuspid leaflets 1, 23, 30 and chordae tendineae 15, as well as annular 11 and chordae forces 34; however, the majority of these studies 1, 11, 30, 34 were conducted on porcine tissues which may differ from human, considered components of the TV apparatus individually 1, 15, 23, 30, and lacked realistic in vivo loading conditions 1, 11, 15, 23, 30, 34. Computational models have proven to be useful in understanding the in vivo biomechanics of the normal and pathological mitral valve 22, 37 and mitral valve repair procedures 20. Yet, to the authors’ best knowledge, only one computational model has been developed to study the mechanical behavior of the TV. Stevanella et al. 31 developed a finite element (FE) model of the tricuspid valve utilizing idealized geometries for the tricuspid leaflets and chordae based on experimental measurements, and assumed material properties based on mitral leaflet experiments. As the geometry, material properties, and boundary conditions are the three inputs to any FE analysis, realistic TV geometry, material properties, and boundary conditions, are essential for accurate simulation results.
Therefore, in this study, FE models with patient-specific geometries of the healthy TV were developed. Three patient-specific TV models were constructed from multi-slice computed tomography (MSCT) scans at middle diastole. Tricuspid leaflet material properties were defined by an anisotropic hyperelastic material model which was fitted to biaxial test data for the human tricuspid valve tissues 23. TV deformation under physiological transvavular pressure was simulated. Chordal forces and in vivo stresses and strains of the TV leaflets were obtained.
2. METHOD
2.1 FE model generation
Patient information
Full-phase cardiac MSCT scans for a 69-year-old female patient, a 37-year-old female patient, and a 59-year-old female patient, were obtained from Hartford Hospital (Hartford, CT). Institutional Review Broad (IRB) approval to review de-identified images was obtained. All patients underwent MSCT scans because of suspected coronary artery disease (CAD). No CT exams were ordered for evaluation of cardiac valves. Data set obtained in this fashion covered the entire heart and included all phases of the cardiac cycle. The exam images were used for retrospective analysis in this study. Patients with normal TV function were selected in this study.
CT images
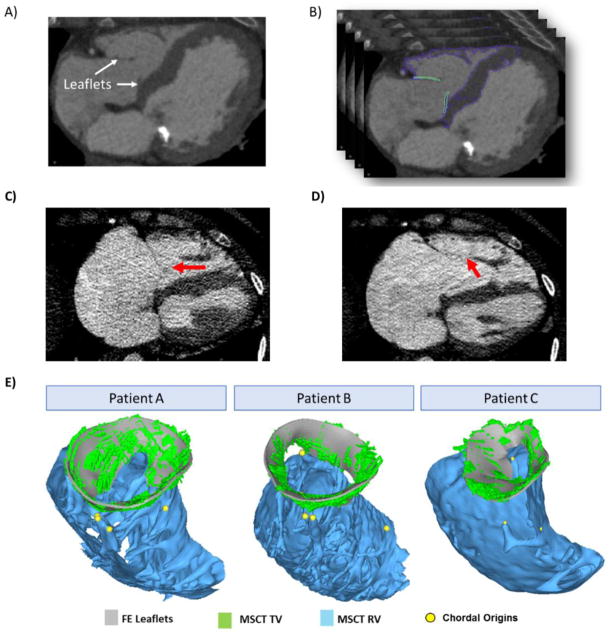
Full-volume CT image data with ECG gating were acquired with a GE LightSpeed 64-channel volume CT scanner, with a collimation of 25–30 × 0.625 mm. The rotation time of 375 ms resulted in a temporal resolution of less than 200 ms depending on the heart rate and pitch. In general, for each patient, a total of approximately 2,000 image slices were collected and were reconstructed into 10 phases throughout a cardiac cycle. The images were aligned with axial, coronal and sagittal views. Two phases were first identified: the start of systole when the tricuspid valve starts to open and the end of systole when the tricuspid valve starts to close. Mid-diastole phase was defined as the phase in the middle between the end of the systole and the start of systole, while mid-systole phase was the phase right before the end of systole. The images from both the middle diastole and middle systole phases were used in the analysis, and are referred to as “diastole” and “systole” for short throughout the remainder of text. The tricuspid leaflets were visualized, identified, and manually segmented using Avizo software (Version 8.0, Burlington, MA) (Figure 1). The tricuspid annulus (TA), right ventricle (RV), and right atrium (RA) were segmented by the same contrast threshold in Avizo. In Avizo, the unconstrained smoothing algorithm was used to obtain a smoothed surface model of RV. For the leaflets, the constrained surface smoothing was applied with the lowest smoothing extent of 1 to generate the surface. The surface geometries in both diastolic and systolic phases were then imported into HyperMesh (Altair Engineering, Inc., MI) for 3D mesh generation.
Figure 1.
FE model reconstruction A) CT image of the valve at middle diastole and B) delineations of TV and RV C) example of unclear boundary between leaflet and chords at diastole (red arrow) D) example of unclear coaptation line at systole (red arrow) and E) reconstructed FE model overlapped with CT data for patient A, B and C.
Tricuspid annulus and leaflets
The TA was identified at the hinge point of tricuspid leaflets, separating the RA and RV. The three tricuspid leaflets were visible in CT images. At diastole, the three leaflets, although appeared to be very thin on the CT images, were generally clear on the images and could be identified and segmented. On some slices where chords were inserted into the leaflet edges, it was difficult to tell the boundary of leaflets against the boundary of chords (Figure 1 C). At systole, however, due to limited image quality, it was difficult to identify the full contour of the leaflets, especially at the coaptation zone. The belly region of the leaflets could be identified while the coaptation line were not clear and might not be accurately captured (Figure 1 D) Nodes were placed at around every 3 mm on the segmented geometries. Spline surfaces were manually generated in Hypermesh to interpolate the nodes and generate the complete geometries (Figure 1 E). Solid elements (i.e., 1-layer eight-node hexahedral C3D8I element in ABAQUS/Explicit) were used to model the leaflets. Due to the limited image quality and contrast, we were not able to determine the accurate leaflet thickness from images and thus the leaflet thickness was assumed to be 0.75 mm based on ex vivo measurements of human TV leaflets 23 and uniform for all patients.
Chordae Tendineae
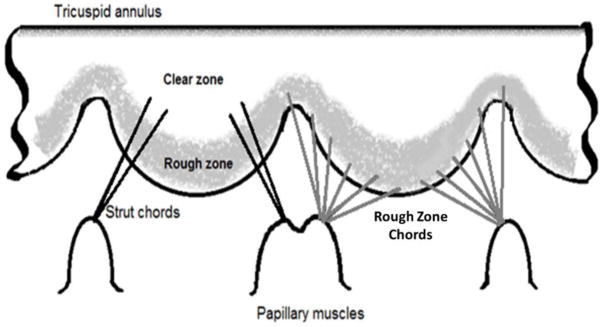
The chords were not visible from MSCT images; therefore, the chordal morphology, i.e. thickness and insertion pattern, was assumed based on cadaveric heart measurements in the literature 6, 29. Two types of chords, rough zone and strut (or basal) chords, were constructed. Figure 2 is a schematic of the chordal morphology adopted in the computational models. The chords were created such that they originated from the chordal origins identified at the tips of the papillary muscles, and inserted into the ventricular surface of the tricuspid leaflets. The chords near the anteroseptal commissure may arise from a very small septal papillary muscle or directly from the septal wall when there is no clear structure of septal papillary muscle29. As shown in figure 1E, none of the segmented right ventricle geometries presented distinct septal papillary muscle structure, so we placed the chordal origin just above a ridge on the septal wall and below the anteroseptal commissure. The rough zone chords were assumed to insert uniformly along the leaflet about 1 mm from the leaflet free edges. The strut chords were assumed to insert just above the leaflet rough zone which has a length of about 10 mm from the leaflet free edges 29. The strut chord insertion points were placed only on the sides of the leaflets, leaving a clear zone in the middle of the leaflet 28 (Figure 2). The chords were assumed to span from the leaflet insertion points to the closest origin points on the papillary muscle tips. In FE models, each chord was assumed to be initially straight, with no branches, and directly connect one chordal origin to one insertion point. The length and curvature of the chords were then iteratively adjusted to obtain more accurate leaflet deformation in FE simulations. Detailed adjustment procedures are described in section 2.4.
Figure 2.
Representation of chordal distribution and chordal insertion point locations on tricuspid leaflet ventricular surfaces in the FE models.
The chords were modeled using the 3D stress/displacement truss elements (two-node linear T3D2 elements), with the cross-sectional area values of 0.50 mm2 and 0.65 mm2 assigned to rough zone and strut, chordae, respectively 29. Branching of the chordae at the insertion points on the leaflets 29 was modeled by creating fork-shaped truss elements, which also prevents inaccurate stress concentration on the leaflets. Around 10–15 elements with an average element length of 1.5 mm were used to model each chord. The number of truss elements depended on the initial chord length.
2.2 Constitutive Modeling of Tricuspid Tissues
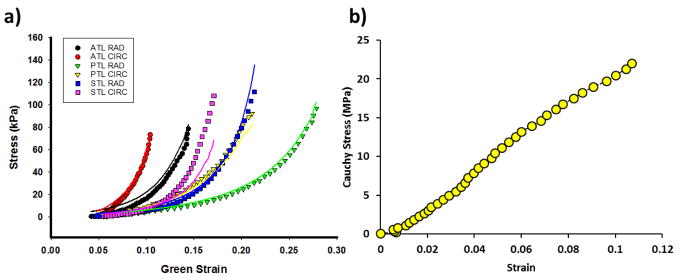
An anisotropic hyperelastic material model was adopted to characterize the mechanical behavior of the tricuspid leaflet tissues. The material properties were defined by load-controlled biaxial tests of healthy human tricuspid valves from human cadaver hearts23. The material properties of the TV apparatus wereobtained from a human cadaver heart of a 71-year-old female patient. Figure 3 shows the stress-strain curves from an equibiaxial protocol of the tricuspid leaflets in both directions 23. The model is based on the fiber-reinforced hyperelastic material model proposed by Holzapfel et al.5, 8. Briefly, the tricuspid tissues are assumed to be composed of a matrix material with two families of imbedded fibers, each with a preferred direction. The fiber directions can be mathematically described using two unit vectors. and are an invariant and a pseudo-invariant of the deviatoric part of the Cauchy-Green strain tensor, respectively. equals to the sum of the normal components of the Cauchy-Green strain tensor and equals the squares of the stretches in the fiber directions. The strain energy function W can be expressed as
Figure 3.
a) Stress-strain curves of anterior tricuspid leaflet (ATL), posterior tricuspid leaflet(PTL) and septal tricuspid leaflet (STL) under equibiaxial stretch in both circumferential (CIRC) and radial (RAD) directions. The corresponding colored lines represent the fitted model response for each leaflet; b) Uniaxial stress-strain curves of posterior marginal (PM) mitral chords, and the last data points represent the ultimate failure strength
| (1) |
where, C10, C01, k1, k2 and D are material constants. C10 and C01 are used to describe the matrix material. D is a material constant that introduces near incompressibility in this material model, while k1 is a positive material constant with the dimensions of stress and k2 is a dimensionless parameter describing the fibrous material. A dispersion parameter was used to describe the distribution of the mean fiber orientation, and is the determinant of the deformation gradient tensor. The fiber orientation was defined by structural tensor, Mi = m0i ⊗ m0i with m01 = [cosθ, sinθ, 0] and m02 = [cosθ, −sinθ,0]. The anisotropic hyperelastic material model was implemented into Abaqus 6.14 (SIMULIA, Providence, RI) with a user sub-routine VUMAT 16, 33. Local coordinate systems were defined for each leaflet to include fiber orientations for each region.
The isotropic hyperelastic Ogden material parameters for posterior marginal mitral chords used in a previous mitral valve model 22 were used to describe the tricuspid chord behavior. The material properties of the posterior marginal mitral chords were obtained from uniaxial experimental testing of the cadaver heart from a 69-year-old male patient. The stress-strain relationship of the selected mitral chordae material (shown in Figure 3b) was similar to that of the tricuspid chordae materials reported by Lim et. al15. Table 1 lists the material parameters for the tricuspid leaflet tissues from multi-protocol fitting and the material parameters for chords.
Table 1.
Material parameters for human tricuspid leaflets.
| Tricuspid Leaflets | ||||||||
|---|---|---|---|---|---|---|---|---|
|
| ||||||||
| C01 | k1(kPa) | k2 | C10(kPa) | kappa | Theta (°) | D(1/kPa) | R2 | |
| ATL | 15.354 | 0.001 | 79.377 | 0.486 | 5.960e-06 | 0.602 | 5.000e-04 | 0.846 |
| PTL | 5.128 | 0.038 | 23.515 | 0.862 | 0.0794 | l.000e-4 | 5.000e-04 | 0.934 |
| STL | 6.629 | 0.796 | 23.019 | 0.599 | 1.030e-07 | 28.536 | 5.000e-04 | 0.905 |
|
| ||||||||
| Chordae Tendineae | ||||||||
|
| ||||||||
| U1(Mpa) | A1 | U2(Mpa) | A2 | U3(Mpa) | A3 | R2 | ||
|
| ||||||||
| PM | 12.995 | 15.651 | 13.083 | 15.683 | 12.870 | 15.662 | 0.976 | |
2.3 Loading and boundary conditions
Simulations of TV function from middle diastole to middle systole were performed in 2 steps using ABAQUS Explicit (6.14) software.
In the first step, the dynamic motion of the TA and chordal origins from diastole to systole were simulated by imposing kinematic displacement to the nodes along the TA and chordal origins respectively. Boundary conditions for the TA and chordal origins were obtained from MSCT images by tracing the motion of the TA and papillary muscle heads from middle diastole to middle systole respectively. To approximate the nodal positions on TA at systole, one marker was placed on each commissure region on the annulus geometry at mid-diastole. Then the corresponding locations of the three markers were identified on the annulus geometry at systole. The contraction of annulus was assumed to be uniform within each annulus segment bound by any two adjacent markers. Therefore, the same number of nodes were uniformly placed between the markers on the systole geometry as on the diastole geometry and the corresponding displacement on each node on TA were calculated.
Since the systole geometries were obtained one phase before the end of systole where the leaflets started to open, the peak transvalular pressure of 23.7 mmHg measured experimentally by Jouan et. al.10 at systole was assumed as the pressure load on the systole configuration of our models. In the second step, the peak systolic pressure was applied to the ventricular surfaces of the tricuspid leaflets to simulate valve closure from diastole to systole.
2.4 Chordal Length Adjustments
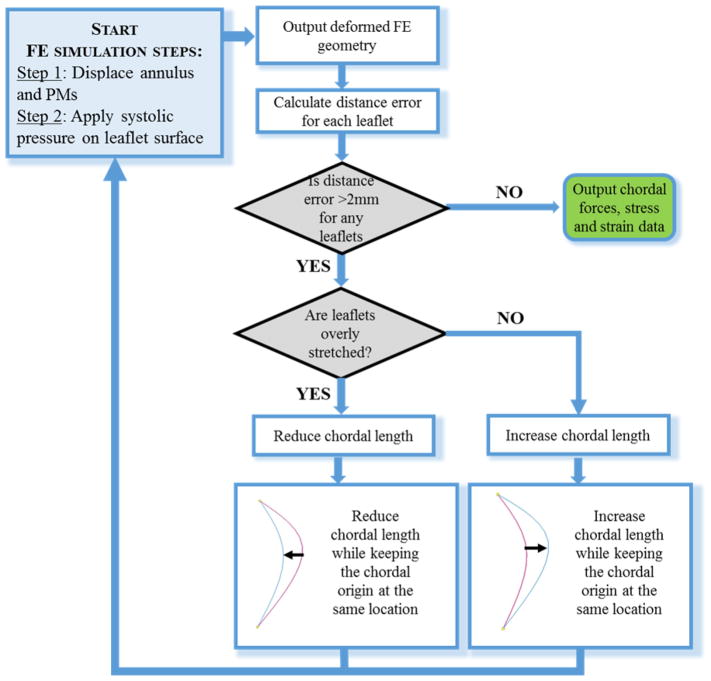
Chordal length plays an important role in the deformation of heart valves under systolic pressure 22. Since the chordal length was undetectable from images, the chordal lengths were iteratively adjusted until the simulated deformed leaflet FE geometry could closely match the leaflet geometry from MSCT images at systole. Figure 4 summarized the FE model optimization workflow, showing the FE simulation steps and criteria for model adjustment.
Figure 4.
Flow chart of the FE modeling steps and chordal length adjustment process.
The point-to-mesh distance error between the deformed FE model and image geometry was calculated to assess the FE model accuracy. To calculate the point-to-mesh distance error, 16 uniformly spaced nodes were sampled on the belly region of each leaflet of the deformed FE mesh. Each sampled node on the deformed FE model was projected to the surfaces reconstructed from MSCT images at systole along its surface normal. Based on the image resolution, a point-to-mesh distance of greater than 2 mm was considered unacceptable and thus required further model adjustment.
Similar to the previously published procedure for the mitral valve 22, the chordal length adjustment was achieved by increasing or decreasing the curvature of chords while keeping their insertion and origin points fixed. If the surface of the FE deformed valve leaflets were prolapsing into the left atrium during systole with a distance error larger than 2 mm, the chords in the vicinity were shortened. If the FE deformed chords at systole were excessively tensioned and pulling the leaflets towards the left ventricle, they were elongated. The chords were adjusted by around half of the point-to-mesh distance computed at the sampling node closest to the insertion points.
2.5 Data Analysis
The accuracy of the FE simulated TV deformed geometries at systole was assessed by measuring the distance errors between the nodes on the deformed FE geometries and their corresponding locations on the “true” geometries obtained from MSCT images. Briefly, spline surfaces were constructed for the “true” geometries from the image data. The average point-to-mesh distance error was computed as the average distance error between the sampled nodes and their corresponding projected nodes on the image geometry. Anterior, posterior or septal leaflets were separated by the middle line of the cleft between two adjacent leaflets (figure 5 a). Commissure height was measured at the middle line of each commissure. Annulus length was the length of the annulus segment corresponding to each leaflet. Maximum leaflet height was longest distance from the leaflet free margin to annulus. The annulus area was measured by fitting a plane to the tricuspid annulus in the least-squares sense, and then calculating the projected area on the fitted plane. The reaction force at each of the chordal origins, the leaflet strain in both the radial and circumferential directions, and the leaflet maximum principal stress were also output from the simulations.
Figure 5.
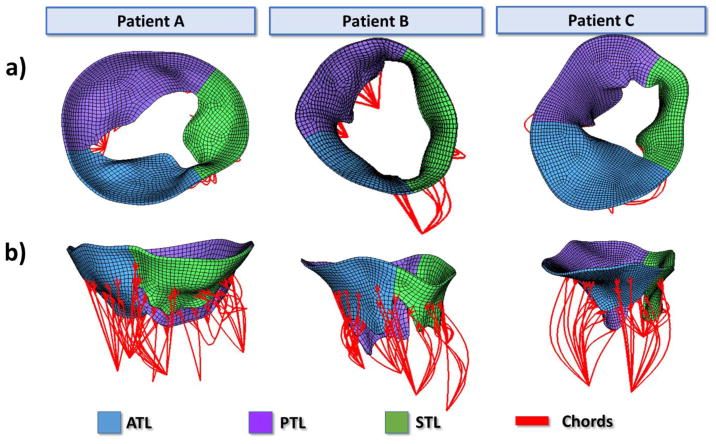
a) Atrial view and b) side view of Un-deformed FE geometries after chordal length adjustments for patients A, B, and C.
3. RESULTS
3.1 Patient valve geometry measurements
The annulus length, commissure height, and leaflet maximum height of the FE models at middle diastole were measured and displayed in Table 2. The annulus areas measured at diastole were 1289 mm2, 1783 mm2, and 1062 mm2 for patient A, B, and C, respectively. At middle systole, the annulus area was reduced by 30%, 19%, and 8% for patient A, B, and C, respectively.
Table 2.
Tricuspid valve measurements at diastole.
| Measurement | Leaflet | Patient A | Patient B | Patient C |
|---|---|---|---|---|
| Annulus Length (mm) | Anterior | 40.5 | 52.1 | 48.3 |
| Septal | 34.6 | 55.7 | 29.9 | |
| Posterior | 55.6 | 47.6 | 42.0 | |
|
| ||||
| Commissure Height (mm) | Anterior | 10.1 | 10.6 | 9.5 |
| Septal | 11.0 | 13.1 | 8.2 | |
| Posterior | 10.4 | 22.5 | 13.7 | |
|
| ||||
| Maximum Height (mm) | Anterior | 21.5 | 27.8 | 26.0 |
| Septal | 20.6 | 20.4 | 16.9 | |
| Posterior | 24.1 | 33.4 | 26.9 | |
3.2 FE Simulation Results
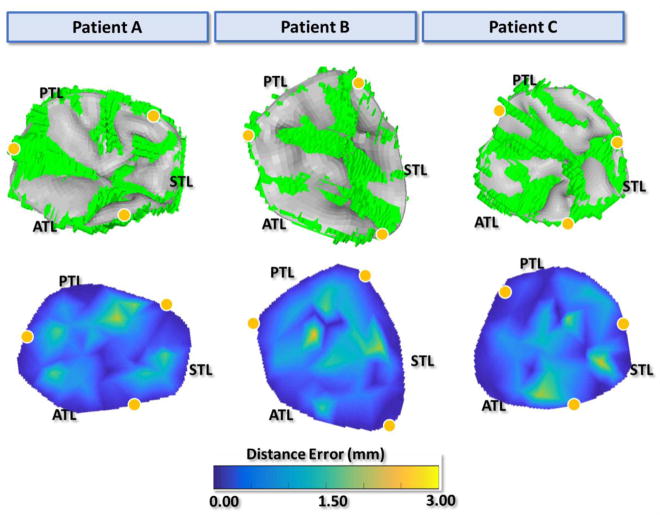
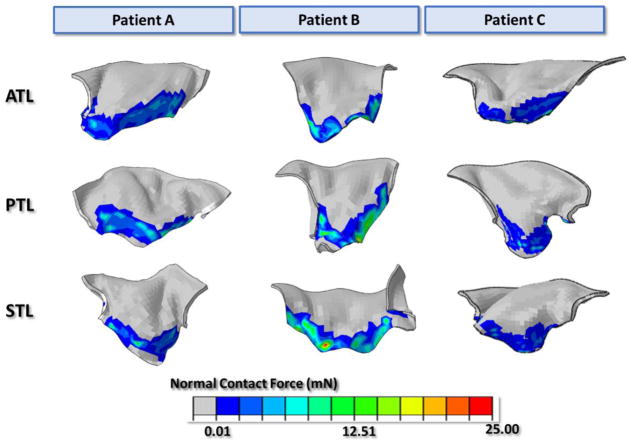
Figure 5 displays the final undeformed FE model geometries following chordal adjustments for all three patients. After about 15 iterations for each model, the leaflets closed completely at mid-systole and closely matched the systolic geometries from MSCT images with distance errors smaller than 2 mm for all leaflets. Figure 6a displays the deformed FE geometries superimposed on the ground truth middle-systolic geometries segmented from MSCT images. The atrial view of the TV demonstrated a good overall agreement between the computational results and the MSCT data. Some excessive protrusion of the leaflet belly regions towards the right atrium were observed; however, the average distance errors were below the 2-mm threshold. Figure 6b shows the distance error distributions for all models. The average distance errors were 0.55 ± 0.58 mm for patient A, 0.60 ± 0.65 mm for patient B, and 0.56 ± 0.64 mm for patient C. Larger errors were found on the belly region of the leaflets near the annulus and near the commissures, with maximum values being 2.53 mm. The contact force distribution was shown in Figure 7 to display the coaptation region.
Figure 6.
a) Atrial view of the deformed FE model (gray) overlapped with the true image model from MSCT images (green) at middle systole, b) atrial surface views of the calculated distance error maps at middle systole. Yellow dots mark the annulus boundary between leaflets
Figure 7.
Contact Force distribution (mN) of the leaflet coaptation regions.
The total chordal forces imposed on the anterior, posterior, and septal papillary muscles at peak systolic pressure are displayed in Table 3. On each papillary muscle, the total reaction forces were further divided into forces generated by the strut chords and forces generated by the rough zone chords. The strut chords contributed to larger reaction forces than the rough zone chords. For strut chords, the total reaction forces on the APMs were higher than those on the SPMs for all three models. However, there was not a clear pattern between the magnitude of chordal forces and papillary muscle attachments for the rough zone chords.
Table 3.
forces (in N) on anterior, posterior, and septal papillary muscles at middle systole of the three FE models
| ATL | PTL | STL | Total | ||||
|---|---|---|---|---|---|---|---|
| Marginal chords | Strut chords | Marginal chords | Strut chords | Marginal chords | Strut chords | ||
| Patient A | 0.17 | 0.53 | 0.17 | 0.58 | 0.15 | 0.43 | 2.02 |
| Patient B | 0.35 | 1.44 | 0.55 | 0.81 | 0.73 | 1.08 | 4.95 |
| Patient C | 0.22 | 0.76 | 0.24 | 0.55 | 0.27 | 0.55 | 2.60 |
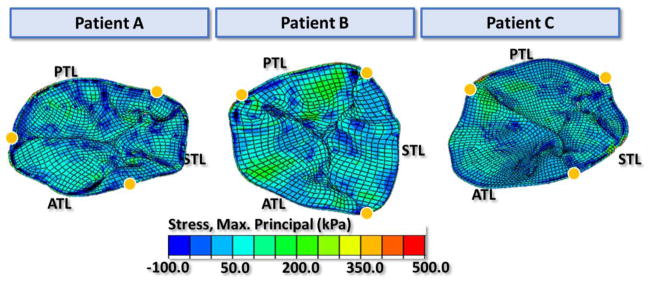
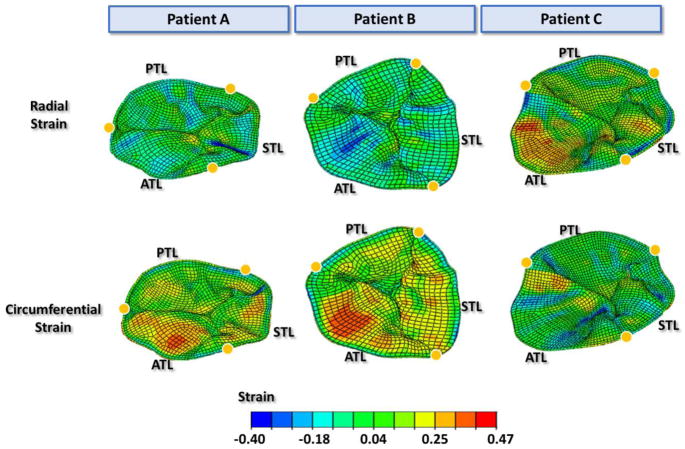
The maximum principal stress distributions of the tricuspid leaflets at middle systole are shown in Figure 8. Large tensile stresses were found in the belly region of the leaflets, while compressive stresses were found near the chordal insertion points and on the commissures. The average maximum principal stress was obtained for a 6 mm by 6 mm square section in the middle of the chord-free zone of each leaflet. At middle systole, the average stress ranged from 37–80kPa for anterior leaflets, 25–91 kPa for posterior leaflets, and 24–63 kPa for septal leaflets. Figure 9 displays the strain distributions on the tricuspid leaflets in both the radial and circumferential directions. Large radial strains appeared near the annulus on the belly region of the leaflets, especially on the anterior and septal leaflets. The strain values in the radial direction were averaged over each leaflet. For the three patients, the averaged strain values were 0.19 to 0.26 for the ATL, 0.07 to 0.17 for the PTL and 0.11 to 0.21 for the STL. Strain in the circumferential direction appeared to be higher near the coaptation region while some compressive circumferential strains were observed near the annulus and commissural regions. The average strain of ATL, PTL and STL in the circumferential direction of the three patients ranged from −0.09 to −0.03, −0.08 to −0.01 and −0.09 to −0.02, respectively. The average maximum principal strain values of the ATL, PTL, and STL among the three patients ranged from 0.24 to 0.32, 0.12 to 0.20, and 0.18 to 0.26, respectively.
Figure 8.
The maximum principal stress distribution on the tricuspid leaflets at middle systole. Yellow dots mark the annulus boundary between leaflets
Figure 9.
The strain distribution of tricuspid leaflets in the radial and circumferential directions at middle systole. Yellow dots mark the annulus boundary between leaflets
3.3 Sensitivity Analysis
Mesh density
A mesh sensitivity analysis was performed on the TV models to evaluate the effect of mesh density on simulation results. The mesh was refined by dividing the elements in the original mesh by half in all three directions and thus the number of elements in the refined mesh was 8 times as many as in the original mesh for each model. Percentage changes in distance error, average maximum principle stress and strain in the belly region of the leaflets, and chordal forces were 5.4%, 1.1%, 5.0% and 3.0% in distance error, stress, strain and chordal forces respectively, indicating a reasonable agreement between the refined mesh and the original mesh.
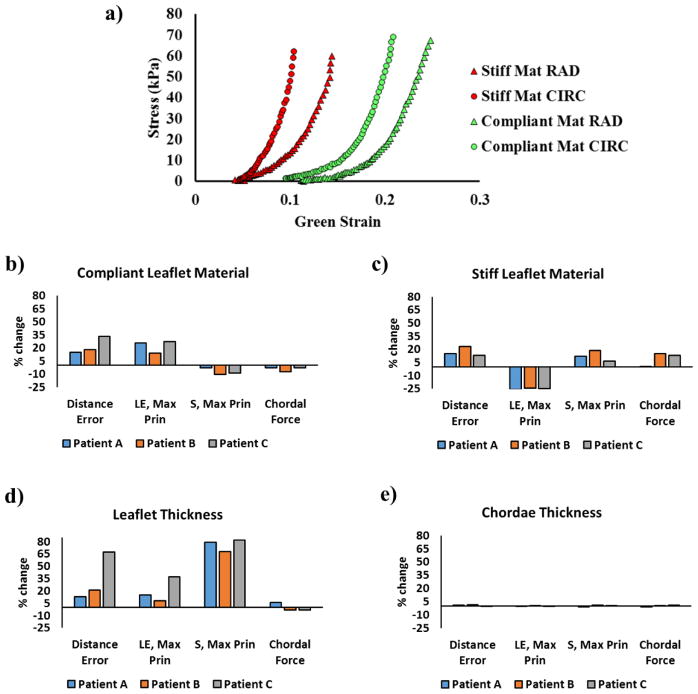
Leaflet materials
Leaflet material sensitivity analysis was conducted by using a stiff set and a compliant set of human TV material properties as input parameters. The stress-strain curve of the two materials are plotted in figure 10a. The same material properties were implemented in all three leaflets for each model. A maximum of 33.2% and 23.3% of changes in average distance errors were obtained respectively with compliant and stiff materials (0.18 mm and 0.11 mm changes in terms of average distance error values). As shown in figure 10b, using the compliant material caused an increase in leaflet strain (maximum 27.1%) while a decrease in leaflet stress (maximum 10.5%), together with decreased chordal forces (maximum 7.4%) in all modes. On the contrary, as figure 10c shows, using the stiff material brought a decrease in leaflet strain (maximum 25.7%) while an increase in stress (maximum 18.8%), with increased chordal forces (maximum 15.2%).
Figure 10.
a) stress-strain curves of the compliant and stiff materials the under equibiaxial stretch in both circumferential (CIRC) and radial (RAD) directions and effects of b) using compliant leaflet materials, c) using stiff leaflet materials d) leaflet thickness and e) chordae thickness on average distance errors, average leaflet maximum principal stress and strain and total chordal forces
Leaflet thickness
A uniform leaflet thickness of 0.4 mm reported from the experimental measurements of Stevanella et. al31. was adopted to study the effect of using a thinner leaflet thickness on modeling outcomes. The different thickness used caused a relatively large percentage change in distance error in patient C (67.3%) while that corresponded to a 0.37 mm increase in the average distance errors. As shown in figure 10d, the reduction in leaflet thickness resulted in a substantial increase in stress and smaller increase in distance errors and strain, as well as changes in chordal forces. The maximum percentage changes were 36.9%, 82.0% and 5.7% among all patients for leaflet strain, stress and chordal forces, respectively.
Chordae thickness
Since the cross-sectional area of tricuspid chords varied in the range of 0.5 mm2 to 0.95mm29, a sensitivity analysis of chordae thickness was conducted to evaluate the effect of varying chordae thickness on the simulation outcomes. Since the original chordae cross-sectional areas of 0.5 mm2 and 0.65 mm2 were on the smaller side of the range, a large chordae cross sectional area of 0.95 mm2 was used to conduct the analysis. As figure 10c shows, increasing the chordae thickness resulted in only minor change in distance error, leaflet stress, strain or chordal forces.
4. DISCUSSION
Computational models could provide quantifications of TV biomechanics and inform TV repair devices and strategies. This study presented, to our knowledge, the first finite element model of the human TV with patient-specific leaflet geometries, boundary conditions and material properties. In this study, the healthy TV anatomy and function were modeled to define the baseline TV biomechanics, which can be expanded, in future studies, to model the diseased TV and TV repair biomechanics. The models incorporated realistic anatomical TV apparatus geometries reconstructed from MSCT images, human nonlinear anisotropic hyperelastic material properties, and realistic physiological boundary conditions. The chordal lengths were iteratively adjusted until the deformed leaflet geometries matched the MSCT data at systole. The chordal forces and leaflet stress and strain measurements obtained from the models of this study may be useful in the design of TTV devices and strategies. The computational approach developed could be one step towards developing computational models that may support pre-operative planning in complex TV repair procedures in the future.
The TV biomechanical metrics obtained from the models were compared to computational and experimental measurements reported in the literature. The strut chordal forces were greater than the rough zone chordal forces in all three models, which is in agreement with Stevanella et al31. This is consistent with the experimental measurements of mitral chordal force distribution which also showed the higher chordal forces from strut chords than from marginal (rough zone) chords9. Troxler et al. 34 measured the strut chordal forces of the TV using a right heart simulator and found that the chordal force depended upon the PM attachment, where strut chords connected to the APM had significantly higher forces than chords connected to the SPM. Our FE modeling results are consistent with these experimental findings: the strut chord forces were higher on the APM than on the SPM in all three patients. Despite the same peak systolic pressure conditions, the total chordal forces from our models ranged from 2.02 to 4.95 N. The relatively larger annular area in patient B compared to patient A and C could explain the larger total chordal force of patient B relative to the other two patients. The TV leaflet stress values obtained from the computational models from this study were comparable to the leaflet stress quantified by Stevanella et al. 31 using a generic TV FE model. However, the stress near the annulus regions in our models is higher, probably due to the complex patient-specific geometries, boundary conditions, and different material properties specified.
From our models, the stretch ratios ranged from 1.19 to 1.26 for the ATL, 1.07 to 1.17 for the PTL, and 1.1 to 1.21 for the STL in the radial direction and from 0.91 to 0.97 for the ATL, 0.92 to 0.99 for the PTL, and 0.91 to 0.98 for the STL in the circumferential direction. Shortening in the circumferential direction were also observed by Spinner et al. 30 from in vitro experiments with the porcine TV. They reported comparable circumferential stretch ratios of 0.98 ± 0.05 for the ATL and 0.96 ± 0.16 for the PTL; however the radial stretch ratios, 1.53 ± 0.32 for the PTL, were much larger in their study 30. The discrepancy may be due to material property differences between the aged human and porcine TV leaflets: porcine aortic valve leaflets are significantly more compliant than corresponding aged human leaflets 18.
Compared with the MV, the stress in the tricuspid leaflets is lower. Wang et al. 37 used a similar approach to model MV closure at systole, and reported an average maximum principal stress of 160 kPa on the middle region of the anterior mitral leaflet, compared to 50–75 kPa for the TV leaflets in this study. Similarly, Votta et al. observed higher stresses ranging from 130–540 kPa on the belly of the anterior mitral leaflet and 60–270 kPa on the posterior leaflets in their computational model 36. Our results indicated that although the transvavular pressure of the TV is much lower than that of the mitral valve (almost one fifth), the strain in radial direction of the TV leaflets in this study were similar to the strains in mitral valve obtained from experiments; however more shortening in the circumferential direction were observed in the tricuspid valve than in the mitral valve. The average stretch ratios in radial direction were 1.32 ± 0.0824 and 1.23 ± 0.14 for anterior and posterior mitral leaflet7. The differences in stress and strain could be due to a combination of factors including the differing valvular structure (TV consists of one more leaflet than MV), material properties (tricuspid leaflets were significantly more compliant than mitral leaflets 23), and transvalvular pressure.
Limitations
Although the TV models developed in this study incorporated patient-specific geometries, realistic material properties, and physiological boundary conditions, some simplifying assumptions were made.
First, due to the limited resolution of MSCT images, the detailed chordal origins and insertion locations were not visible and were therefore assumed. By iteratively adjusting the chordal lengths, the models could accurately simulate the deformed TV geometries at systole. However, high-resolution images capturing the detailed geometric information of the chords would be ideal to improve the efficiency and accuracy of this TV modeling framework, which may then assist in pre-operative planning of TV-related surgeries. Limited by the image resolution, we were not able to identify the chordal attachment locations on the ventricle wall and the locations of the chordal origins near anteroseptal commissure were only approximations. With current assumptions of chordal attachment, our model could simulate the full closure of tricuspid valve at systole, indicating these assumptions are likely reasonable. Future studies on the effect of different chordal attachment on ventricle wall may be useful in further understanding of tricuspid valve biomechanics.
Moreover, uniform thickness of the TV leaflets was assumed based on experimental measurements while in reality leaflet thickness varies from the belly region to the free edge region of the leaflets. Our sensitivity analysis showed that the leaflet stress is sensitive to the leaflet thickness. Models with thinner leaflets showed a substantial increase in leaflet stress under systolic pressure. Our models, which assumed the average TV leaflet thickness from experimental data, could provide a general estimation of TV stress while may not accurately predict the stress for specific patients since the leaflet thickness may vary individually. Ideally, the detailed thickness of tricuspid leaflets should be identified from the imaging data with higher resolution.
The leaflet material properties were assumed from the material properties determined from the TV of a human cadaver heart, rather than from the TVs of the patients studied. Based on our sensitivity analysis of leaflet materials, leaflet material properties used may affect the TV biomechanics outcomes. Although our models provide insights of the general biomechanical characteristics of TV under systole pressure, for the models to be able to accurately predict the biomechanical information for specific patients, patient-specific material properties need to be determined inversely from image data. The chordae material properties were assumed from mitral chordae material properties that resembled the stress-strain relationship of tricuspid chordae15. Mansi et al. found that the mitral valve dynamics was mostly independent on chordae stiffness but was largely dependent on chordae rest length17. Therefore, due to the similar mechanical role of tricuspid and mitral chords, the mismatch in chord material properties was not expected to greatly affect our simulation results. Also, the leaflet fiber orientation was defined in the same way for all three leaflets without considering the effect of chordal insertion on leaflet collagen fiber distribution. However, Spinner et al. 30 observed an increased localization of collagen structures near the insertion points of strut chords, which might have contributed to reduced leaflet stretch near the insertions. Therefore, future studies of detailed leaflet fiber architecture in relation to chordal insertion would be helpful in providing more realistic material inputs to TV FE models.
Finally, the modeling approach described here was not time-efficient to be used in a clinical setting. The models required time-consuming manual segmentation of TV geometries and model reconstruction. Also, the whole simulation required almost 20 minutes to run in parallel on 32 cores using Abaqus. Together with the time to adjust the chorda length and compute point-to-mesh distance, the total time spent on tuning each model were approximately around 5 hours. Methods to streamline and automate the model generation and simulation process are under development to facilitate the modeling process13, 14.
5. CONCLUSION
This study presented the first TV models with detailed patient-specific anatomical geometries reconstructed from MSCT images, realistic anisotropic hyperplastic material properties of human TVs and realistic boundary conditions tracked from MSCT images. After iteratively adjusting chordal lengths, the models demonstrated a good overall match with the deformed TV geometries from MSCT data at peak systole. The models provide quantitative measurements of chordal force and leaflet stress and strain and provide insights into the healthy human TV biomechanics. In future studies, models of TV disease will be developed and TV repair simulated. The modeling framework developed could be one step towards developing computational models that may serve as a tool to inform TV repair device design as well as assist cardiac surgeons in evaluating TV diseases and proper treatment options.
Acknowledgments
Research for this project was funded in part by NIH HL104080 and HL127570 grants. The authors would like to thank Erica Shin for tissue mechanical testing of TV tissues.
Footnotes
7. Disclosures
None.
References
- 1.Amini Khoiy K, Amini R. On the Biaxial Mechanical Response of Porcine Tricuspid Valve Leaflets. Journal of biomechanical engineering. 2016;138 doi: 10.1115/1.4034426. [DOI] [PubMed] [Google Scholar]
- 2.Bruce CJ, Connolly HM. Right-Sided Valve Disease Deserves a Little More Respect. Circulation. 2009;119:2726–2734. doi: 10.1161/CIRCULATIONAHA.108.776021. [DOI] [PubMed] [Google Scholar]
- 3.Campelo-Parada F, Perlman G, Philippon F, Ye J, Thompson C, Bédard E, Abdul-Jawad Altisent O, Del Trigo M, Leipsic J, Blanke P, Dvir D, Puri R, Webb JG, Rodés-Cabau J. First-in-Man Experience of a Novel Transcatheter Repair System for Treating Severe Tricuspid Regurgitation. Journal of the American College of Cardiology. 2015;66:2475–2483. doi: 10.1016/j.jacc.2015.09.068. [DOI] [PubMed] [Google Scholar]
- 4.Fukuda S, Saracino G, Matsumura Y, Daimon M, Tran H, Greenberg NL, Hozumi T, Yoshikawa J, Thomas JD, Shiota T. Three-Dimensional Geometry of the Tricuspid Annulus in Healthy Subjects and in Patients With Functional Tricuspid Regurgitation. A Real-Time, 3-Dimensional Echocardiographic Study. 2006;114:I-492–I-498. doi: 10.1161/CIRCULATIONAHA.105.000257. [DOI] [PubMed] [Google Scholar]
- 5.Gasser TC, Ogden RW, Holzapfel GA. Hyperelastic modelling of arterial layers with distributed collagen fibre orientations. Journal of The Royal Society Interface. 2006;3:15–35. doi: 10.1098/rsif.2005.0073. [DOI] [PMC free article] [PubMed] [Google Scholar]
- 6.Gunnal SA, Wabale RN, Farooqui MS. Morphological Study of Chordae Tendinae in Human Cadaveric Hearts. Heart Views : The Official Journal of the Gulf Heart Association. 2015;16:1–12. doi: 10.4103/1995-705X.152994. [DOI] [PMC free article] [PubMed] [Google Scholar]
- 7.He Z, Ritchie J, Grashow JS, Sacks MS, Yoganathan AP. In vitro dynamic strain behavior of the mitral valve posterior leaflet. Journal of biomechanical engineering. 2005;127:504–511. doi: 10.1115/1.1894385. [DOI] [PubMed] [Google Scholar]
- 8.Holzapfel GA, Gasser TC, Ogden RW. A New Constitutive Framework for Arterial Wall Mechanics and a Comparative Study of Material Models. Journal of elasticity and the physical science of solids. 2000;61:1–48. [Google Scholar]
- 9.Jimenez JH, Soerensen DD, He Z, He S, Yoganathan AP. Effects of a Saddle Shaped Annulus on Mitral Valve Function and Chordal Force Distribution: An In Vitro Study. Annals of biomedical engineering. 2003;31:1171–1181. doi: 10.1114/1.1616929. [DOI] [PubMed] [Google Scholar]
- 10.Jouan J, Pagel MR, Hiro ME, Lim KH, Lansac E, Duran CM. Further information from a sonometric study of the normal tricuspid valve annulus in sheep: geometric changes during the cardiac cycle. The Journal of heart valve disease. 2007;16:511–518. [PubMed] [Google Scholar]
- 11.Kragsnaes ES, Honge JL, Askov JB, Hasenkam JM, Nygaard H, Nielsen SL, Jensen MO. In-plane Tricuspid Valve Force Measurements: Development of a Strain Gauge Instrumented Annuloplasty Ring. Cardiovascular Engineering and Technology. 2013;4:131–138. [Google Scholar]
- 12.Latib A, Agricola E, Pozzoli A, Denti P, Taramasso M, Spagnolo P, Juliard J-M, Brochet E, Ou P, Enriquez-Sarano M, Grigioni F, Alfieri O, Vahanian A, Colombo A, Maisano F. First-in-Man Implantation of a Tricuspid Annular Remodeling Device for Functional Tricuspid Regurgitation. JACC: Cardiovascular Interventions. 2015;8:e211–e214. doi: 10.1016/j.jcin.2015.06.028. [DOI] [PubMed] [Google Scholar]
- 13.Liang L, Kong F, Martin C, Pham T, Wang Q, Duncan J, Sun W. Machine learning–based 3-D geometry reconstruction and modeling of aortic valve deformation using 3-D computed tomography images. International Journal for Numerical Methods in Biomedical Engineering. 2017;33:e2827. doi: 10.1002/cnm.2827. n/a. [DOI] [PMC free article] [PubMed] [Google Scholar]
- 14.Liang L, Liu M, Martin C, Sun W. A deep learning approach to estimate stress distribution: a fast and accurate surrogate of finite-element analysis. Journal of the Royal Society, Interface. 2018;15 doi: 10.1098/rsif.2017.0844. [DOI] [PMC free article] [PubMed] [Google Scholar]
- 15.Lim KO. Mechanical properties and ultrastructure of normal human tricuspid valve chordae tendineae. The Japanese journal of physiology. 1980;30:455–464. doi: 10.2170/jjphysiol.30.455. [DOI] [PubMed] [Google Scholar]
- 16.Liu H, Sun W. Computational efficiency of numerical approximations of tangent moduli for finite element implementation of a fiber-reinforced hyperelastic material model. Computer methods in biomechanics and biomedical engineering. 2016;19:1171–1180. doi: 10.1080/10255842.2015.1118467. [DOI] [PMC free article] [PubMed] [Google Scholar]
- 17.Mansi T, Voigt I, Georgescu B, Zheng X, Mengue EA, Hackl M, Ionasec RI, Noack T, Seeburger J, Comaniciu D. An integrated framework for finite-element modeling of mitral valve biomechanics from medical images: application to MitralClip intervention planning. Medical image analysis. 2012;16:1330–1346. doi: 10.1016/j.media.2012.05.009. [DOI] [PubMed] [Google Scholar]
- 18.Martin C, Sun W. Biomechanical characterization of aortic valve tissue in humans and common animal models. J Biomed Mater Res A. 2012;100:1591–1599. doi: 10.1002/jbm.a.34099. [DOI] [PMC free article] [PubMed] [Google Scholar]
- 19.Meduri CU, Rajagopal V, Vannan MA, Feldt K, Latib A. Transcatheter tricuspid valve therapies. Cardiac Interventions Today. 2017;11:48–53. [Google Scholar]
- 20.Morgan AE, Pantoja JL, Weinsaft J, Grossi E, Guccione JM, Ge L, Ratcliffe M. Finite Element Modeling of Mitral Valve Repair. Journal of biomechanical engineering. 2016;138:0210091–0210098. doi: 10.1115/1.4032125. [DOI] [PMC free article] [PubMed] [Google Scholar]
- 21.Nath J, Foster E, Heidenreich PA. Impact of tricuspid regurgitation on long-term survival. Journal of the American College of Cardiology. 2004;43:405–409. doi: 10.1016/j.jacc.2003.09.036. [DOI] [PubMed] [Google Scholar]
- 22.Pham T, Kong F, Martin C, Wang Q, Primiano C, McKay R, Elefteriades J, Sun W. Finite Element Analysis of Patient-Specific Mitral Valve with Mitral Regurgitation. Cardiovasc Eng Technol. 2017;8:3–16. doi: 10.1007/s13239-016-0291-9. [DOI] [PMC free article] [PubMed] [Google Scholar]
- 23.Pham T, Sulejmani F, Shin E, Wang D, Sun W. Quantification and comparison of the mechanical properties of four human cardiac valves. Acta biomaterialia. 2017;54:345–355. doi: 10.1016/j.actbio.2017.03.026. [DOI] [PubMed] [Google Scholar]
- 24.Sacks MS, He Z, Baijens L, Wanant S, Shah P, Sugimoto H, Yoganathan AP. Surface strains in the anterior leaflet of the functioning mitral valve. Annals of biomedical engineering. 2002;30:1281–1290. doi: 10.1114/1.1529194. [DOI] [PubMed] [Google Scholar]
- 25.Sadeghpour A, Hassanzadeh M, Kyavar M, Bakhshandeh H, Naderi N, Ghadrdoost B, Haghighat Talab A. Impact of Severe Tricuspid Regurgitation on Long Term Survival. Research in Cardiovascular Medicine. 2013;2:121–126. doi: 10.5812/cardiovascmed.10686. [DOI] [PMC free article] [PubMed] [Google Scholar]
- 26.Schofer J, Bijuklic K, Tiburtius C, Hansen L, Groothuis A, Hahn RT. First-inHuman Transcatheter Tricuspid Valve Repair in a Patient With Severely Regurgitant Tricuspid Valve. Journal of the American College of Cardiology. 2015;65:1190–1195. doi: 10.1016/j.jacc.2015.01.025. [DOI] [PubMed] [Google Scholar]
- 27.Schueler R, Malasa M, Hammerstingl C, Nickenig G. Transcatheter interventions for tricuspid regurgitation: MitraClip. EuroIntervention. 2016;12:Y108–Y109. doi: 10.4244/EIJV12SYA29. [DOI] [PubMed] [Google Scholar]
- 28.Shiran A, Sagie A. Tricuspid Regurgitation in Mitral Valve Disease. Incidence, Prognostic Implications, Mechanism, and Management. 2009;53:401–408. doi: 10.1016/j.jacc.2008.09.048. [DOI] [PubMed] [Google Scholar]
- 29.Silver MD, Lam JHC, Ranganathan N, Wigle ED. Morphology of the Human Tricuspid Valve. Circulation. 1971;43:333–348. doi: 10.1161/01.cir.43.3.333. [DOI] [PubMed] [Google Scholar]
- 30.Spinner EM, Buice D, Yap CH, Yoganathan AP. The effects of a three-dimensional, saddle-shaped annulus on anterior and posterior leaflet stretch and regurgitation of the tricuspid valve. Annals of biomedical engineering. 2012;40:996–1005. doi: 10.1007/s10439-011-0471-6. [DOI] [PubMed] [Google Scholar]
- 31.Stevanella M, Votta E, Lemma M, Antona C, Redaelli A. Finite element modelling of the tricuspid valve: A preliminary study. Medical Engineering & Physics. 2010;32:1213–1223. doi: 10.1016/j.medengphy.2010.08.013. [DOI] [PubMed] [Google Scholar]
- 32.Stuge O, Liddicoat J. Emerging opportunities for cardiac surgeons within structural heart disease. The Journal of thoracic and cardiovascular surgery. 2006;132:1258–1261. doi: 10.1016/j.jtcvs.2006.08.049. [DOI] [PubMed] [Google Scholar]
- 33.Sun W, Sacks MS. Finite element implementation of a generalized Fung-elastic constitutive model for planar soft tissues. Biomechanics and Modeling in Mechanobiology. 2005;4:190–199. doi: 10.1007/s10237-005-0075-x. [DOI] [PubMed] [Google Scholar]
- 34.Troxler LG, Spinner EM, Yoganathan AP. Measurement of strut chordal forces of the tricuspid valve using miniature C ring transducers. Journal of biomechanics. 2012;45:1084–1091. doi: 10.1016/j.jbiomech.2011.12.004. [DOI] [PubMed] [Google Scholar]
- 35.van Rosendael PJ, Delgado V, Bax JJ. The tricuspid valve and the right heart: anatomical, pathological and imaging specifications. EuroIntervention. 2015;11(Suppl W):W123–127. doi: 10.4244/EIJV11SWA35. [DOI] [PubMed] [Google Scholar]
- 36.Votta E, Caiani E, Veronesi F, Soncini M, Montevecchi FM, Redaelli A. Mitral valve finite-element modelling from ultrasound data: a pilot study for a new approach to understand mitral function and clinical scenarios. Philosophical Transactions of the Royal Society A: Mathematical, Physical and Engineering Sciences. 2008;366:3411–3434. doi: 10.1098/rsta.2008.0095. [DOI] [PubMed] [Google Scholar]
- 37.Wang Q, Sun W. Finite element modeling of mitral valve dynamic deformation using patient-specific multi-slices computed tomography scans. Annals of biomedical engineering. 2013;41:142–153. doi: 10.1007/s10439-012-0620-6. [DOI] [PubMed] [Google Scholar]
- 38.Wengenmayer T, Zehender M, Bothe W, Bode C, Grundmann S. First transfemoral percutaneous edge-to-edge repair of the tricuspid valve using the MitraClip system. EuroIntervention. 2016;11:1541–1544. doi: 10.4244/EIJV11I13A296. [DOI] [PubMed] [Google Scholar]
- 39.Xanthos T, Dalivigkas I, Ekmektzoglou KA. Anatomic variations of the cardiac valves and papillary muscles of the right heart. Italian journal of anatomy and embryology = Archivio italiano di anatomia ed embriologia. 2011;116:111–126. [PubMed] [Google Scholar]


