Abstract
Bone strength is affected not only by bone mineral density (BMD) and bone microarchitecture but also its microenvironment. Recent studies have focused on the role of marrow adipose tissue (MAT) in the pathogenesis of bone loss. Osteoblasts and adipocytes arise from a common mesenchymal stem cell within bone marrow and many osteoporotic states, including aging, medication use, immobility, over – and undernutrition are associated with increased marrow adiposity. Advancements in imaging technology allow the non-invasive quantification of MAT. This article will review magnetic resonance imaging (MRI)- and computed tomography (CT)-based imaging technologies to assess the amount and composition of MAT. The techniques that will be discussed are anatomic T1-weighted MRI, water-fat imaging, proton MR spectroscopy, single energy CT and dual energy CT. Clinical applications of MRI and CT techniques to determine the role of MAT in patients with obesity, anorexia nervosa, and type 2 diabetes will be reviewed.
Keywords: marrow adipose tissue (MAT), marrow adipose tissue composition, magnetic resonance imaging, proton MR spectroscopy, dual energy computed tomography (DECT)
1. Introduction
Bone strength depends on bone mineral density (BMD) and bone quality [1]. While BMD is typically used to predict bone strength, other factors, such as bone microarchitecture and the bone microenvironment play important roles in skeletal integrity. Recent advances in the understanding of the bone-fat connection suggest that marrow adipose tissue (MAT) could function as a diagnostic marker and a potential target for the treatment of osteoporosis [2–6] Bone marrow is one of the largest organs in the human body and is composed primarily of adipocytes and hematopoietic red blood cells which are surrounded by vascular sinuses and fill the cavities of trabecular bone. Within bone marrow, osteoblasts and adipocytes arise from a common mesenchymal stem cell and many osteoporotic states, including old age, medication use, immobility and anorexia nervosa are associated with increased marrow adiposity [7–11]. Furthermore, MAT might also play a role in the pathophysiology of metabolic disorders. Obesity and type 2 diabetes mellitus (T2DM) are associated with increased fracture risk despite normal and even increased BMD [12–14] and MAT quantity and its composition might play an etiologic role in impaired bone health associated with these disorders [15]. Therefore, imaging biomarkers that can accurately assess the amount and composition of MAT are needed to investigate the role of MAT in the pathogenesis of bone loss. Advancements in imaging technology allow the non-invasive quantification of MAT. Magnetic resonance imaging (MRI) and proton magnetic resonance spectroscopy (1H-MRS) can assess MAT content and composition without ionizing radiation [16, 17]. Computed tomography (CT), especially dual energy CT, can assess MAT and BMD in a single examination, however, CT is associated with ionizing radiation [18–22]. This article will review MRI- and CT-based techniques to assess MAT and applications of imaging techniques to determine the role of MAT in patients with obesity, anorexia nervosa, and T2DM.
2. MRI-based techniques
2.1. T1-weighted MRI
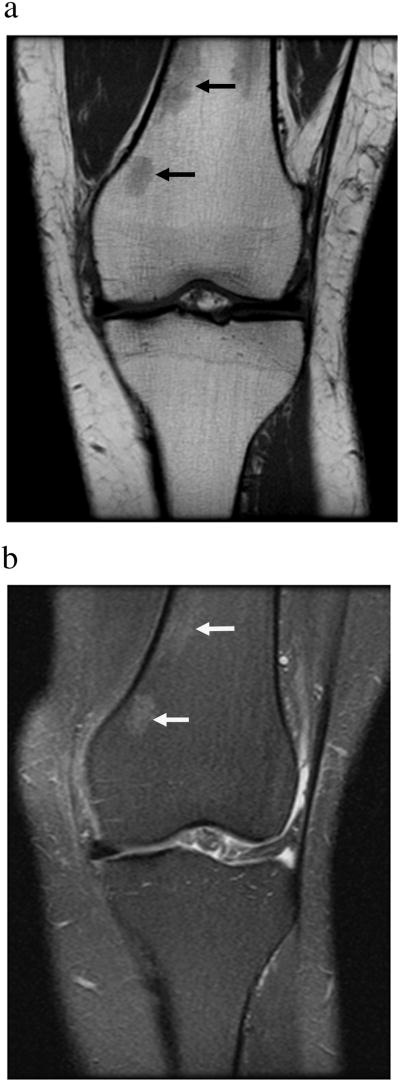
The major determinants of the MRI appearance of bone marrow are its fat and water content and the MRI appearance of MAT depends on the pulse sequence used. T1-weighted spin-echo or fast spine-echo sequences are most suitable to evaluate MAT given the high fat content of bone marrow. Most fat protons within bone marrow are residing in aliphatic (-CH2-) chains of triglycerides that rotate near the Lamor frequency, facilitating T1-relaxation and resulting in T1 shortening [23]. Therefore, MAT is typically hyperintense (bright) on T1-weighted images and follows the signal intensity (SI) of subcutaneous fat (Figure 1). On fat-suppressed or fluid-sensitive sequences (fat-suppressed T2- / proton density-weighted, or short tau inversion recovery (STIR) sequences) MAT is lower in SI than muscle (Figure 1).
Figure 1.
Coronal T1-weighted (A) and coronal fat-suppressed T2-weighted (B) MR images of the knee demonstrate normal marrow adipose tissue which is hyperintense (bright) on T1- and hypointense (dark) on fat-suppressed T2-weighted images. Small islands of red marrow are of intermediate signal intensity (arrows).
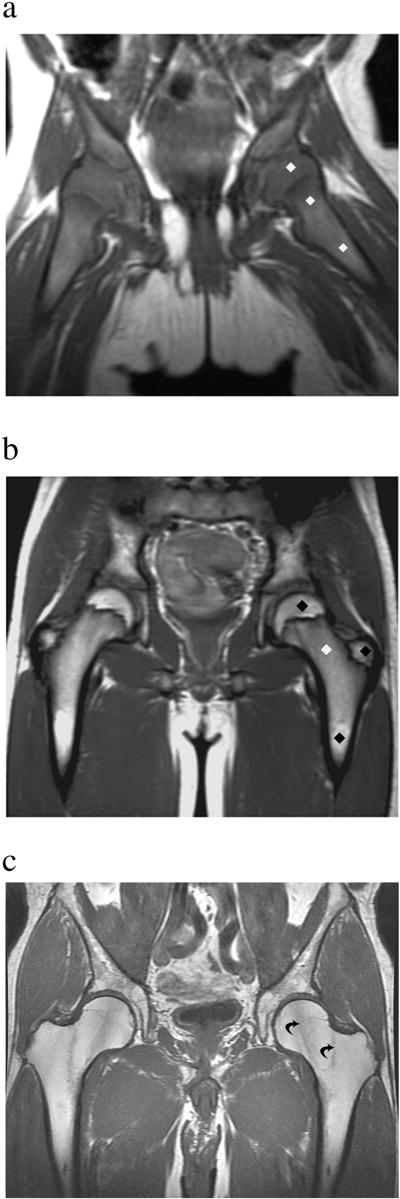
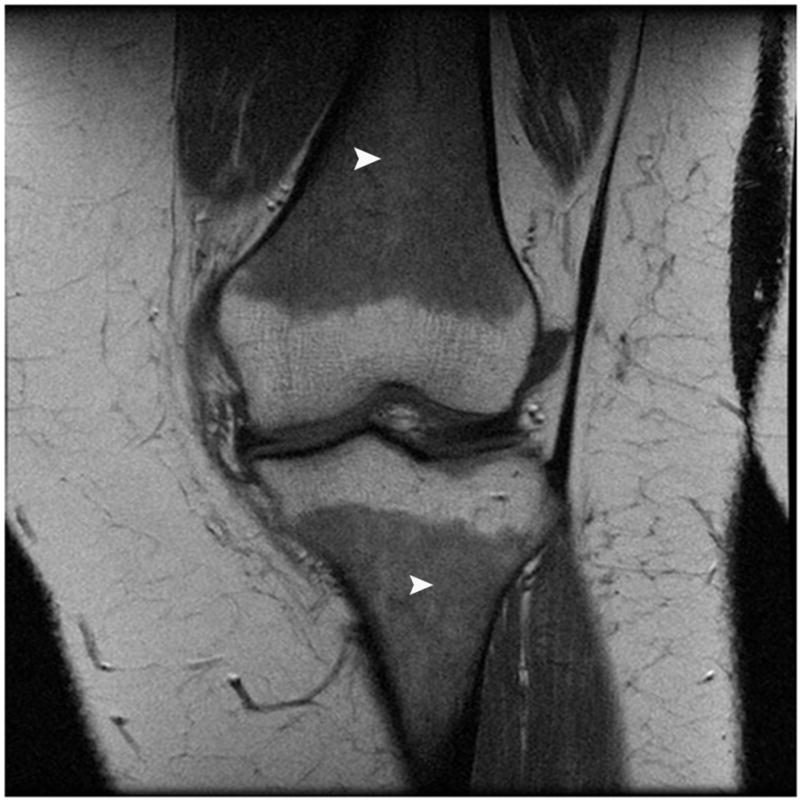
Bone marrow is a dynamic organ and its composition changes with aging, nutrition, or malignancy and these changes can be demonstrated using T1-weighted images. During the normal aging process, there is physiologic conversion from red (hematopoietic) to yellow (fatty) marrow. This conversion occurs in a predictable fashion: at birth marrow is predominately hematopoietic. Age-related conversion from hematopoietic to fatty marrow starts in the epiphyses, followed by the diaphyses, the distal metaphyses and the proximal metaphyses, which can contain residual hematopoietic marrow in the adult. While the distribution from hematopoietic to fatty marrow can vary from person to person it is usually symmetric in the same person (Figure 2). Conversely, re-conversion from fatty to red marrow can occur due to stimulation of reticulocyte production and can be seen in training athletes, due to high altitude, obesity, smoking, blood loss or with certain treatments. Marrow reconversion occurs in the mirror-opposite sequence of yellow marrow conversion [24–26] (Figure 3).
Figure 2.
T1-weighted MR images of the pelvis showing normal physiologic conversion of red (hematopoietic) to yellow (fatty) marrow. At birth (A) marrow is red and diffusely hypointense (dark) (diamonds) compared to subcutaneous fat. During adolescences (B), physiologic conversion from red to fatty marrow occurs, involving first the epiphyses and epiphysis equivalents, such as the greater trochanters, and diaphyses (black diamonds) while the metaphyses still contain red marrow (white diamond). In adulthood (C), there is nearly complete conversion to fatty marrow with only few remaining islands of red marrow (curved arrows).
Figure 3.
Coronal T1-weighted MR image of the knee in a subject with obesity demonstrates marrow reconversion with prominent red marrow in the distal femoral and proximal tibial meta-diaphyses (arrowheads).
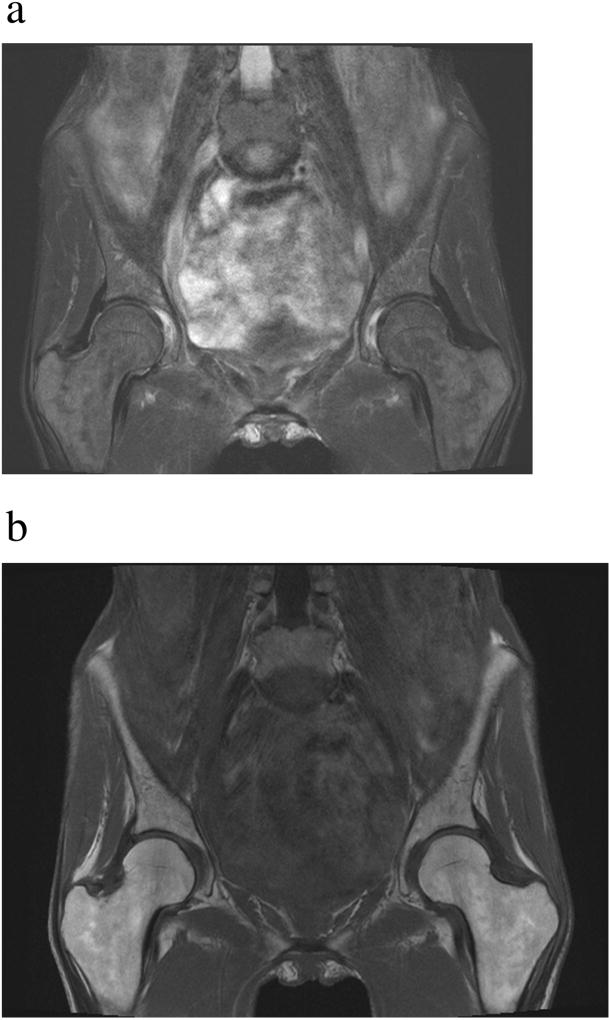
Bone marrow can also change its composition depending on nutrition or following therapy. In cases of undernutrition (phase II of starvation), subcutaneous and visceral adipose tissue is mobilized with a paradoxical increase in MAT [8]. MAT is relatively resistant to lipolysis until other available fat depots have been utilized. During late (phase III) starvation, MAT can be metabolized leading to gelatinous transformation or serous atrophy of bone marrow (SABM) in which MAT is replaced by hyaluronic acid-rich mucopolysaccarides associated with a significant decrease in the number and size of adipocytes (“atrophy”) and hematopoietic cells. SABM has a characteristic appearance on MRI with hypointense SI of marrow on T1- and hyperintense SI on fluid sensitive sequences [27] (Figure 4). Also, radiation therapy (Figure 5) and chemotherapy suppress the hematopoietic function of red marrow and increase the differentiation of mesenchymal stem cells toward the adipocyte lineage leading to increased MAT [28, 29].
Figure 4.
Serous atrophy of bone marrow in a patient with cancer cachexia. Coronal T1-weighted MR image of the pelvis (A) demonstrates hypointense (dark) marrow and subcutaneous fat (see Figure 2C for the normal appearance of marrow on T1-weighted images). Fat suppressed T2-weighted MR image of the pelvis (B) demonstrates abnormal hyperintense (bright) marrow and fat (see Figure 1B for the normal appearance of marrow on fat-suppressed T2-weighted images). Note the lack of subcutaneous fat in this patient with cachexia.
Figure 5.
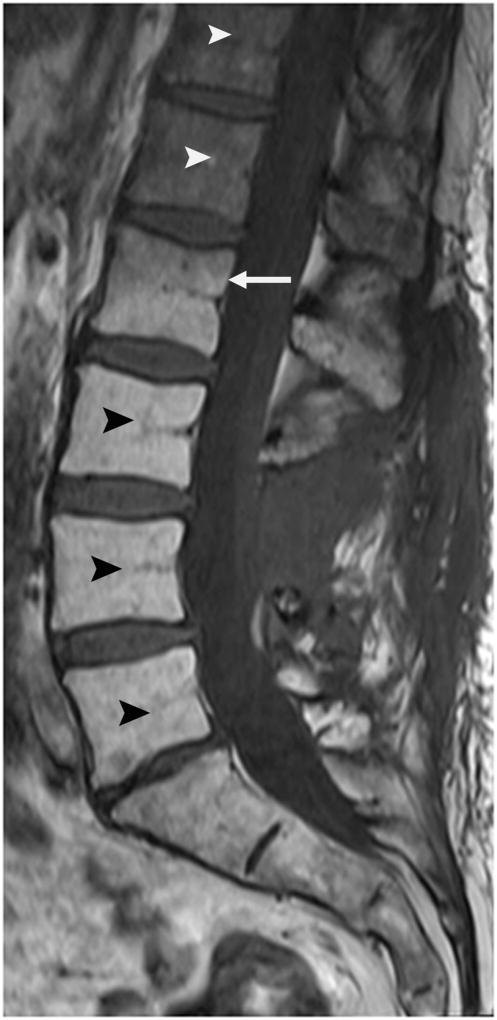
Post radiation changes of the lumbar spine. Sagittal T1-weighted MR image after radiation therapy demonstrates increased MAT content of the lumbar spine (black arrowheads) caudal to the radiation port (white arrow). Normal hematopoietic marrow is seen cranial to the radiation port (white arrowheads).
While T1-weighted MRI is primarily used in clinical practice to assess the physiologic or pathologic appearance of bone marrow, it has been used for semi-quantitative measurements of MAT volume [30]. MAT can be segmented in bones that contain primarily fatty marrow, such as the diaphysis of long bones, by using a single threshold level on the grey scale that is the same as subcutaneous adipose tissue. Inverse associations between MAT and BMD by DXA were found in healthy younger and older adults using this technique [30].
2.2. Water-fat imaging
Water-fat imaging, also referred to as chemical shift-encoding based water-fat imaging, Dixon method, fat fraction MRI, or iterative decomposition with echo asymmetry and least squares estimation (IDEAL), represents a MRI-based method that generates water and fat images. Separation of water and fat signal is based on the chemical shift difference between water and fat resonance frequencies and can provide a quantitative measurement of the signal fraction of both water and fat [31–35].
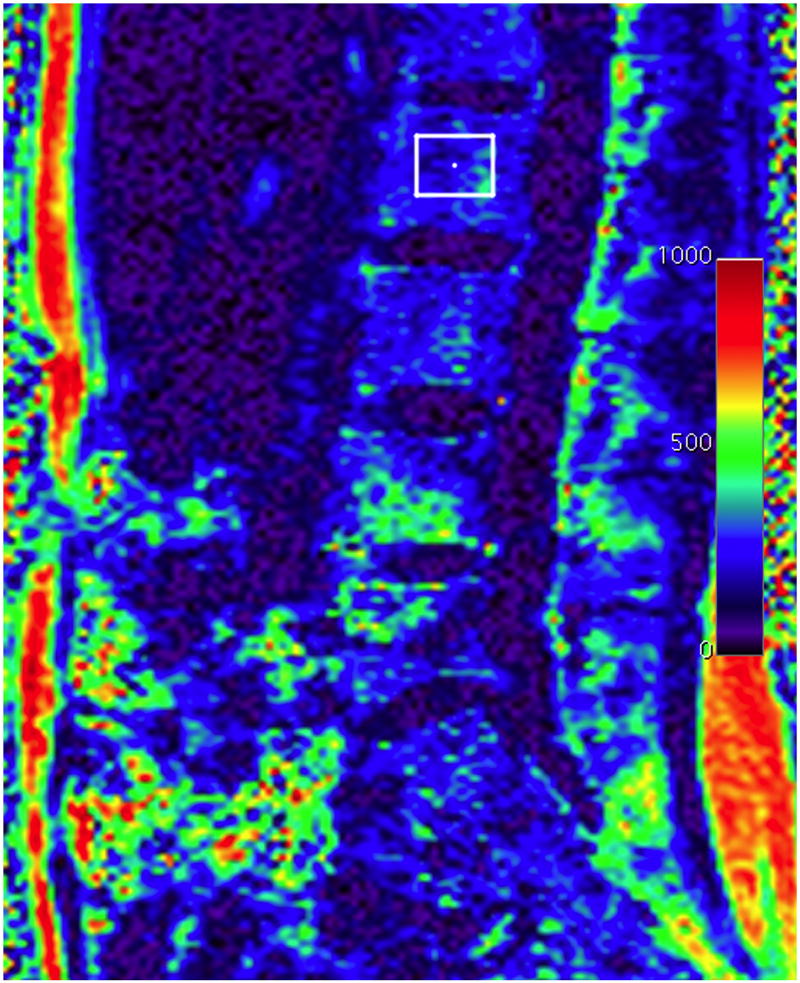
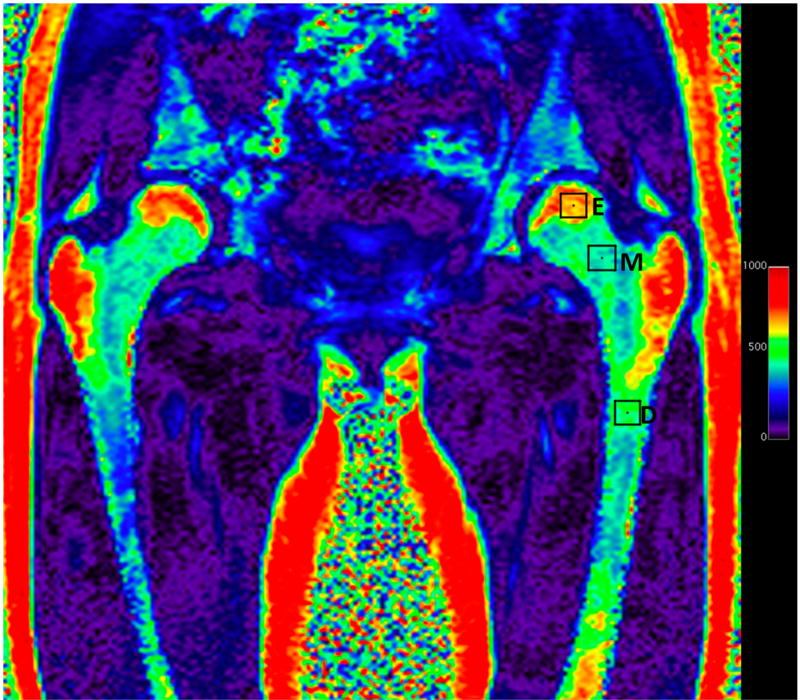
Water-fat imaging provides spatially resolved fat fraction maps, allowing for assessment of multiple vertebrae, pelvis or proximal femurs in a single acquisition. Water-fat imaging is especially useful in regions with heterogeneous red marrow distribution, such as the spine (Figure 6) or the proximal femur (Figure 7) [17, 36].
Figure 6.
Sagittal fat fraction map reconstructed from water and fat images of the lumbar spine. The fat fraction can be assessed by drawing a region of interest (square in the L2 vertebral body). Fat fraction of L2 was 27%. The color scale on the right side of the image is percent fat ×10−1.
Figure 7.
Coronal fat fraction map reconstructed from water and fat images of the pelvis showing fat content of different portions of the femur which can be assessed in a single examination by drawing different regions of interest (squares). The fat fraction of the epiphysis [E] was 68%, of the metaphysis [M] 41% and the subtrochanteric femoral diaphysis [D] was 48%. The color scale on the right side of the image is percent fat ×10−1.
An advantage of water-fat imaging is that it is its short acquisition time and availability with most fat-water sequences being commercially available on most MRI scanners [35, 37, 38]. However, several factors can affect MAT quantification using water-fat imaging, such as the presence of trabecular bone which shortens the T2* of water and fat components, thereby inducing a rapid decay of the measured gradient echo signal with echo time. This can be overcome by correcting for T2* decay effects [39, 40]. Furthermore, T1-bias [41, 42] and the presence of multiple peaks in the fat spectrum [41–44] can affect MAT quantification. Ex vivo studies comparing water-fat imaging with phantoms or trabecular bone specimens have shown excellent agreement between MRI-derived MAT quantification and histology [45–47]. MAT content assessed by water-fat imaging has also been shown to be highly correlated with proton MR spectroscopy (1H-MRS) [37, 39, 48]. The coefficient of variation (CV) for water-fat imaging to quantify MAT in the lumbar spine, pelvis and proximal femurs has been found to be low, ranging from 0.69% to 1.70% [38].
Several clinical studies have used water-fat imaging to quantify MAT. MAT by water-fat imaging has been shown to be inversely associated with BMD and cortical bone and positively associated with age in children and adults. MAT by water-fat imaging was higher in post-menopausal compared to premenopausal women and increased from the cervical to the lumbar spine [35, 38, 48, 50–52]. Furthermore, water-fat imaging can be used to assess changes in MAT content following chemo- and radiation therapy [28, 53, 54].
2.3. Proton MR spectroscopy
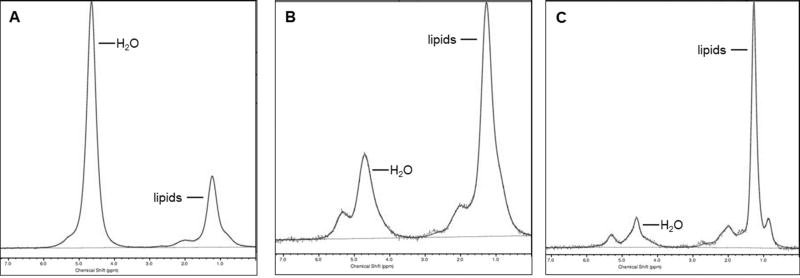
Single-voxel proton magnetic resonance spectroscopy (1H-MRS) is regarded as the gold standard for the quantification of MAT. It can provide both quantitative (fat fraction, FF) and qualitative (MAT composition) information. Point-resolved spectroscopy (PRESS) and stimulated echo acquisition mode (STEAM) single-voxel 1H-MRS pulse sequences can be employed to obtain fat spectra at various skeletal sites [17]. Using 1H-MRS, the signal within a voxel is divided into two major peaks, a lipid and a water peak and, using software, the area under the curve of the lipid and water peaks can be determined and the MAT lipid to water ratios or MAT FF can be calculated [55] (Figure 8). MAT content measured by 1H-MRS has been shown to correlate closely with MAT content from biopsies [56]. Moreover, MAT content by 1H-MRS in combination with BMD by dual energy x-ray absorptiometry (DXA) was more valuable than either parameter alone in evaluating skeletal integrity [57, 58].
Figure 8.
Quantification of marrow adipose tissue (MAT) by proton MR spectroscopy (1HMRS). 1H-MRS of the 2nd lumbar vertebra (A), proximal femoral metaphysis (B) and femoral diaphysis (C) in a premenopausal woman demonstrating increasing MAT content from the lumbar spine to the femoral diaphysis.
Much of the current data on 1H-MRS of MAT comes from the lumbar spine and proximal femurs. The coefficient of variation (CV) of vertebral MAT quantification by 1H-MRS was 1.7% when the scans were done after repositioning on the same day [59], while the CV for longitudinal studies at 6 weeks was 9.9% and at 6 months was 12.3% [60].
Several clinical studies have used 1H-MRS to determine physiological age- and sex-related changes in MAT content. In a study assessing MAT in healthy adult men and women, there were differential changes in MAT content in males and females with males showing decreases in the 4th decade while females showing an increase [61]. Griffith et al showed that males have higher MAT content most of their life than females with gradual increases throughout life in both sexes, however, there is a sharp increase in MAT content in females after menopause after which females have higher MAT content than males [62]. Thus, it is imperative to consider the age and sex related differences when interpreting changes in MAT and also for choosing appropriate controls for studies evaluating MAT content.
Pathologically higher MAT content by 1H-MRS has been demonstrated in osteoporotic states like anorexia nervosa, postmenopausal stage and obesity [8, 11, 63–65]. Young girls with anorexia nervosa had higher lumbar MAT content by 1H-MRS which correlated negatively with areal and volumetric lumbar spine BMD, trabecular bone microarchitecture and bone strength estimates at the weight bearing tibia [66]. Higher MAT at the knee by 1H-MRS in adolescent girls with severe anorexia has been demonstrated [67]. In another state of relative undernutrition and hypogonadism, the female athlete triad, spinal MAT by 1H-MRS was higher in athletes with irregular menses and was inversely associated with lumbar spine BMD [68]. Also, MAT content at the femoral diaphysis was an independent inverse predictor of volumetric BMD (as assessed by CT) in the hypogonadal female athlete [68]. The associations of higher MAT content with impaired trabecular microarchitecture was also observed in young survivors of allogenic stem cell transplants [69].
In adults, women with anorexia nervosa had higher MAT content by 1H-MRS both at the lumbar spine and at the femoral diaphysis compared to healthy controls and MAT was inversely associated with BMD [8]. In a study in women with anorexia nervosa, women who recovered from anorexia nervosa, and matched healthy controls, MAT content in women who recovered from anorexia nervosa was lower than in women with active disease and was comparable to normal weight controls [70]. The factors affecting MAT content in this state of undernutrition and altered hormonal milieu are still being investigated. However, there are data to link IGF-1, estrogen, leptin and preadipocyte factor -1 with MAT content [70].
On the other end on the spectrum, obesity, a state of overnutrition, MAT changes are variable and not well defined yet. The role of MAT as an endocrine organ affecting insulin resistance, serum lipids and bone health are actively under investigation and 1H-MRS is a helpful non-invasive technique for the assessment of MAT content in obesity and after interventions. Intramyocellular lipids and serum lipids have shown to be positively correlated with MAT in both men and women with obesity [11]. In women with obesity, higher visceral adipose tissue (VAT) was positively associated with MAT content [63]. In adult men with obesity, MAT was inversely associated with bone microarchitecture and mechanical properties of bone [71]. Studies evaluating the longitudinal changes in MAT content after bariatric surgery have shown an increase of MAT after sleeve gastrectomy [72]. In a study evaluating patients after Roux-en-Y gastric bypass, changes in MAT were dependent on the diabetes status of the individual and were affected by the degree of weight loss and improvements in hemoglobin A1C [73]. In premenopausal women with obesity, replacement with growth hormone for six months increased MAT content which was associated with higher bone turnover and may support the concept that MAT may serve as an energy source during bone formation [74].
Increases in MAT content by 1H-MRS have also been observed in states of low gonadal hormones. Longitudinal one year follow-up of treated males with prostate cancer and androgen deficiency suggested an increase in MAT at the lower spine and the degree of increases was associated with subsequent deterioration in BMD by DXA [75]. Similarly, bilateral oophorectomy led to a sharp decline in lumbar BMD as measured by CT with a concomitant increase in MAT content by 1H-MRS [76].
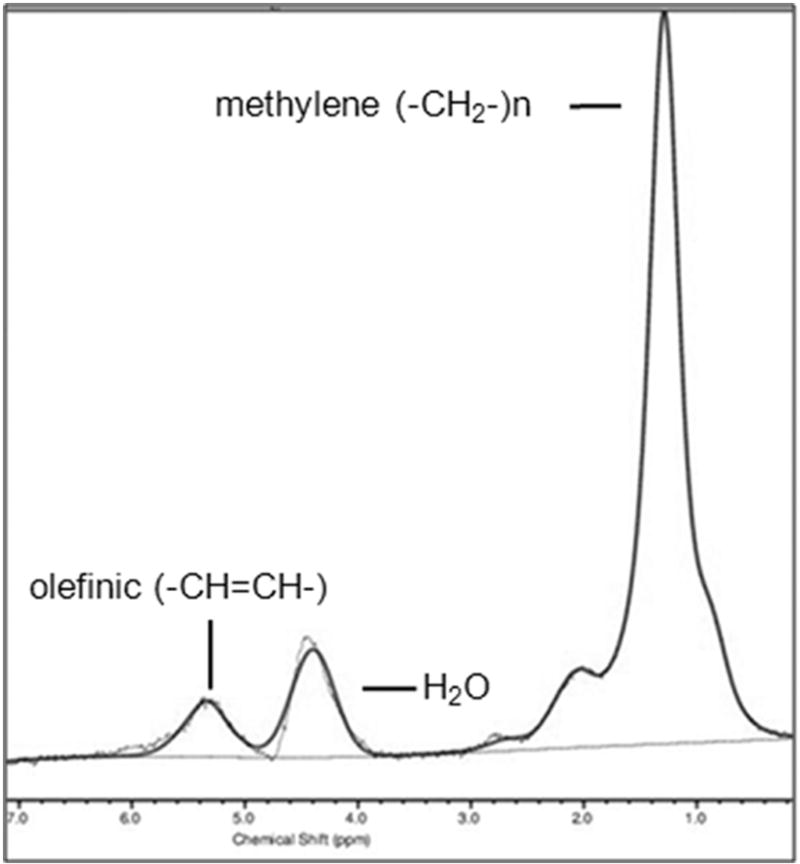
1H-MRS can not only quantify the amount of MAT but also assess its composition, such as the amount of unsaturated and saturated lipids [77], which may serve as biomarkers of skeletal integrity [78, 79]. Marrow fatty acids can be characterized based on the number of double bonds that they carry. Higher magnetic field strengths allow the visualization of additional lipid peaks of fatty acid saturation and unsaturation estimates: olefinic protons at 5.2 and 5.3 ppm (-CH=CH-), an estimate of fatty acid unsaturated bonds; methylene protons at 1.3 ppm [(-CH2-)n], an estimate of fatty acids saturated bonds; allylic methylene protons at 2.0 ppm (-CH=CH-CH2-); methyl protons at 0.9 ppm (-CH3); and methylene protons β to carbonyl at 1.6 ppm (-CH2-O-CO-CH2-CH2-). The degree of unsaturation can be determined by the unsaturation index (UI), a ratio between the olefinic resonance at 5.2 and 5.3 ppm and total lipid content [78, 79]. However, susceptibility effects from the trabecular bone can cause significant overlap of water and olefinic peaks, presenting a technical challenge for quantification of lipid unsaturation, especially in the presence of a strong water peak, which is often observed in the spine, especially in premenopausal women [16, 39]. Therefore, water suppression has been applied to resolve the water and olefinic peaks (Figure 9) [15]. Furthermore, it is important to note that 1H-MRS is not able to resolve individual fatty acids. Also, while the methylene signal at 1.3 ppm is used as a marker for fatty acid saturation, this signal is not exclusive to saturated fatty acids.
Figure 9.
Composition of marrow adipose tissue (MAT). Proton MR spectroscopy (1H-MRS) of the 2nd lumbar vertebra obtained with water suppression demonstrates combined olefinic protons at 5.2 and 5.3 ppm (-CH=CH-, an estimate of fatty acid unsaturated bonds) and methylene protons at 1.3 ppm [(-CH2-)n, an estimate of fatty acids saturated bonds]. Residual water (H2O) is noted at 4.7 ppm.
Clinical studies have assessed MAT composition to determine markers of skeletal fragility and metabolic risk. MAT unsaturation assessed by 1H-MRS was lower in patients with T2DM as compared with non-diabetic older women [80]. Also, patients with morbid obesity and T2DM had lower MAT unsaturation compared to non-diabetic subjects with morbid obesity [15]. These studies suggest that MAT composition may serve as a biomarker for metabolic risk. In a study in older women by Patsch et al, MAT unsaturation was inversely related to the prevalence of fragility fractures [78]. In women with anorexia nervosa, femoral MAT composition was similar to that of normal-weight controls [81], however, the degree of saturation was inversely associated with BMD which may suggest a differential effect of saturated vs. unsaturated fatty acids with saturated fatty acids having a more detrimental effect on bone [81].
3. CT-based techniques
3.1. Single-energy CT
Computed tomography (CT) uses x-rays to obtain images based on different attenuation of tissues. The density of the tissue passed by the x-ray beam can be assessed by the attenuation coefficient, a measure of how easily a material can be penetrated by an x-ray beam. The CT density of tissue is expressed in Hounsfield Units (HU), obtained from a linear transformation of attenuation coefficients based on the arbitrary definitions of air (−1000 HU) and water (0 HU). On this scale, fat has a density of −60 to−120 HU [82].
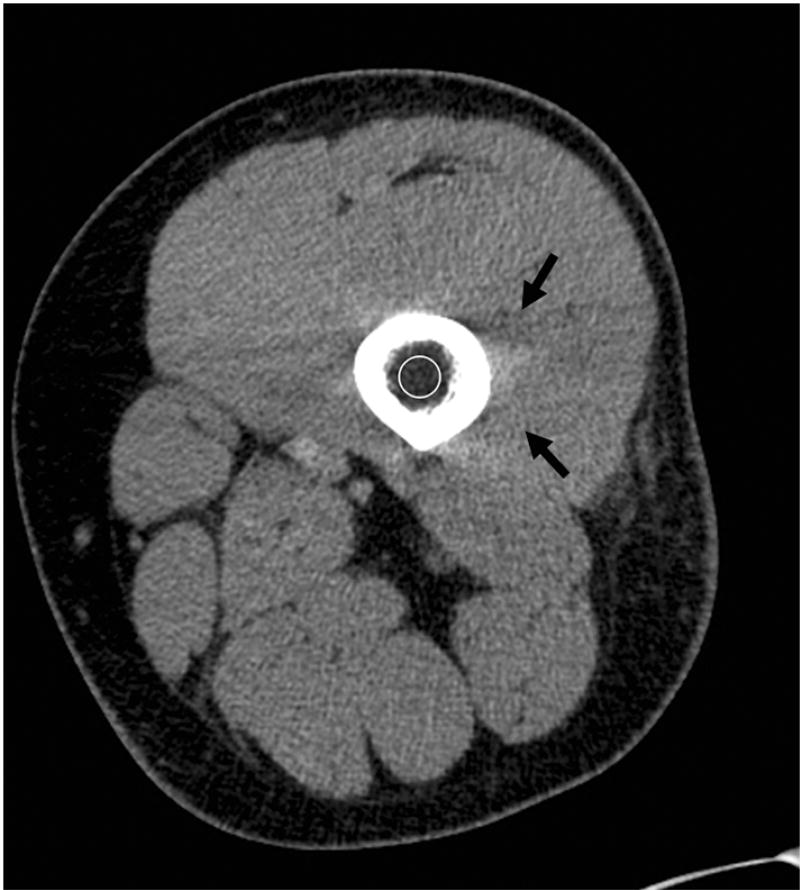
The bone marrow cavity is comprised of hematopoietic and fatty tissue and trabecular bone. Therefore, attenuation measurements of the bone marrow cavity include a mixture of the three tissues and do not allow for quantification of MAT. However, the lower the HU, the higher the fat content. A common CT artifact encountered when assessing the marrow cavity of long bones is beam hardening artifact caused by the cortical bone (Figure 10). Beam hardening artifact refers to the preferential loss of lower-energy photons from the x-ray beam with resultant alterations of the attenuation profile [83].
Figure 10.
Single energy axial CT of the thigh showing low attenuation (circle) of the femoral marrow cavity, measuring −47 Hounsfield Units. Beam hardening artifact, as indicated by dark streaks, from the dense cortical bone is present (black arrows).
Di Iorgi et al used CT attenuation measurements of the mid femoral diaphysis in young healthy adults. The mid diaphyseal shaft contains no trabecular bone and is composed predominately of MAT [18–20]. In young healthy adolescents and young adults, MAT, assessed by CT attenuation measurements, was not associated with visceral or subcutaneous abdominal adipose tissue and was not associated with markers of cardiovascular risk, suggesting that MAT is an independent fat compartment with different metabolic function [20]. In different studies, using the same CT technique, MAT was inversely associated with cortical femoral bone area in young healthy women [18] and inversely associated with vertebral bone density and femoral cortical bone area in adolescent and young adult males and females [19].
3.2. Dual-energy CT
Dual-energy CT (DECT) can provide additional information on tissue composition compared to SECT. In SECT, materials that have different chemical compositions can have similar density (HU), making the differentiation of different types of tissues challenging. The measured CT number of a specific tissue is related to the linear attenuation coefficient which is not unique for any given tissue but rather represents a function of the tissue composition, the photon energies interacting with the tissue, and the mass density of the tissue. DECT uses two x-ray beams at high and low tube voltage (typically at 140 kV and 80 kV) to further characterize the composition of tissues. The differences in attenuation between the high and low energy beams are the basis for which DECT identifies the composition of different tissues [84].
Initially DECT involved the acquisition of two separate sequential CT scans at the two energies resulting in double the scan time and radiation dose of a SECT. However, with the advent of dual-source CT scanners and advances in CT technology which allow for rapid acquisition, noise reduction, and lower radiation exposure, DECT has become a clinically feasible technique [85].
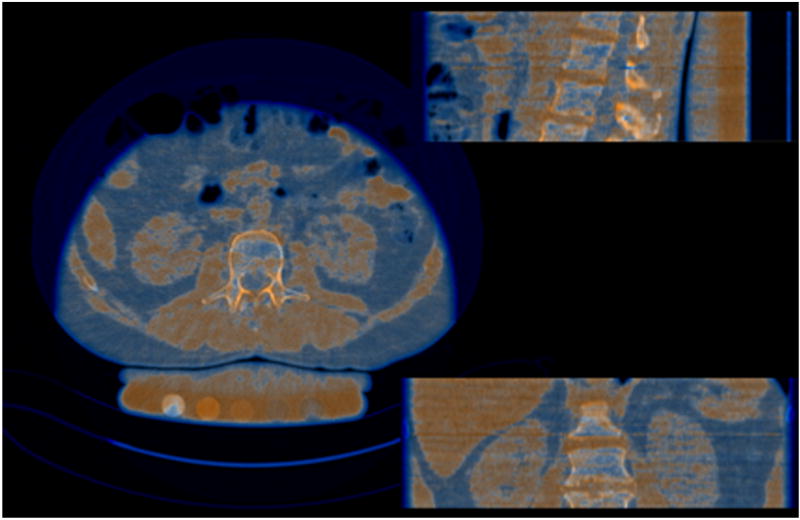
DECT for the assessment of MAT has been used since the 1980s but was limited by the long acquisition times and high radiation dose [86, 87]. Recent studies in healthy volunteers and cadavers using more advanced CT scanners and techniques to reduce noise and radiation exposure, have quantified MAT content (Figure 11) that correlated closely with MAT by 1H-MRS and histology [21, 46, 88]. An advantage of DECT over other techniques is the assessment of BMD and MAT content in a single examination. Moreover, studies have suggested that intravertebral MAT can affect the accuracy of BMD measurements obtained by SECT [89], therefore, the assessment of MAT by DECT is important for the accurate assessment of BMD in states in increased marrow adiposity. A recent study comparing SECT and DECT for assessment of BMD found that the presence of MAT lead to underestimation of BMD and this bias increased with increasing MAT content. Therefore, DECT could be used to correct for MAT, thereby providing more accurate assessment of BMD compared with SDCT [21, 22].
Figure 11.
Overlay images from dual energy CT of L2. Orange indicates red marrow and blue indicates fatty marrow.
DECT has been used to assess vertebral MAT content in patients with anorexia nervosa and Cushing syndrome. MAT content was elevated in women with anorexia nervosa compared to healthy controls but not in patients with Cushing syndrome [90]. Hui et al used DECT to assess MAT and BMD in patients with gynecologic malignancies treated with oophorectomy, radiation therapy or chemotherapy. DECT showed an increase in MAT and decrease in BMD after therapy. Of importance, an inverse association between MAT and BMD observed prior to therapy was attenuated after therapy, suggesting that MAT and BMD cannot be used interchangeable to monitor bone health after cancer therapy [28].
4. Conclusion
Recent interest in the role of MAT and its relationship to bone lineage and skeletal fragility has led to the development of non-invasive imaging techniques to assess the quantity and composition of MAT. MRI-based quantitative techniques, such as water-fat imaging and 1H-MRS have helped in determining mechanisms of increased skeletal fragility and metabolic risk associated with several clinical conditions, such as aging, anorexia nervosa, the female athlete triad, obesity and T2DM. CT, especially DECT, can assess MAT and BMD in a single examination but is associated with ionizing radiation. With the increased availability of DECT scanners and advances in CT technology to lower radiation dose, DECT could become an powerful technique to assess MAT and BMD in CTs obtained for other clinical purposes.
Highlights.
Marrow adipose tissue can be assessed non-invasively using MRI- and CT-based imaging technologies.
Proton MR spectroscopy can determine the quantity and composition of marrow adipose tissue.
Water-fat imaging allows marrow adipose tissue assessment of different skeletal regions in a single examination.
Dual-energy CT can assess both bone mineral density and marrow adipose tissue in the same examination.
Acknowledgments
Funding: This work was supported by National Institutes of Health (NIH) Grants K24DK109940, R24DK084970, R01DK103946, R01DK095792
Footnotes
Publisher's Disclaimer: This is a PDF file of an unedited manuscript that has been accepted for publication. As a service to our customers we are providing this early version of the manuscript. The manuscript will undergo copyediting, typesetting, and review of the resulting proof before it is published in its final citable form. Please note that during the production process errors may be discovered which could affect the content, and all legal disclaimers that apply to the journal pertain.
Disclosures: The authors do not have any conflicts of interests to disclose.
References
- 1.Osteoporosis prevention, diagnosis, and therapy. NIH Consens Statement. 2000;17(1):1–45. [PubMed] [Google Scholar]
- 2.Gimble JM, et al. Playing with bone and fat. J Cell Biochem. 2006;98(2):251–66. doi: 10.1002/jcb.20777. [DOI] [PubMed] [Google Scholar]
- 3.Pino AM, et al. Qualitative Aspects of Bone Marrow Adiposity in Osteoporosis. Front Endocrinol (Lausanne) 2016;7:139. doi: 10.3389/fendo.2016.00139. [DOI] [PMC free article] [PubMed] [Google Scholar]
- 4.Rendina-Ruedy E, Rosen CJ. Bone-Fat Interaction. Endocrinol Metab Clin North Am. 2017;46(1):41–50. doi: 10.1016/j.ecl.2016.09.004. [DOI] [PMC free article] [PubMed] [Google Scholar]
- 5.Devlin MJ, Rosen CJ. The bone-fat interface: basic and clinical implications of marrow adiposity. Lancet Diabetes Endocrinol. 2015;3(2):141–7. doi: 10.1016/S2213-8587(14)70007-5. [DOI] [PMC free article] [PubMed] [Google Scholar]
- 6.Fazeli PK, et al. Marrow fat and bone--new perspectives. J Clin Endocrinol Metab. 2013;98(3):935–45. doi: 10.1210/jc.2012-3634. [DOI] [PMC free article] [PubMed] [Google Scholar]
- 7.Cordes C, et al. MR-detected changes in liver fat, abdominal fat, and vertebral bone marrow fat after a four-week calorie restriction in obese women. J Magn Reson Imaging. 2015;42(5):1272–80. doi: 10.1002/jmri.24908. [DOI] [PubMed] [Google Scholar]
- 8.Bredella MA, et al. Increased bone marrow fat in anorexia nervosa. J Clin Endocrinol Metab. 2009;94(6):2129–36. doi: 10.1210/jc.2008-2532. [DOI] [PMC free article] [PubMed] [Google Scholar]
- 9.Pop LM, et al. Impact of pioglitazone on bone mineral density and bone marrow fat content. Osteoporos Int. 2017 doi: 10.1007/s00198-017-4164-3. [DOI] [PubMed] [Google Scholar]
- 10.Singhal V, et al. Impaired bone strength estimates at the distal tibia and its determinants in adolescents with anorexia nervosa. Bone. 2017 doi: 10.1016/j.bone.2017.07.009. [DOI] [PMC free article] [PubMed] [Google Scholar]
- 11.Bredella MA, et al. Ectopic and serum lipid levels are positively associated with bone marrow fat in obesity. Radiology. 2013;269(2):534–41. doi: 10.1148/radiol.13130375. [DOI] [PMC free article] [PubMed] [Google Scholar]
- 12.Bonds DE, et al. Risk of fracture in women with type 2 diabetes: the Women's Health Initiative Observational Study. J Clin Endocrinol Metab. 2006;91(9):3404–10. doi: 10.1210/jc.2006-0614. [DOI] [PubMed] [Google Scholar]
- 13.Dytfeld J, Michalak M. Type 2 diabetes and risk of low-energy fractures in postmenopausal women: meta-analysis of observational studies. Aging Clin Exp Res. 2017;29(2):301–309. doi: 10.1007/s40520-016-0562-1. [DOI] [PMC free article] [PubMed] [Google Scholar]
- 14.Melton LJ, 3rd, et al. A bone structural basis for fracture risk in diabetes. J Clin Endocrinol Metab. 2008;93(12):4804–9. doi: 10.1210/jc.2008-0639. [DOI] [PMC free article] [PubMed] [Google Scholar]
- 15.Yu EW, et al. Marrow adipose tissue composition in adults with morbid obesity. Bone. 2017;97:38–42. doi: 10.1016/j.bone.2016.12.018. [DOI] [PMC free article] [PubMed] [Google Scholar]
- 16.Cordes C, et al. MR-Based Assessment of Bone Marrow Fat in Osteoporosis, Diabetes, and Obesity. Front Endocrinol (Lausanne) 2016;7:74. doi: 10.3389/fendo.2016.00074. [DOI] [PMC free article] [PubMed] [Google Scholar]
- 17.Karampinos DC, et al. Quantitative MRI and spectroscopy of bone marrow. J Magn Reson Imaging. 2017 doi: 10.1002/jmri.25769. [DOI] [PMC free article] [PubMed] [Google Scholar]
- 18.Di Iorgi N, et al. Bone acquisition in healthy young females is reciprocally related to marrow adiposity. J Clin Endocrinol Metab. 2010;95(6):2977–82. doi: 10.1210/jc.2009-2336. [DOI] [PMC free article] [PubMed] [Google Scholar]
- 19.Di Iorgi N, et al. Reciprocal relation between marrow adiposity and the amount of bone in the axial and appendicular skeleton of young adults. J Clin Endocrinol Metab. 2008;93(6):2281–6. doi: 10.1210/jc.2007-2691. [DOI] [PMC free article] [PubMed] [Google Scholar]
- 20.Di Iorgi N, Mittelman SD, Gilsanz V. Differential effect of marrow adiposity and visceral and subcutaneous fat on cardiovascular risk in young, healthy adults. Int J Obes (Lond) 2008;32(12):1854–60. doi: 10.1038/ijo.2008.170. [DOI] [PMC free article] [PubMed] [Google Scholar]
- 21.Bredella MA, et al. Marrow Adipose Tissue Quantification of the Lumbar Spine by Using Dual-Energy CT and Single-Voxel (1)H MR Spectroscopy: A Feasibility Study. Radiology. 2015;277(1):230–5. doi: 10.1148/radiol.2015142876. [DOI] [PMC free article] [PubMed] [Google Scholar]
- 22.Arentsen L, et al. Use of dual-energy computed tomography to measure skeletal-wide marrow composition and cancellous bone mineral density. J Bone Miner Metab. 2017;35(4):428–436. doi: 10.1007/s00774-016-0796-1. [DOI] [PMC free article] [PubMed] [Google Scholar]
- 23.Delikatny EJ, et al. MR-visible lipids and the tumor microenvironment. NMR Biomed. 2011;24(6):592–611. doi: 10.1002/nbm.1661. [DOI] [PMC free article] [PubMed] [Google Scholar]
- 24.Vande Berg BC, et al. Magnetic resonance imaging of normal bone marrow. Eur Radiol. 1998;8(8):1327–34. doi: 10.1007/s003300050547. [DOI] [PubMed] [Google Scholar]
- 25.Kricun ME. Red-yellow marrow conversion: its effect on the location of some solitary bone lesions. Skeletal Radiol. 1985;14(1):10–9. doi: 10.1007/BF00361188. [DOI] [PubMed] [Google Scholar]
- 26.Piney A. Marrow biopsy. Br Med J. 1947;1(4501):504. doi: 10.1136/bmj.1.4501.504-a. [DOI] [PMC free article] [PubMed] [Google Scholar]
- 27.Boutin RD, et al. MRI findings of serous atrophy of bone marrow and associated complications. Eur Radiol. 2015;25(9):2771–8. doi: 10.1007/s00330-015-3692-5. [DOI] [PubMed] [Google Scholar]
- 28.Hui SK, et al. A phase I feasibility study of multi-modality imaging assessing rapid expansion of marrow fat and decreased bone mineral density in cancer patients. Bone. 2015;73:90–7. doi: 10.1016/j.bone.2014.12.014. [DOI] [PMC free article] [PubMed] [Google Scholar]
- 29.Li J, et al. Differential damage and recovery of human mesenchymal stem cells after exposure to chemotherapeutic agents. Br J Haematol. 2004;127(3):326–34. doi: 10.1111/j.1365-2141.2004.05200.x. [DOI] [PubMed] [Google Scholar]
- 30.Shen W, et al. MRI-measured pelvic bone marrow adipose tissue is inversely related to DXA-measured bone mineral in younger and older adults. Eur J Clin Nutr. 2012;66(9):983–8. doi: 10.1038/ejcn.2012.35. [DOI] [PMC free article] [PubMed] [Google Scholar]
- 31.Ma J. Dixon techniques for water and fat imaging. J Magn Reson Imaging. 2008;28(3):543–58. doi: 10.1002/jmri.21492. [DOI] [PubMed] [Google Scholar]
- 32.Reeder SB, et al. Water-fat separation with IDEAL gradient-echo imaging. J Magn Reson Imaging. 2007;25(3):644–52. doi: 10.1002/jmri.20831. [DOI] [PubMed] [Google Scholar]
- 33.Reeder SB, Hu HH, Sirlin CB. Proton density fat-fraction: a standardized MR-based biomarker of tissue fat concentration. J Magn Reson Imaging. 2012;36(5):1011–4. doi: 10.1002/jmri.23741. [DOI] [PMC free article] [PubMed] [Google Scholar]
- 34.Reeder SB, et al. Multicoil Dixon chemical species separation with an iterative least-squares estimation method. Magn Reson Med. 2004;51(1):35–45. doi: 10.1002/mrm.10675. [DOI] [PubMed] [Google Scholar]
- 35.Baum T, et al. Assessment of whole spine vertebral bone marrow fat using chemical shift-encoding based water-fat MRI. J Magn Reson Imaging. 2015;42(4):1018–23. doi: 10.1002/jmri.24854. [DOI] [PubMed] [Google Scholar]
- 36.Le Ster C, et al. A fast method for the quantification of fat fraction and relaxation times: Comparison of five sites of bone marrow. Magn Reson Imaging. 2017;39:157–161. doi: 10.1016/j.mri.2017.03.001. [DOI] [PubMed] [Google Scholar]
- 37.Shen W, et al. Comparison among T1-weighted magnetic resonance imaging, modified dixon method, and magnetic resonance spectroscopy in measuring bone marrow fat. J Obes. 2013;2013:298675. doi: 10.1155/2013/298675. [DOI] [PMC free article] [PubMed] [Google Scholar]
- 38.Aoki T, et al. Quantification of bone marrow fat content using iterative decomposition of water and fat with echo asymmetry and least-squares estimation (IDEAL): reproducibility, site variation and correlation with age and menopause. Br J Radiol. 2016;89(1065):20150538. doi: 10.1259/bjr.20150538. [DOI] [PMC free article] [PubMed] [Google Scholar]
- 39.Karampinos DC, et al. Bone marrow fat quantification in the presence of trabecular bone: initial comparison between water-fat imaging and single-voxel MRS. Magn Reson Med. 2014;71(3):1158–65. doi: 10.1002/mrm.24775. [DOI] [PMC free article] [PubMed] [Google Scholar]
- 40.Karampinos DC, et al. Modeling of T2* decay in vertebral bone marrow fat quantification. NMR Biomed. 2015;28(11):1535–42. doi: 10.1002/nbm.3420. [DOI] [PubMed] [Google Scholar]
- 41.Karampinos DC, et al. T(1)-corrected fat quantification using chemical shift-based water/fat separation: application to skeletal muscle. Magn Reson Med. 2011;66(5):1312–26. doi: 10.1002/mrm.22925. [DOI] [PMC free article] [PubMed] [Google Scholar]
- 42.Liu CY, et al. Fat quantification with IDEAL gradient echo imaging: correction of bias from T(1) and noise. Magn Reson Med. 2007;58(2):354–64. doi: 10.1002/mrm.21301. [DOI] [PubMed] [Google Scholar]
- 43.Yu H, et al. Multiecho reconstruction for simultaneous water-fat decomposition and T2* estimation. J Magn Reson Imaging. 2007;26(4):1153–61. doi: 10.1002/jmri.21090. [DOI] [PubMed] [Google Scholar]
- 44.Yu H, et al. Multiecho water-fat separation and simultaneous R2* estimation with multifrequency fat spectrum modeling. Magn Reson Med. 2008;60(5):1122–34. doi: 10.1002/mrm.21737. [DOI] [PMC free article] [PubMed] [Google Scholar]
- 45.Gee CS, et al. Validation of bone marrow fat quantification in the presence of trabecular bone using MRI. J Magn Reson Imaging. 2015;42(2):539–44. doi: 10.1002/jmri.24795. [DOI] [PMC free article] [PubMed] [Google Scholar]
- 46.Arentsen L, et al. Validation of marrow fat assessment using noninvasive imaging with histologic examination of human bone samples. Bone. 2015;72:118–22. doi: 10.1016/j.bone.2014.11.002. [DOI] [PMC free article] [PubMed] [Google Scholar]
- 47.MacEwan IJ, et al. Proton density water fraction as a biomarker of bone marrow cellularity: validation in ex vivo spine specimens. Magn Reson Imaging. 2014;32(9):1097–101. doi: 10.1016/j.mri.2014.03.005. [DOI] [PubMed] [Google Scholar]
- 48.Ruschke S, et al. Measurement of vertebral bone marrow proton density fat fraction in children using quantitative water-fat MRI. MAGMA. 2017 doi: 10.1007/s10334-017-0617-0. [DOI] [PubMed] [Google Scholar]
- 49.Schwartz AV, et al. Vertebral bone marrow fat associated with lower trabecular BMD and prevalent vertebral fracture in older adults. J Clin Endocrinol Metab. 2013;98(6):2294–300. doi: 10.1210/jc.2012-3949. [DOI] [PMC free article] [PubMed] [Google Scholar]
- 50.Li GW, et al. Quantitative evaluation of vertebral marrow adipose tissue in postmenopausal female using MRI chemical shift-based water-fat separation. Clin Radiol. 2014;69(3):254–62. doi: 10.1016/j.crad.2013.10.005. [DOI] [PubMed] [Google Scholar]
- 51.Wren TA, et al. Bone marrow fat is inversely related to cortical bone in young and old subjects. J Clin Endocrinol Metab. 2011;96(3):782–6. doi: 10.1210/jc.2010-1922. [DOI] [PubMed] [Google Scholar]
- 52.Kuhn JP, et al. Proton-density fat fraction and simultaneous R2* estimation as an MRI tool for assessment of osteoporosis. Eur Radiol. 2013;23(12):3432–9. doi: 10.1007/s00330-013-2950-7. [DOI] [PMC free article] [PubMed] [Google Scholar]
- 53.Bolan PJ, et al. Water-fat MRI for assessing changes in bone marrow composition due to radiation and chemotherapy in gynecologic cancer patients. J Magn Reson Imaging. 2013;38(6):1578–84. doi: 10.1002/jmri.24071. [DOI] [PMC free article] [PubMed] [Google Scholar]
- 54.Carmona R, et al. Fat composition changes in bone marrow during chemotherapy and radiation therapy. Int J Radiat Oncol Biol Phys. 2014;90(1):155–63. doi: 10.1016/j.ijrobp.2014.05.041. [DOI] [PMC free article] [PubMed] [Google Scholar]
- 55.Schick F, et al. Volume-selective proton MRS in vertebral bodies. Magn Reson Med. 1992;26(2):207–17. doi: 10.1002/mrm.1910260203. [DOI] [PubMed] [Google Scholar]
- 56.Cohen A, et al. Marrow adiposity assessed on transiliac crest biopsy samples correlates with noninvasive measurement of marrow adiposity by proton magnetic resonance spectroscopy ((1)H-MRS) at the spine but not the femur. Osteoporos Int. 2015;26(10):2471–8. doi: 10.1007/s00198-015-3161-7. [DOI] [PMC free article] [PubMed] [Google Scholar]
- 57.Schellinger D, et al. Potential value of vertebral proton MR spectroscopy in determining bone weakness. AJNR Am J Neuroradiol. 2001;22(8):1620–7. [PMC free article] [PubMed] [Google Scholar]
- 58.Schellinger D, et al. Bone marrow fat and bone mineral density on proton MR spectroscopy and dual-energy X-ray absorptiometry: their ratio as a new indicator of bone weakening. AJR Am J Roentgenol. 2004;183(6):1761–5. doi: 10.2214/ajr.183.6.01831761. [DOI] [PubMed] [Google Scholar]
- 59.Li X, et al. Quantification of vertebral bone marrow fat content using 3 Tesla MR spectroscopy: reproducibility, vertebral variation, and applications in osteoporosis. J Magn Reson Imaging. 2011;33(4):974–9. doi: 10.1002/jmri.22489. [DOI] [PMC free article] [PubMed] [Google Scholar]
- 60.Singhal V, et al. Short- and long-term reproducibility of marrow adipose tissue quantification by 1H-MR spectroscopy. Skeletal Radiol. 2016;45(2):221–5. doi: 10.1007/s00256-015-2292-4. [DOI] [PMC free article] [PubMed] [Google Scholar]
- 61.Roldan-Valadez E, et al. Gender and age groups interactions in the quantification of bone marrow fat content in lumbar spine using 3T MR spectroscopy: a multivariate analysis of covariance (Mancova) Eur J Radiol. 2013;82(11):e697–702. doi: 10.1016/j.ejrad.2013.07.012. [DOI] [PubMed] [Google Scholar]
- 62.Griffith JF, et al. Bone marrow fat content in the elderly: a reversal of sex difference seen in younger subjects. J Magn Reson Imaging. 2012;36(1):225–30. doi: 10.1002/jmri.23619. [DOI] [PubMed] [Google Scholar]
- 63.Bredella MA, et al. Vertebral bone marrow fat is positively associated with visceral fat and inversely associated with IGF-1 in obese women. Obesity (Silver Spring) 2011;19(1):49–53. doi: 10.1038/oby.2010.106. [DOI] [PMC free article] [PubMed] [Google Scholar]
- 64.Griffith JF, et al. Vertebral bone mineral density, marrow perfusion, and fat content in healthy men and men with osteoporosis: dynamic contrast-enhanced MR imaging and MR spectroscopy. Radiology. 2005;236(3):945–51. doi: 10.1148/radiol.2363041425. [DOI] [PubMed] [Google Scholar]
- 65.Griffith JF, et al. Vertebral marrow fat content and diffusion and perfusion indexes in women with varying bone density: MR evaluation. Radiology. 2006;241(3):831–8. doi: 10.1148/radiol.2413051858. [DOI] [PubMed] [Google Scholar]
- 66.Singhal V, et al. Impaired bone strength estimates at the distal tibia and its determinants in adolescents with anorexia nervosa. Bone. 2017;106:61–68. doi: 10.1016/j.bone.2017.07.009. [DOI] [PMC free article] [PubMed] [Google Scholar]
- 67.Ecklund K, et al. Bone marrow fat content in 70 adolescent girls with anorexia nervosa: Magnetic resonance imaging and magnetic resonance spectroscopy assessment. Pediatr Radiol. 2017;47(8):952–962. doi: 10.1007/s00247-017-3856-3. [DOI] [PMC free article] [PubMed] [Google Scholar]
- 68.Singhal V, et al. Regional fat depots and their relationship to bone density and microarchitecture in young oligo-amenorrheic athletes. Bone. 2015;77:83–90. doi: 10.1016/j.bone.2015.04.005. [DOI] [PMC free article] [PubMed] [Google Scholar]
- 69.Mostoufi-Moab S, et al. Adverse Fat Depots and Marrow Adiposity Are Associated With Skeletal Deficits and Insulin Resistance in Long-Term Survivors of Pediatric Hematopoietic Stem Cell Transplantation. J Bone Miner Res. 2015;30(9):1657–66. doi: 10.1002/jbmr.2512. [DOI] [PMC free article] [PubMed] [Google Scholar]
- 70.Fazeli PK, et al. Preadipocyte factor-1 is associated with marrow adiposity and bone mineral density in women with anorexia nervosa. J Clin Endocrinol Metab. 2010;95(1):407–13. doi: 10.1210/jc.2009-1152. [DOI] [PMC free article] [PubMed] [Google Scholar]
- 71.Bredella MA, et al. Determinants of bone microarchitecture and mechanical properties in obese men. J Clin Endocrinol Metab. 2012;97(11):4115–22. doi: 10.1210/jc.2012-2246. [DOI] [PMC free article] [PubMed] [Google Scholar]
- 72.Bredella MA, et al. Effects of Roux-en-Y gastric bypass and sleeve gastrectomy on bone mineral density and marrow adipose tissue. Bone. 2017;95:85–90. doi: 10.1016/j.bone.2016.11.014. [DOI] [PMC free article] [PubMed] [Google Scholar]
- 73.Kim TY, et al. Bone Marrow Fat Changes After Gastric Bypass Surgery Are Associated With Loss of Bone Mass. J Bone Miner Res. 2017;32(11):2239–2247. doi: 10.1002/jbmr.3212. [DOI] [PMC free article] [PubMed] [Google Scholar]
- 74.Bredella MA, et al. Effects of growth hormone administration for 6 months on bone turnover and bone marrow fat in obese premenopausal women. Bone. 2014;62:29–35. doi: 10.1016/j.bone.2014.01.022. [DOI] [PMC free article] [PubMed] [Google Scholar]
- 75.Martin J, et al. Spinal multiparametric MRI and DEXA changes over time in men with prostate cancer treated with androgen deprivation therapy: a potential imaging biomarker of treatment toxicity. Eur Radiol. 2017;27(3):995–1003. doi: 10.1007/s00330-016-4434-z. [DOI] [PubMed] [Google Scholar]
- 76.Wang YX, et al. Rapid increase in marrow fat content and decrease in marrow perfusion in lumbar vertebra following bilateral oophorectomy: an MR imaging-based prospective longitudinal study. Korean J Radiol. 2015;16(1):154–9. doi: 10.3348/kjr.2015.16.1.154. [DOI] [PMC free article] [PubMed] [Google Scholar]
- 77.Ren J, et al. Composition of adipose tissue and marrow fat in humans by 1H NMR at 7 Tesla. J Lipid Res. 2008;49(9):2055–62. doi: 10.1194/jlr.D800010-JLR200. [DOI] [PMC free article] [PubMed] [Google Scholar]
- 78.Patsch JM, et al. Bone marrow fat composition as a novel imaging biomarker in postmenopausal women with prevalent fragility fractures. J Bone Miner Res. 2013;28(8):1721–8. doi: 10.1002/jbmr.1950. [DOI] [PMC free article] [PubMed] [Google Scholar]
- 79.Yeung DK, et al. Osteoporosis is associated with increased marrow fat content and decreased marrow fat unsaturation: a proton MR spectroscopy study. J Magn Reson Imaging. 2005;22(2):279–85. doi: 10.1002/jmri.20367. [DOI] [PubMed] [Google Scholar]
- 80.Baum T, et al. Does vertebral bone marrow fat content correlate with abdominal adipose tissue, lumbar spine bone mineral density, and blood biomarkers in women with type 2 diabetes mellitus? J Magn Reson Imaging. 2012;35(1):117–24. doi: 10.1002/jmri.22757. [DOI] [PMC free article] [PubMed] [Google Scholar]
- 81.Bredella MA, et al. Marrow fat composition in anorexia nervosa. Bone. 2014;66:199–204. doi: 10.1016/j.bone.2014.06.014. [DOI] [PMC free article] [PubMed] [Google Scholar]
- 82.Goldman LW. Principles of CT and CT technology. J Nucl Med Technol. 2007;35(3):115–28. doi: 10.2967/jnmt.107.042978. quiz 129-30. [DOI] [PubMed] [Google Scholar]
- 83.Barrett JF, Keat N. Artifacts in CT: recognition and avoidance. Radiographics. 2004;24(6):1679–91. doi: 10.1148/rg.246045065. [DOI] [PubMed] [Google Scholar]
- 84.Chiro GD, et al. Tissue signatures with dual-energy computed tomography. Radiology. 1979;131(2):521–3. doi: 10.1148/131.2.521. [DOI] [PubMed] [Google Scholar]
- 85.Johnson TR. Dual-energy CT: general principles. AJR Am J Roentgenol. 2012;199(5 Suppl):S3–8. doi: 10.2214/AJR.12.9116. [DOI] [PubMed] [Google Scholar]
- 86.Goodsitt MM, Rosenthal DI. Quantitative computed tomography scanning for measurement of bone and bone marrow fat content. A comparison of single- and dual-energy techniques using a solid synthetic phantom. Invest Radiol. 1987;22(10):799–810. doi: 10.1097/00004424-198710000-00006. [DOI] [PubMed] [Google Scholar]
- 87.Marshall WH, Jr, Alvarez RE, Macovski A. Initial results with prereconstruction dual-energy computed tomography (PREDECT) Radiology. 1981;140(2):421–30. doi: 10.1148/radiology.140.2.7255718. [DOI] [PubMed] [Google Scholar]
- 88.Magome T, et al. Evaluation of Functional Marrow Irradiation Based on Skeletal Marrow Composition Obtained Using Dual-Energy Computed Tomography. Int J Radiat Oncol Biol Phys. 2016;96(3):679–87. doi: 10.1016/j.ijrobp.2016.06.2459. [DOI] [PMC free article] [PubMed] [Google Scholar]
- 89.Laval-Jeantet AM, et al. Influence of vertebral fat content on quantitative CT density. Radiology. 1986;159(2):463–6. doi: 10.1148/radiology.159.2.3961178. [DOI] [PubMed] [Google Scholar]
- 90.Mayo-Smith W, et al. Intravertebral fat measurement with quantitative CT in patients with Cushing disease and anorexia nervosa. Radiology. 1989;170(3 Pt 1):835–8. doi: 10.1148/radiology.170.3.2916039. [DOI] [PubMed] [Google Scholar]


