Key Points
VWF variants c.2365A>G and c.2385T>C independently influence VWF biosynthesis and clearance, increasing VWF plasma levels.
Commonly inherited VWF variants can directly influence the protein and may contribute to hemostatic and thrombotic disease risk/severity.
Abstract
Plasma levels of von Willebrand factor (VWF) vary considerably in the general population and this variation has been linked to several genetic and environmental factors. Genetic factors include 2 common single nucleotide variants (SNVs) located in VWF, rs1063856 (c.2365A>G) and rs1063857 (c.2385T>C), although to date the mechanistic basis for their association with VWF level is unknown. Using genotypic/phenotypic information from a European healthy control population, in vitro analyses of recombinant VWF expressing both SNVs, and in vivo murine models, this study determined the precise nature of their association with VWF level and investigated the mechanism(s) involved. Possession of either SNV corresponded with a significant increase in plasma VWF in healthy controls (P < .0001). In vitro expression confirmed this observation and highlighted an independent effect for each SNV (P < .0001 and P < .01, respectively), despite close proximity and strong linkage disequilibrium between them both. The influence of c.2365A>G on VWF levels was also confirmed in vivo. This increase in VWF protein corresponded to an increase in VWF messenger RNA (mRNA) resulting, in part, from prolonged mRNA half-life. In addition, coinheritance of both SNVs was associated with a lower VWF propeptide-to-VWF antigen ratio in healthy controls (P < .05) and a longer VWF half-life in VWF knockout mice (P < .0001). Both SNVs therefore directly increase VWF plasma levels through a combined influence on VWF biosynthesis and clearance, and may have an impact on disease phenotype in both hemostatic and thrombotic disorders.
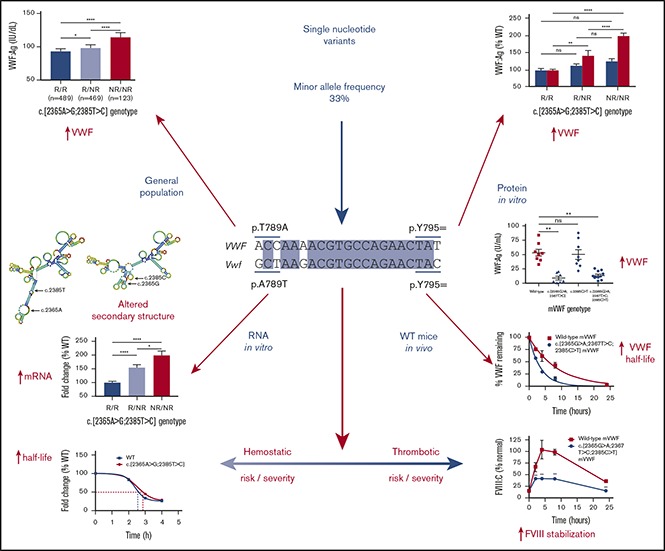
Visual Abstract
Introduction
von Willebrand factor (VWF) is an important plasma glycoprotein that performs 2 major hemostatic functions. It recruits platelets to sites of vascular injury and carries coagulation factor VIII (FVIII), protecting FVIII from degradation while conveying it to sites of vascular injury.1 There is considerable natural variation in VWF plasma levels; between 50% and 200% of average normal levels are seen in 95% of the general population.2
In humans, there is strong evidence of a genetic influence on VWF levels. In pedigree analyses, the attributable genetic influence is ∼30%,3 whereas twin studies have shown that it is ∼70%.4 It is well known that the ABO blood group locus accounts for ∼30% of this heritable influence on VWF levels,5,6 but recent association studies have also highlighted the influence of genetic variation at the VWF locus. The Cohorts for Heart and Aging Research in Genome Epidemiology study indicated that the common VWF single nucleotide variant (SNV) rs1063857 was significantly associated with interindividual variation in plasma VWF levels (P = 1.7 × 10⁻³²).7 Furthermore, a study of African Americans identified several VWF SNV influencing levels of the protein including the frequently inherited rs1063856, found to result in a significant increase in VWF levels (1.05 × 10⁻⁹).8 Other studies have reported similar observations for rs1063856,9-11 rs1063857,12-15 or both.16
rs1063856 (c.2365A>G; p.T789A) and rs1063857 (c.2385T>C; p.Y795=) are reported to be in strong linkage disequilibrium (LD; r2 = 0.980-1.000)17 and have a minor allele frequency of ∼33% (ranging from 9% in east Asian populations to 64% in African populations).17,18 They are located in VWF exon 18, which encodes part of the D′D3 assembly, functionally important for binding of VWF to FVIII (VWF:FVIIIB). Notably, both rs10638567,8 and rs106385719 have also been found to have a significant influence on FVIII procoagulant activity (FVIII:C). However, despite their significant association with VWF and FVIII levels, no studies have investigated the mechanistic basis for this influence. The aim of this study was therefore to investigate the mechanism(s) by which these SNVs are able to influence VWF and FVIII levels using a combined in vitro and in vivo approach.
Methods
Study population and genotypic/phenotypic analysis
European (predominantly white) healthy control individuals (n = 1166; Table 1) were recruited as part of the Molecular and Clinical Markers for the Management and Diagnosis of Type 1 von Willebrand Disease (MCMDM-1VWD) study. Available phenotypic data for VWF antigen (VWF:Ag), ristocetin cofactor activity (VWF:RCo), collagen binding (VWF:CB), propeptide (VWFpp), FVIII:C, and VWF:FVIIIB were measured as previously described.20-24 Genotypic analysis of SNV c.2365A>G and c.2385T>C was performed using the MassARRAY matrix-assisted laser desorption ionization–time of flight system (Sequenom Inc, San Diego, CA) as described.25 Experiments involving healthy control individuals were performed with the approval of the Sheffield Research Ethics Committee. In accordance with the Declaration of Helsinki, informed consent was obtained from all individuals at recruitment by signing a consent form in the individual's own language.
Table 1.
Population characteristics and regression analysis of VWF levels in the healthy control cohort
| Variable | Median (IQR) | c.2365A>G | c.2385T>C | ||
|---|---|---|---|---|---|
| Coefficient β (95% CI) | P | Coefficient β (95% CI) | P | ||
| VWF:Ag, n = 1156 | 97 IU/dL (75, 121) | 7.184 (4.380 to 9.988) | <.001 | 6.986 (4.173 to 9.799) | <.001 |
| VWF:RCo, n = 1155 | 87 IU/dL (65, 113) | 2.215 (−1.721 to 6.151) | .270 | 1.744 (−2.173 to 5.661) | .382 |
| FVIII:C, n = 1161 | 101 IU/dL (77, 127) | 1.112 (−2.477 to 4.701) | .543 | 0.719 (−2.846 to 4.284) | .692 |
| VWF:CB, n = 239 | 80 IU/dL (46, 119) | 0.748 (−10.754 to 12.250) | .898 | 0.178 (−11.097 to 11.454) | .975 |
| VWFpp, n = 389 | 118 IU/dL (104, 135) | 1.172 (−2.674 to 5.018) | .549 | 0.897 (−2.922 to 4.716) | .644 |
| VWFpp/VWF:Ag, n = 387* | 1.24 (1.05, 1.48) | −0.060 (−0.114 to −0.006) | .030 | −0.056 (−0.111 to −0.002) | .043 |
| VWF:FVIIIB, n = 181† | 1.09 (0.98, 1.20) | 0.011 (−0.027 to 0.050) | .563 | 0.013 (−0.026 to 0.051) | .520 |
ABO blood group data were available for n = 1124 (n = 481 [42.8%] blood group O).
CI, confidence interval; IQR, interquartile range.
n = 387 (1 individual was excluded from analyses because he or she was classified as an outlier [mean + 3 standard deviations]).
n = 181 of 1166 healthy control individuals (median age, 39 years [range, 4-100]; n = 497 [42.6%] male).
Generation of human and murine VWF expression plasmids
A pcDNA3.1/Hygro(−) mammalian expression plasmid (Thermo Fisher Scientific, Paisley, United Kingdom) containing full-length human VWF complementary DNA (cDNA; vWF-pcDNA3.1) was generated as previously described.26 Plasmids expressing c.2365A>G (p.T789A), c.2385T>C (p.Y795=) or both SNVs in cis (c.[2365A>G;2385T>C]; p.[T789A;Y795=]) were generated using a QuikChange Lightning site-directed mutagenesis kit (Agilent Technologies LDA UK Ltd, Stockport, United Kingdom). Successful mutagenesis was confirmed via Sanger sequence analysis.
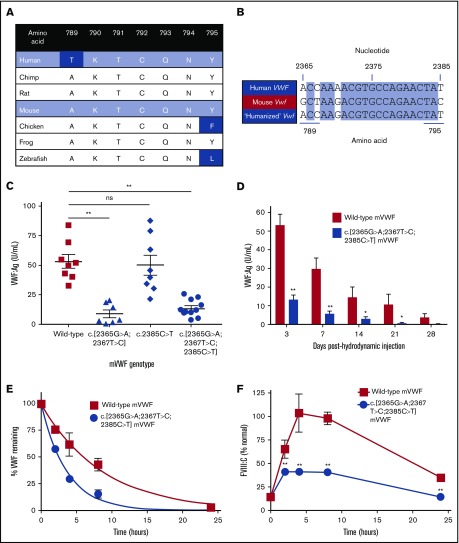
Murine Vwf (mVWF) cDNA was cloned into pSC11 under the transthyretin promoter as previously described.27 Amino acid alignment demonstrated that the human VWF (hVWF) variants were poorly conserved across species (see Figure 6A), with nucleotide alignment between mVWF and hVWF indicating that mVWF encodes the nonreference (NR) hVWF allele for each corresponding SNV (see Figure 6B). mVWF was “humanized” by site-directed mutagenesis using a QuikChange II XL kit (Stratagene, La Jolla, CA) to alter the sequence to c.[2365G>A;2367T>C] (p.A789T), c.2385C>T (p.Y795=) or c.[2365G>A;2367T>C;2385C>T] (p.[A789T;Y795=]).
Figure 6.
Influence of SNV on VWF expression and half-life in a murine model. (A) Alignment of VWF amino acids p.789-795 across species. (B) Alignment of VWF nucleotides c.2365-2385 between human and mouse. (C) Expression of murine c.[2365G>A;2367T>C], c.2385C>T and c.[2365G>A;2367T>C;2385C>T] in vivo. **P < .0001. (D) Expression of wild-type and c.[2365G>A;2367T>C;2385C>T] murine VWF 4 weeks posthydrodynamic injection. (E) Half-life of plasma-derived murine VWF in VWF knockout mice. (F) Stabilization of endogenous FVIII:C in VWF knockout mice.
In vitro measurement of VWF:Ag
HEK293T cells were maintained in Dulbecco modified Eagle medium containing GlutaMAX supplemented with 10% vol/vol fetal bovine serum (Thermo Fisher Scientific). Cell transfections were conducted in 9.6 cm2 wells using Xfect (Takara Bio Europe S.A.S., Saint-Germain-en-Laye, France). To summarize, 2.5 µg of wild-type (WT) or variant VWF expression plasmid (or 1.25 µg of WT and variant VWF for 50:50 cotransfections) was transfected and left to incubate at 37°C/5% CO2 for 24 hours before replacement of the culture media. Following a further 48-hour incubation, culture media was collected and the cells lysed in 300 µL of 1× passive lysis buffer (Promega UK Ltd, Southampton, United Kingdom). Measurement of VWF:Ag in collected media and lysates was performed using a matched-pair antibody human VWF enzyme-linked immunosorbent assay (ELISA; Enzyme Research Laboratories Ltd, Swansea, United Kingdom) according to the manufacturer’s specifications.
mRNA analysis
HEK293T cells were cultured and transfected as stated and harvested cells were centrifuged at 4000g for 5 minutes. Messenger RNA (mRNA) was extracted from pelleted cells using an EZ-RNA total RNA isolation kit (Geneflow Ltd, Lichfield, United Kingdom) and reverse transcribed using a QuantiTect reverse transcription kit (Qiagen Ltd, Manchester, United Kingdom) following manufacturer guidelines. Quantitative reverse transcription polymerase chain reaction (qRT-PCR) assays measuring both the target (VWF; Hs01109446_m1) and an endogenous control (β2 microglobulin [B2M]; Hs00984230_m1) in tandem were performed on a 7900HT real-time PCR system using TaqMan gene expression master mix (Thermo Fisher Scientific) according to manufacturer guidelines. Following assay completion, calculation of ΔΔ cycle threshold28 was used to indicate relative VWF RNA quantity.
mRNA half-life was measured using the same qRT-PCR protocol, but at 24 hours posttransfection, cells were treated with 5 µg/mL actinomycin D (Thermo Fisher Scientific). Cells were harvested at 0, 2, 3, and 4 hours posttreatment and half-life calculated as the time at which mRNA level was 50% of the level detected at 0 hours posttreatment.29
Hydrodynamic injection
Expression of mVWF cDNA in vivo was induced by hydrodynamic tail vein injection in VWF/FVIII double-knockout (DKO) C57Bl/6 mice.30 Plasma was collected via cardiac puncture 3 days postinjection. VWF:Ag was measured by ELISA using Dako (Glostrup, Denmark) anti-VWF antibodies for capture and detection (A0082 and P0226). All animal experiments were performed with the approval of the Queen’s University Animal Care Committee.
VWF half-life evaluation and FVIII stabilization
VWF knockout (KO) mice received 200 U/kg WT or p.[A789T;Y795=] plasma-derived mVWF (FVIII-free; produced in VWF/FVIII DKO mice) by tail-vein injections. VWF:Ag was quantified prior to plasma pooling, and reconstituted for both WT and p.[A789T;Y795=] to equimolar concentrations (20 U/mL) using VWF/FVIII DKO mouse pooled plasma as required as previously described.31,32 VWF:Ag levels were measured by Dako ELISA and endogenous murine FVIII:C was measured by chromogenic assay (Chromogenix Coatest SP Factor VIII; Diapharma Group Inc, West Chester, OH). VWF:Ag was measured relative to a 5-minute recovery (set to 100%) and half-life evaluated using a 1-phase exponential decay model in GraphPad Prism version 7.03 (GraphPad Software Inc, La Jolla, CA).
Statistical and in silico analysis
Statistical analyses were performed using GraphPad. Comparisons of ≥3 groups were performed using either a 1-way/2-way analysis of variance (ANOVA; to compare mean values) or a Kruskal-Wallis test (to compare median values).33 Multivariable linear regression analysis to test associations between variables was performed as previously described.34 All models were adjusted for age and ABO blood group (and either SNV c.2365A>G or c.2385T>C; 14 models in total) using IBM SPSS v24.0 for Windows 2016 (Armonk, New York, NY).
In silico protein, RNA, and splicing predictions were performed using several online tools as specified in supplemental Table 1. In silico analysis to determine LD was performed using Haploview v4.2.35
Results
Association of c.2365A>G and c.2385T>C with VWF levels
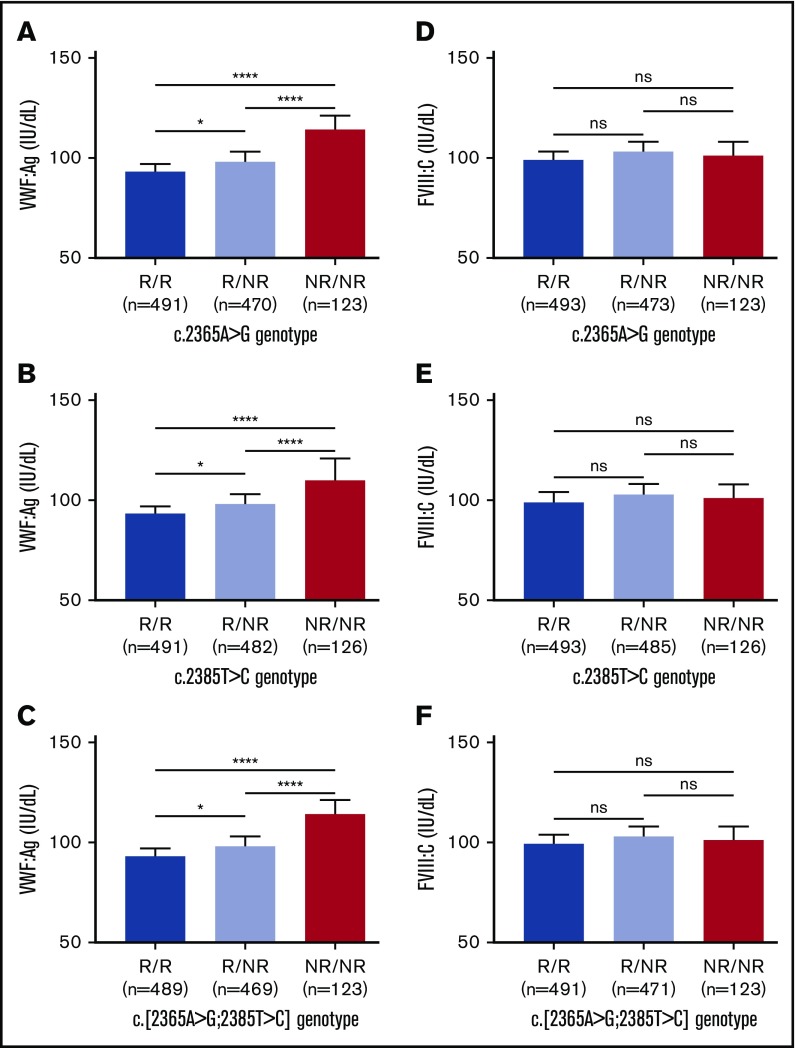
To confirm previous observations, that is, that c.2365A>G and c.2385T>C act as frequent small-scale genetic modifiers, the association between VWF SNV genotype and VWF levels was investigated in 1166 healthy control individuals (HCs). Analysis confirmed that the NR allele for each SNV was associated with significantly higher VWF:Ag levels (P < .0001; reference [R]/R, 93 and 93 IU/dL; R/NR, 98 and 98 IU/dL; NR/NR, 114 and 110 IU/dL c.2365A>G and c.2385T>C, respectively; Figure 1A-B) and when both SNV were combined (P < .0001; R/R, 93 IU/dL; R/NR, 98 IU/dL; NR/NR, 114 IU/dL; Figure 1C). This association was also observed when accounting for ABO blood group (O, P = .0005; non-O, P = .0009; supplemental Figure 1A-B), which was confirmed by linear regression analysis (Table 1). However, analysis of FVIII:C levels showed no association with genotype (Figure 1D-F; Table 1), although, there was a trend toward increased FVIII:C levels associated with the SNV NR allele in the HCs with O blood group, but not in those with non-O blood group (supplemental Figure 1C-D). Likewise, SNV genotype was not associated with VWF:RCo or VWF:CB levels (Table 1; supplemental Figure 2A-B).
Figure 1.
Association between SNV genotype and median VWF:Ag and FVIII:C levels in HCs. (A) SNV c.2365A>G and VWF:Ag levels. (B) SNV c.2385T>C and VWF:Ag levels. (C) Both SNVs in cis and VWF:Ag levels. (D) SNV c.2365A>G and FVIII:C levels. (E) SNV c.2385T>C and FVIII:C levels. (F) Both SNVs in cis and FVIII:C levels. Genotypes compared using a Mann-Whitney U test (*P < .05; ****P < .0001). Bars indicate 95% CI. NR, nonreference allele; ns, not significant; R, reference allele.
In vitro expression of recombinant VWF protein and mRNA
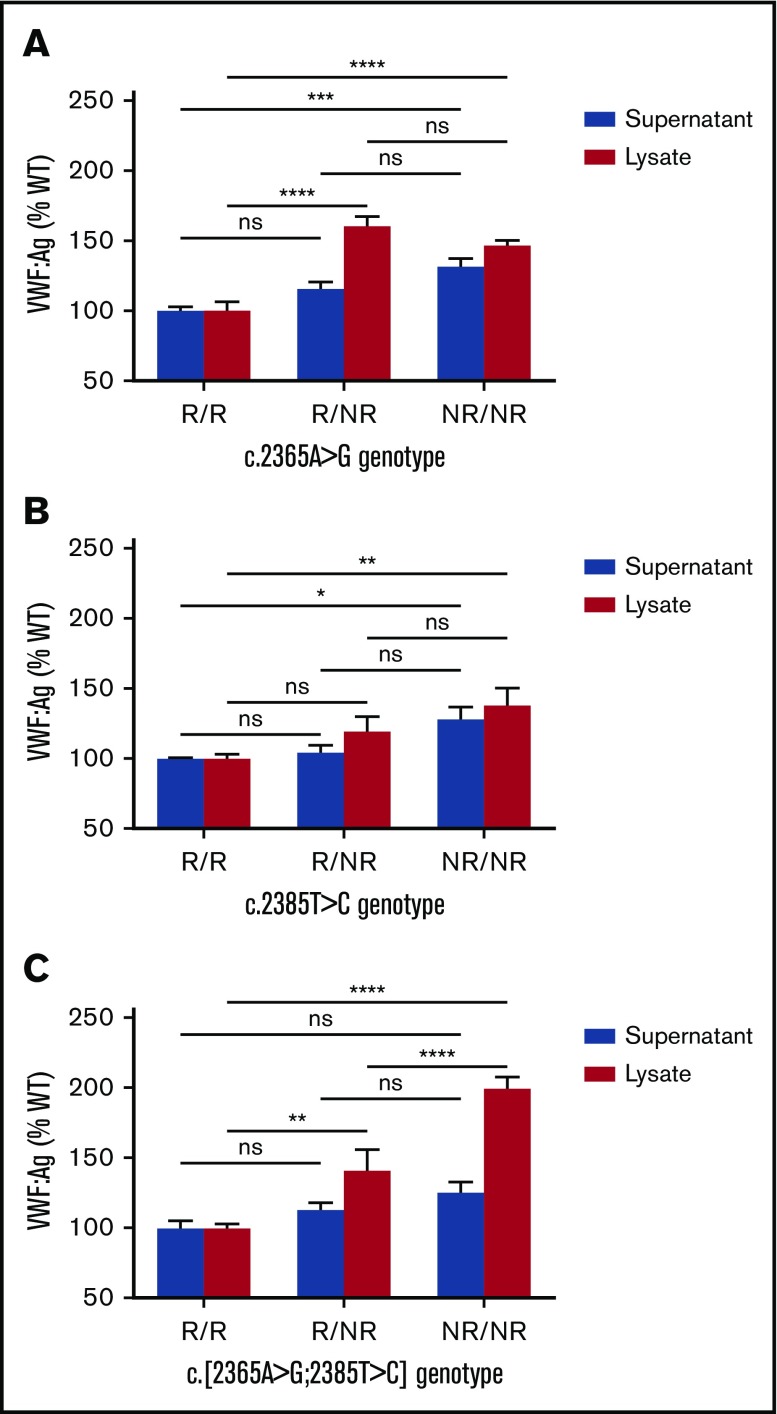
In silico analysis of the HC genotype data confirmed that the SNV were in strong LD (r2 = 0.991) suggesting that the observed association with VWF:Ag levels could be attributable to only 1 of the 2 SNVs or to both. To investigate this possibility and to verify the observed association in HCs, VWF-expressing plasmids encoding each SNV independently or together in cis were generated and VWF expression compared against a WT plasmid. Expression of both SNVs independently and together in cis resulted in an increase in both retained and secreted VWF expression (P < .0001, P < .01, and P < .0001, respectively; Figure 2). Despite the increased expression, no significant differences were observed in intracellular localization or pseudo–Weibel-Palade body formation between WT and variant VWF (supplemental Methods; supplemental Figure 3).
Figure 2.
In vitro expression of recombinant VWF protein. (A) SNV c.2365A>G. (B) SNV c.2385T>C. (C) Both SNVs in cis. Genotypes compared using a 2-way ANOVA with the Tukey multiple comparisons test (*P < .05; **P < .01; ***P < .001; ****P < .0001). Mean values for n = 3 triplicate measurements are shown (bars indicate standard error of the mean).
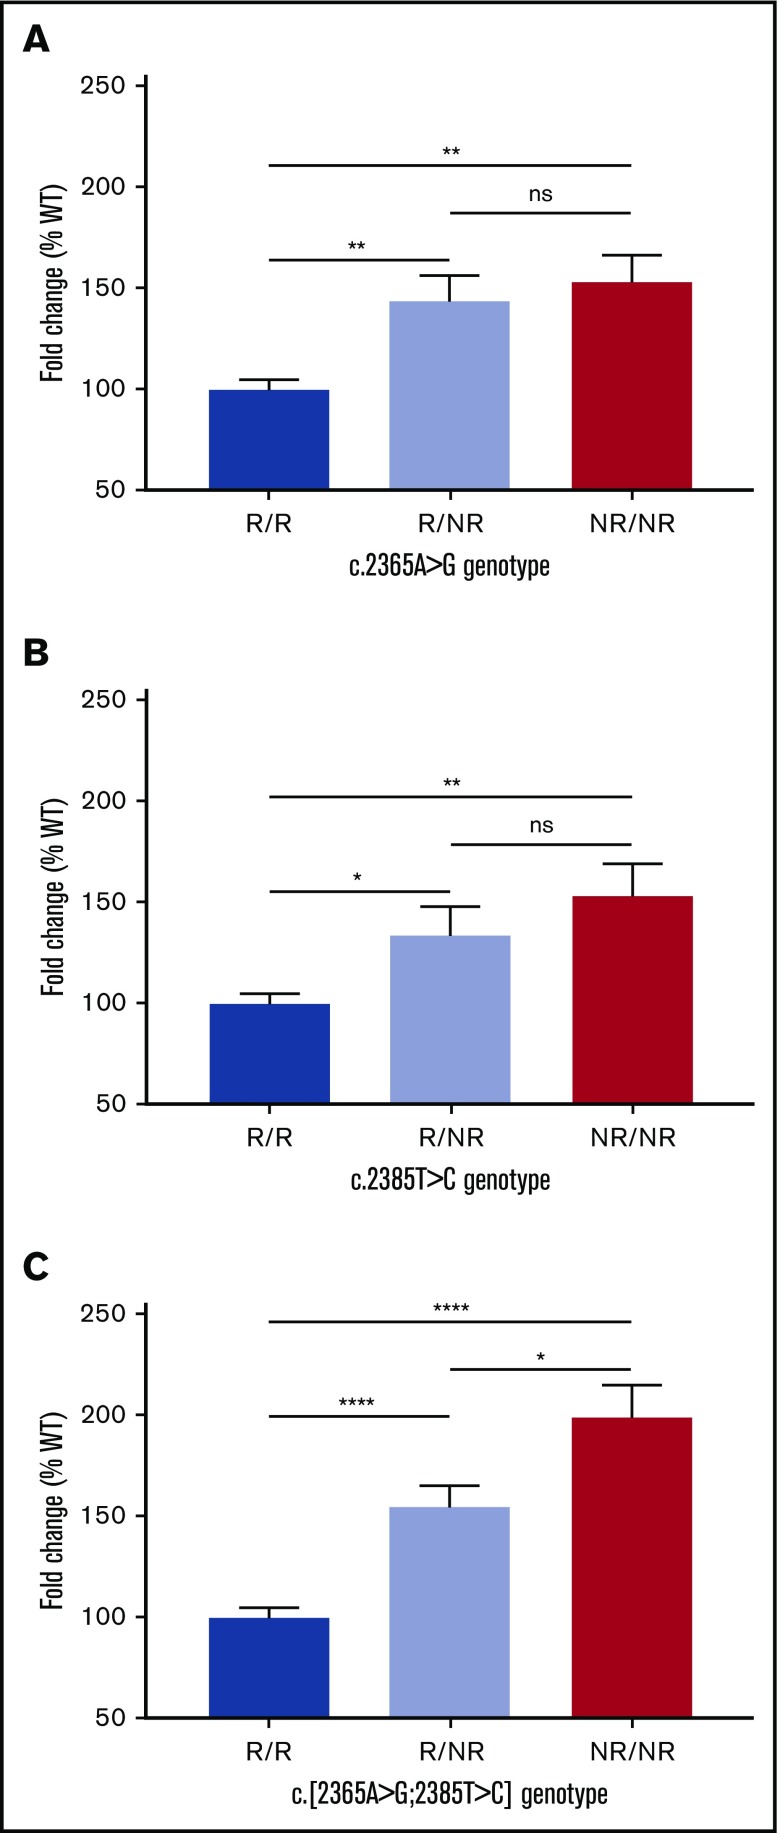
Given that both SNVs appeared to have an independent effect on VWF:Ag level, in silico and/or in vitro tools were used to predict whether nonsynonymous SNV c.2365A>G would have an impact on the VWF protein and also to predict whether either SNV would have an influence on mRNA processing or stability. c.2365A>G was not predicted to affect the protein structure/function and neither SNV was predicted to affect microRNA-binding sites nor influence splicing (supplemental Methods; supplemental Table 1; supplemental Figure 4). However, both were predicted to affect mRNA secondary structure (supplemental Table 1; supplemental Figure 5), which is known to influence mRNA stability and translation efficiency.36 Analysis of cDNA isolated from cells expressing each SNV independently showed an increase in VWF mRNA expression (P < .01 and P < .05, respectively; Figure 3A-B), with an additive increase observed when both SNV were expressed in cis (P < .0001; Figure 3C).
Figure 3.
In vitro expression of recombinant VWF mRNA. (A) SNV c.2365A>G. (B) SNV c.2385T>C. (C) Both SNVs in cis. Genotypes compared using an unpaired Student t test (*P < .05; **P < .01; ****P < .0001). Mean values for n = 3 triplicate measurements are shown (bars indicate standard error of the mean).
Determination of mRNA half-life
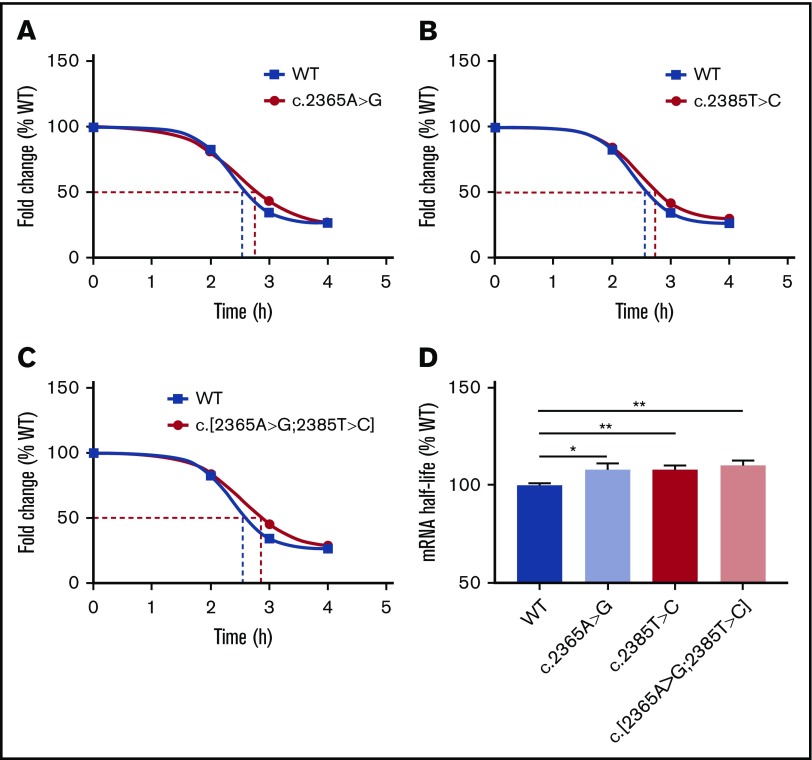
Based on the observation that both SNVs result in increased mRNA expression and a predicted effect on mRNA secondary structure, the decision was taken to compare the half-life of the mRNA generated by the WT expression plasmid against the half-life of mRNAs generated by variant expression plasmids. The data indicated that compared with the WT, both SNVs independently prolong the half-life of the expressed VWF mRNA (Figure 4A-B). In addition, the presence of both SNV in cis demonstrated a cumulative increase in mRNA half-life (Figure 4C-D), highlighting a direct correlation between prolonged mRNA half-life and the observed increase in VWF mRNA and protein expression.
Figure 4.
mRNA half-life of recombinant VWF. WT VWF (half-life [t1/2] = 2:36 hours) compared against (A) SNV c.2365A>G (t1/2 = 2:51 hours; 8.1% increase); (B) SNV c.2385T>C (t1/2 = 2:49 hours; 7.7% increase). (C) Both SNVs in cis (t1/2 = 2:54 hours; 10.0% increase). (D) Comparison of fold change in mRNA half-life between genotypes. Genotypes compared using an unpaired Student t test (*P < .05; **P < .01). Bars indicate standard error of the mean.
Association of c.2365A>G and c.2385T>C with VWF activity
There was no observed difference in the multimer profiles of the expressed recombinant VWF (supplemental Figure 6). In addition, and in contrast to the previously reported type 2N mutation c.2365A>C (p.T789P),37 neither SNV had a significant effect on VWF:FVIIIB when investigated in HCs (Table 1; supplemental Figure 2C) or when investigated in vitro (supplemental Methods; supplemental Table 2). However, analysis did highlight that the combined variant haplotype, p.[T789A;Y795=] VWF, had a slightly decreased binding affinity to FVIII compared with WT VWF which was likely due to a faster dissociation rate in spite of a similar association rate (supplemental Methods; supplemental Table 2).
Association of c.2365A>G and c.2385T>C with VWFpp and VWFpp/VWF:Ag ratio
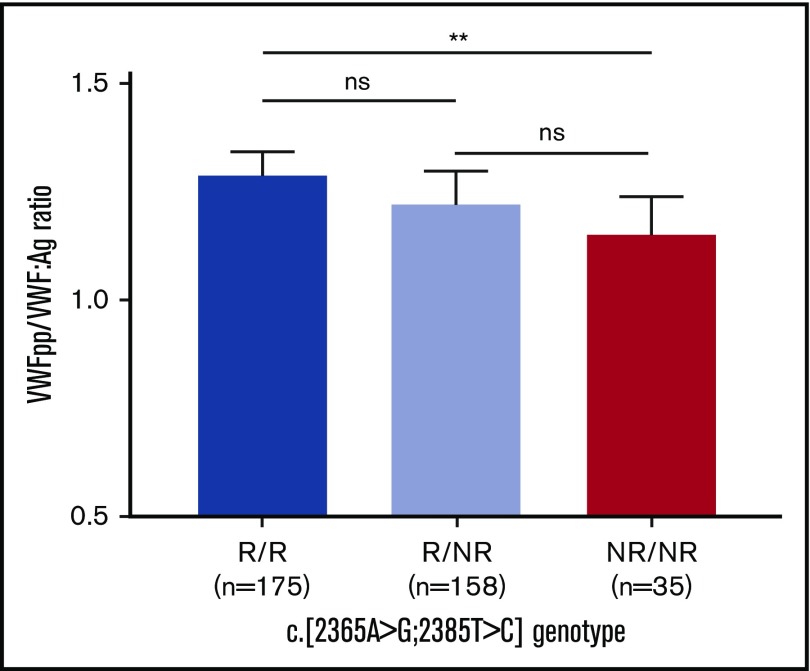
Similar to the observed association between SNV genotype and VWF:Ag levels, the NR allele was also linked to higher VWFpp levels in HCs (R/R, 117 IU/dL; R/NR, 119 IU/dL; NR/NR, 122 IU/dL), although this increase was not significant (Table 1; supplemental Figure 2D). However, analysis did highlight a significant association between the NR allele and reduced VWFpp/VWF:Ag ratio (P < .05; Figure 5), which was confirmed independently for both c.2365A>G (P = .03) and c.2385T>C (P = .043) using regression analysis (Table 1).
Figure 5.
Association between SNV c.[2365A>G;2385T>C] genotype and median VWFpp/VWF:Ag ratio in healthy controls. Genotypes compared using a Mann-Whitney U test (**P < .01). Bars indicate 95% CI.
Characterization of VWF expression and half-life in vivo
The influence of the c.[2365A>G;2385T>C] genotype on VWF was also investigated using an in vivo mVWF model to complement the in vitro findings. Expression of the single “humanized” mVWF variants (c.[2365G>A;2367T>C]; p.A789T and c.2385C>T; p.Y795=) or the combined in cis variant haplotype (c.[2365G>A;2367T>C;2385C>T]; p.[A789T;Y795=]) was assessed 3 days posthydrodynamic tail-vein injection of mVWF cDNA into VWF/FVIII DKO mice. c.[2365G>A;2367T>C] (P < .0001) and both mVWF variants in cis (P < .0001) had decreased expression compared with WT, whereas c.2385C>T expression alone did not (P = .773) (Figure 6C). The influence of the combined in cis variant haplotype on plasma VWF:Ag levels was compared with WT over a 4-week period. For all time points, the humanized mVWF demonstrated lower plasma expression when compared with WT mVWF (Figure 6D).
Plasma-derived mVWF that was FVIII-free was generated by hydrodynamic injection of the mVWF cDNA into VWF/FVIII DKO mice. Pooled plasma was then infused by tail vein injection into VWF KO mice and VWF half-life and endogenous FVIII:C stabilization were measured. Both SNV in cis had a shorter half-life than WT (2.53 vs 5.98 hours; P < .0001) (Figure 6E) and impaired stabilization of endogenous FVIII:C (area under the curve > 80% decrease; P < .001) (Figure 6F).
Discussion
This study used both in vitro and in vivo analyses with the aim of determining how VWF SNV c.2365A>G and c.2385T>C influence VWF and FVIII levels. Previous studies had linked both SNV to variation in both VWF plasma and FVIII activity levels. Analysis in a European HC population has confirmed that both act as frequent small-scale genetic modifiers of VWF, showing that inheritance of the NR allele of each SNV is linked to a significant increase in VWF:Ag.
However, analysis in this HC population notably did not show any significant correlation with FVIII:C. Plasma VWF is known to circulate in excess to plasma FVIII under normal conditions.38 Consequently, increases in VWF levels will have a limited impact on FVIII levels, which is confirmed by recent data highlighting that for every 1% change in VWF:Ag there is only a corresponding 0.54% change in FVIII:C levels.39 This may suggest that a larger sample cohort than the HC population used in this study would be required to observe an impact of these SNV on FVIII. The fact that previous studies investigating these SNV consistently reported lower levels of significance for FVIII:C associations (P = 3.6 × 10⁻⁹, P = 1.24 × 10⁻⁶ and P = .02, respectively)7,8,10 compared with VWF:Ag (P = 1.7 × 10⁻³², P = 1.05 × 10⁻⁹ and P = .006, respectively)7,8,10 supports this hypothesis.
In vitro expression of recombinant VWF not only verified that the NR alleles resulted in higher VWF:Ag levels, but also highlighted that both SNV independently increased VWF levels. Despite an overall increase in total VWF expression, under all expressed conditions the NR allele corresponded to a greater increase in retained VWF. In vivo, VWF undergoes extensive posttranslational modification and complex storage/secretion processes,40 but this regulated secretory pathway is not present in HEK293T cells.41 Given that the mean levels of VWF secreted remained similar regardless of whether c.2365A>G and c.2385T>C were expressed independently or together in cis (R/NR: 115, 104, 113; NR/NR: 131, 128, 125), it seems plausible that the HEK293T cells were only able to process and release the produced VWF at a similar rate, giving rise to the greater increase in retained VWF observed.
Despite both SNV resulting in increased VWF levels, neither had a direct effect on VWF protein structure/function or any effect on mRNA splicing (supplemental Methods; supplemental Figure 4). This is not unexpected because any major impact on protein function or mRNA splicing would likely result in a more profound (disease-causing) phenotype which would be observed in a substantial number of individuals (given a general population frequency of ∼33% for both SNV). Instead, the increased levels of VWF correspond to an increase in mRNA resulting, at least in part, from both SNV prolonging the mRNA half-life. The reason for this increased mRNA half-life is likely due to the influence of both SNV on mRNA secondary structure as this is known to influence RNA stability, which in turn impacts mRNA half-life.36 The fact that replacement of an A or T nucleotide by either a C or G (which is the case for both SNV) is reported to increase mRNA stability,42 supports this argument.
Plasma levels of VWF can be regulated by both biosynthetic and clearance-related mechanisms.40 Support for the influence of c.2365A>G and c.2385T>C genotype on clearance was observed in a recent association study which demonstrated that while the NR allele for c.2365A>G was linked to an increase in both VWF:Ag and VWFpp levels, the effect size observed was smaller for VWFpp, which the authors attributed to a clearance-dependent mechanism.43 Data on VWFpp levels (although not significant, likely due to data only being available for n = 389 HCs) in this current study confirm the effect size observation, whereas the VWFpp/VWF:Ag ratios support the clearance-dependent mechanism hypothesis as the NR allele was associated with a lower VWFpp/VWF:Ag ratio.
Finally, VWF/FVIII DKO mice expressing the humanized reference allele demonstrated decreased VWF:Ag levels compared with WT mVWF, consistent with human plasma VWF:Ag results. mVWF expressing both SNVs also had a shorter half-life than WT, consistent with the VWFpp and VWFpp/VWF:Ag ratio observations in the HCs and as previously reported.43 Importantly, accelerated clearance of mVWF expressing both SNVs impaired stabilization of endogenous FVIII:C, which may account in part for the association of these SNVs with plasma FVIII:C in normal individuals. Although the influence of the SNVs was more pronounced for humanized mVWF than observed in HCs, this may relate to differences in the physicochemical influence of these SNVs on hVWF vs mVWF, and recognition by their respective clearance receptors. Alterations in the VWF amino acid sequence, glycosylation pattern and 3D conformation may influence VWF clearance by cells in the liver or spleen.40 Although the specific mechanistic basis by which these SNV modify VWF half-life is not defined, it is plausible that the changes alter the affinity of mVWF for 1 or more VWF clearance receptors.
There is increasing evidence that frequently observed SNVs can affect protein function, expression, and clearance. Increased understanding of the genetic factors influencing VWF levels has important implications given that variation in VWF levels is associated with susceptibility to both bleeding and thrombosis. Nonfunctional or reduced levels of VWF can result in von Willebrand disease (VWD).44 Coinheritance of c.2365A>G and/or c.2385T>C with a known pathogenic VWF mutation causing VWD could potentially influence patient phenotype, for example, increasing VWF levels resulting in a less severe phenotype, and may contribute to reduced penetrance/variable expressivity observed in type 1 VWD.44
High VWF levels have been associated with increased risk of venous thrombosis (VT), myocardial infarction and ischemic stroke.45-47 Inheritance of c.2365A>G has already been associated with an increased risk of VT in female patients48 and as this SNV and c.2385T>C result in increased VWF levels, they could both confer an increased disease risk in other thrombotic disorders. Likewise, African Americans have a higher risk of thrombosis compared with other racial groups.49 Given that the reported minor allele frequency for these SNVs is 57% in African Americans, compared with ∼33% in Caucasians and 9% in East Asians,17 it is plausible that these SNVs may contribute to this increased risk.
In conclusion, both c.2365A>G and c.2385T>C independently cause an increase in VWF plasma levels. This is due to an influence on VWF biosynthesis (similar to the c.7970G>A [p.R2657Q] gain-of-function variant previously reported in mice)50 resulting from increased mRNA production of variant VWF and to secreted variant VWF protein having a greater half-life in the circulation. Inheritance of either or both SNVs could have a significant impact on the risk/severity of hemostatic and/or thrombotic disorders. In addition, these findings highlight that common SNVs can have a direct influence on protein levels and care should be taken before classifying common SNVs as “neutral” or “benign.”
Supplementary Material
The full-text version of this article contains a data supplement.
Acknowledgments
The authors thank R. Schneppenheim for kindly providing the vWF-pcDNA3.1 plasmid, and J. Lai, K. Nesbitt, C. Brown, C. Notley, and P. Lima for technical assistance.
This work was supported by Umm Al-Qura University (Mecca, Saudi Arabia) (A.H.M.) and the National Institutes of Health, National Heart, Lung, and Blood Institute program project grant HL081588 Zimmerman Program for the Molecular and Clinical Biology of VWD (I.R.P., A.C.G., D.L., and D.J.H.). L.L.S. is the recipient of a Canadian Institute for Health Research fellowship. D.L. holds a Canadian Research Chair in Molecular Hemostasis.
Authorship
Contribution: I.R.P., A.C.G., D.L., and D.J.H. initiated the study; A.C.G., D.L. and D.J.H. coordinated the study; A.H.M., K.O., L.L.S., D.L., and D.J.H. designed the study and interpreted the data; A.H.M., K.O., L.L.S., J.C.J.E., U.B., C.H., and J.G. generated the data; A.H.M., K.O., L.L.S., W.M.H., and D.J.H. analyzed the data; A.H.M., K.O., L.L.S., and D.J.H. wrote the paper; L.L.S., A.C.G., D.L., and D.J.H. revised the paper; and all authors reviewed and approved the paper.
Conflict-of-interest disclosure: The authors declare no competing financial interests.
Complete lists of the members of the EU-VWD and ZPMCB-VWD Study Groups appear in “Appendix.”
Correspondence: David Lillicrap, Richardson Laboratory, Department of Pathology and Molecular Medicine, Queen’s University, 88 Stuart St, Kingston, ON K7L 3N6, Canada; e-mail: david.lillicrap@queensu.ca; and Daniel J. Hampshire, Haemostasis Research Group, Department of Infection, Immunity and Cardiovascular Disease, Faculty of Medicine, Dentistry and Health, University of Sheffield, Beech Hill Rd, Sheffield S10 2RX, United Kingdom; e-mail: d.hampshire@shef.ac.uk.
Appendix: study group members
The members of the EU-VWD Study Group are: J. Batlle (A Coruña, Spain), E. Berntorp (Malmö, Sweden), I. Bodó (Budapest, Hungary), U.B. (Hamburg, Germany), G. Castaman (Florence, Italy), J.C.J.E. (Leiden, The Netherlands), A. B. Federici (Milan, Italy), A. Gadisseur (Antwerp, Belgium), A.C.G. (Sheffield, United Kingdom), J.G. (Lille, France), M. Laffan (London, United Kingdom), F. Leebeek (Rotterdam, The Netherlands), P. M. Mannucci (Milan, Italy), I.R.P. (Sheffield, United Kingdom), F. Peyvandi (Milan, Italy), F. Rodeghiero (Vicenza, Italy), R. Schneppenheim (Hamburg, Germany), A. Tosetto (Vicenza, Italy), and A. Veyradier (Paris, France). The members of the ZPMCB-VWD Study Group are: R. Montgomery and S. Haberichter (Milwaukee, WI), D.L. and P. James (Kingston, ON, Canada), and A.C.G., I.R.P., and D.J.H. (Sheffield, United Kingdom).
References
- 1.Sadler JE. Biochemistry and genetics of von Willebrand factor. Annu Rev Biochem. 1998;67(1):395-424. [DOI] [PubMed] [Google Scholar]
- 2.Sadler JE. von Willebrand disease type 1: a diagnosis in search of a disease. Blood. 2003;101(6):2089-2093. [DOI] [PubMed] [Google Scholar]
- 3.Souto JC, Almasy L, Borrell M, et al. Genetic determinants of hemostasis phenotypes in Spanish families. Circulation. 2000;101(13):1546-1551. [DOI] [PubMed] [Google Scholar]
- 4.de Lange M, de Geus EJC, Kluft C, et al. Genetic influences on fibrinogen, tissue plasminogen activator-antigen and von Willebrand factor in males and females. Thromb Haemost. 2006;95(3):414-419. [DOI] [PubMed] [Google Scholar]
- 5.Gill JC, Endres-Brooks J, Bauer PJ, Marks WJ Jr, Montgomery RR. The effect of ABO blood group on the diagnosis of von Willebrand disease. Blood. 1987;69(6):1691-1695. [PubMed] [Google Scholar]
- 6.Ørstavik KH, Kornstad L, Reisner H, Berg K. Possible effect of secretor locus on plasma concentration of factor VIII and von Willebrand factor. Blood. 1989;73(4):990-993. [PubMed] [Google Scholar]
- 7.Smith NL, Chen M-H, Dehghan A, et al. ; Wellcome Trust Case Control Consortium. Novel associations of multiple genetic loci with plasma levels of factor VII, factor VIII, and von Willebrand factor: The CHARGE (Cohorts for Heart and Aging Research in Genome Epidemiology) Consortium. Circulation. 2010;121(12):1382-1392. [DOI] [PMC free article] [PubMed] [Google Scholar]
- 8.Johnsen JM, Auer PL, Morrison AC, et al. ; NHLBI Exome Sequencing Project. Common and rare von Willebrand factor (VWF) coding variants, VWF levels, and factor VIII levels in African Americans: the NHLBI Exome Sequencing Project. Blood. 2013;122(4):590-597. [DOI] [PMC free article] [PubMed] [Google Scholar]
- 9.Lacquemant C, Gaucher C, Delorme C, et al. ; The GENEDIAB Study Group and the DESIR Study Group. Association between high von Willebrand factor levels and the Thr789Ala vWF gene polymorphism but not with nephropathy in type I diabetes. Kidney Int. 2000;57(4):1437-1443. [DOI] [PubMed] [Google Scholar]
- 10.Antoni G, Oudot-Mellakh T, Dimitromanolakis A, et al. Combined analysis of three genome-wide association studies on vWF and FVIII plasma levels. BMC Med Genet. 2011;12(1):102. [DOI] [PMC free article] [PubMed] [Google Scholar]
- 11.van Loon JE, Kavousi M, Leebeek FWG, et al. von Willebrand factor plasma levels, genetic variations and coronary heart disease in an older population. J Thromb Haemost. 2012;10(7):1262-1269. [DOI] [PubMed] [Google Scholar]
- 12.van Schie MC, de Maat MPM, Isaacs A, et al. Variation in the von Willebrand factor gene is associated with von Willebrand factor levels and with the risk for cardiovascular disease. Blood. 2011;117(4):1393-1399. [DOI] [PubMed] [Google Scholar]
- 13.Campos M, Sun W, Yu F, et al. Genetic determinants of plasma von Willebrand factor antigen levels: a target gene SNP and haplotype analysis of ARIC cohort. Blood. 2011;117(19):5224-5230. [DOI] [PMC free article] [PubMed] [Google Scholar]
- 14.van Schie MC, Wieberdink RG, Koudstaal PJ, et al. Genetic determinants of von Willebrand factor plasma levels and the risk of stroke: the Rotterdam Study. J Thromb Haemost. 2012;10(4):550-556. [DOI] [PubMed] [Google Scholar]
- 15.Zhou Z, Yu F, Buchanan A, et al. Possible race and gender divergence in association of genetic variations with plasma von Willebrand factor: a study of ARIC and 1000 genome cohorts. PLoS One. 2014;9(1):e84810. [DOI] [PMC free article] [PubMed] [Google Scholar]
- 16.Zabaneh D, Gaunt TR, Kumari M, et al. Genetic variants associated with von Willebrand factor levels in healthy men and women identified using the HumanCVD BeadChip. Ann Hum Genet. 2011;75(4):456-467. [DOI] [PubMed] [Google Scholar]
- 17.1000 Genomes Project Consortium; Auton A, Brooks LD, Durbin RM, et al. A global reference for human genetic variation. Nature. 2015;526(7571):68-74. [DOI] [PMC free article] [PubMed] [Google Scholar]
- 18.Lek M, Karczewski KJ, Minikel EV, et al. ; Exome Aggregation Consortium. Analysis of protein-coding genetic variation in 60,706 humans. Nature. 2016;536(7616):285-291. [DOI] [PMC free article] [PubMed] [Google Scholar]
- 19.Campos M, Buchanan A, Yu F, et al. Influence of single nucleotide polymorphisms in factor VIII and von Willebrand factor genes on plasma factor VIII activity: the ARIC Study. Blood. 2012;119(8):1929-1934. [DOI] [PMC free article] [PubMed] [Google Scholar]
- 20.Caron C, Mazurier C, Goudemand J. Large experience with a factor VIII binding assay of plasma von Willebrand factor using commercial reagents. Br J Haematol. 2002;117(3):716-718. [DOI] [PubMed] [Google Scholar]
- 21.Federici AB, Canciani MT, Forza I, et al. A sensitive ristocetin co-factor activity assay with recombinant glycoprotein Ibalpha for the diagnosis of patients with low von Willebrand factor levels. Haematologica. 2004;89(1):77-85. [PubMed] [Google Scholar]
- 22.Tosetto A, Rodeghiero F, Castaman G, et al. A quantitative analysis of bleeding symptoms in type 1 von Willebrand disease: results from a multicenter European study (MCMDM-1 VWD). J Thromb Haemost. 2006;4(4):766-773. [DOI] [PubMed] [Google Scholar]
- 23.Eikenboom J, Van Marion V, Putter H, et al. Linkage analysis in families diagnosed with type 1 von Willebrand disease in the European study, molecular and clinical markers for the diagnosis and management of type 1 VWD. J Thromb Haemost. 2006;4(4):774-782. [DOI] [PubMed] [Google Scholar]
- 24.Eikenboom J, Federici AB, Dirven RJ, et al. ; MCMDM-1VWD Study Group. VWF propeptide and ratios between VWF, VWF propeptide, and FVIII in the characterization of type 1 von Willebrand disease. Blood. 2013;121(12):2336-2339. [DOI] [PMC free article] [PubMed] [Google Scholar]
- 25.Johansson AM, Halldén C, Säll T, Lethagen S. Variation in the VWF gene in Swedish patients with type 1 von Willebrand Disease. Ann Hum Genet. 2011;75(4):447-455. [DOI] [PubMed] [Google Scholar]
- 26.Schneppenheim R, Budde U, Obser T, et al. Expression and characterization of von Willebrand factor dimerization defects in different types of von Willebrand disease. Blood. 2001;97(7):2059-2066. [DOI] [PubMed] [Google Scholar]
- 27.Golder M, Pruss CM, Hegadorn C, et al. Mutation-specific hemostatic variability in mice expressing common type 2B von Willebrand disease substitutions. Blood. 2010;115(23):4862-4869. [DOI] [PubMed] [Google Scholar]
- 28.Livak KJ, Schmittgen TD. Analysis of relative gene expression data using real-time quantitative PCR and the 2(-Δ Δ C(T)) method. Methods. 2001;25(4):402-408. [DOI] [PubMed] [Google Scholar]
- 29.Leclerc GJ, Leclerc GM, Barredo JC. Real-time RT-PCR analysis of mRNA decay: half-life of beta-actin mRNA in human leukemia CCRF-CEM and Nalm-6 cell lines. Cancer Cell Int. 2002;2(1):1. [DOI] [PMC free article] [PubMed] [Google Scholar]
- 30.Pruss CM, Golder M, Bryant A, et al. Pathologic mechanisms of type 1 VWD mutations R1205H and Y1584C through in vitro and in vivo mouse models. Blood. 2011;117(16):4358-4366. [DOI] [PMC free article] [PubMed] [Google Scholar]
- 31.Yee A, Gildersleeve RD, Gu S, et al. A von Willebrand factor fragment containing the D’D3 domains is sufficient to stabilize coagulation factor VIII in mice. Blood. 2014;124(3):445-452. [DOI] [PMC free article] [PubMed] [Google Scholar]
- 32.Swystun LL, Georgescu I, Mewburn J, et al. Abnormal von Willebrand factor secretion, factor VIII stabilization and thrombus dynamics in type 2N von Willebrand disease mice. J Thromb Haemost. 2017;15(8):1607-1619. [DOI] [PubMed] [Google Scholar]
- 33.Zhang B, Zhang Y. Mann-Whitney U test and Kruskal-Wallis test should be used for comparisons of differences in medians, not means: comment on the article by van der Helm-van Mil et al. Arthritis Rheum. 2009;60(5):1565–, author reply 1565.. [DOI] [PubMed] [Google Scholar]
- 34.Albánez S, Ogiwara K, Michels A, et al. Aging and ABO blood type influence von Willebrand factor and factor VIII levels through interrelated mechanisms. J Thromb Haemost. 2016;14(5):953-963. [DOI] [PMC free article] [PubMed] [Google Scholar]
- 35.Barrett JC, Fry B, Maller J, Daly MJ. Haploview: analysis and visualization of LD and haplotype maps. Bioinformatics. 2005;21(2):263-265. [DOI] [PubMed] [Google Scholar]
- 36.Manning KS, Cooper TA. The roles of RNA processing in translating genotype to phenotype. Nat Rev Mol Cell Biol. 2017;18(2):102-114. [DOI] [PMC free article] [PubMed] [Google Scholar]
- 37.Enayat MS, Guilliatt AM, Short PE, et al. A novel alanine or threonine 789 to proline mutation causing type 2N von Willebrand’s disease when inherited homozygously or heterozygously with arginine 854 to glutamine mutation. Haemophilia. 2010;16(6):966-969. [DOI] [PubMed] [Google Scholar]
- 38.Terraube V, O’Donnell JS, Jenkins PV. Factor VIII and von Willebrand factor interaction: biological, clinical and therapeutic importance. Haemophilia. 2010;16(1):3-13. [DOI] [PubMed] [Google Scholar]
- 39.Song J, Chen F, Campos M, et al. Quantitative influence of ABO blood groups on factor VIII and its ratio to von Willebrand factor, novel observations from an ARIC study of 11,673 subjects. PLoS One. 2015;10(8):e0132626. [DOI] [PMC free article] [PubMed] [Google Scholar]
- 40.Lenting PJ, Christophe OD, Denis CV. von Willebrand factor biosynthesis, secretion, and clearance: connecting the far ends. Blood. 2015;125(13):2019-2028. [DOI] [PubMed] [Google Scholar]
- 41.Valentijn KM, Eikenboom J. Weibel-Palade bodies: a window to von Willebrand disease. J Thromb Haemost. 2013;11(4):581-592. [DOI] [PubMed] [Google Scholar]
- 42.Duan J, Shi J, Ge X, et al. Genome-wide survey of interindividual differences of RNA stability in human lymphoblastoid cell lines. Sci Rep. 2013;3(1):1318. [DOI] [PMC free article] [PubMed] [Google Scholar]
- 43.Ozel AB, McGee B, Siemieniak D, et al. Genome-wide studies of von Willebrand factor propeptide identify loci contributing to variation in propeptide levels and von Willebrand factor clearance. J Thromb Haemost. 2016;14(9):1888-1898. [DOI] [PMC free article] [PubMed] [Google Scholar]
- 44.Goodeve AC. The genetic basis of von Willebrand disease. Blood Rev. 2010;24(3):123-134. [DOI] [PubMed] [Google Scholar]
- 45.Flinterman LE, van Hylckama Vlieg A, Rosendaal FR, Doggen CJM. Venous thrombosis of the upper extremity: effect of blood group and coagulation factor levels on risk. Br J Haematol. 2010;149(1):118-123. [DOI] [PubMed] [Google Scholar]
- 46.Hanson E, Jood K, Karlsson S, Nilsson S, Blomstrand C, Jern C. Plasma levels of von Willebrand factor in the etiologic subtypes of ischemic stroke. J Thromb Haemost. 2011;9(2):275-281. [DOI] [PubMed] [Google Scholar]
- 47.Rutten B, Maseri A, Cianflone D, et al. Plasma levels of active von Willebrand factor are increased in patients with first ST-segment elevation myocardial infarction: a multicenter and multiethnic study. Eur Heart J Acute Cardiovasc Care. 2015;4(1):64-74. [DOI] [PubMed] [Google Scholar]
- 48.Smith NL, Rice KM, Bovill EG, et al. Genetic variation associated with plasma von Willebrand factor levels and the risk of incident venous thrombosis. Blood. 2011;117(22):6007-6011. [DOI] [PMC free article] [PubMed] [Google Scholar]
- 49.Zakai NA, McClure LA. Racial differences in venous thromboembolism. J Thromb Haemost. 2011;9(10):1877-1882. [DOI] [PubMed] [Google Scholar]
- 50.Lemmerhirt HL, Shavit JA, Levy GG, Cole SM, Long JC, Ginsburg D. Enhanced VWF biosynthesis and elevated plasma VWF due to a natural variant in the murine Vwf gene. Blood. 2006;108(9):3061-3067. [DOI] [PMC free article] [PubMed] [Google Scholar]
Associated Data
This section collects any data citations, data availability statements, or supplementary materials included in this article.


