

Abstract
Visually preserved metabolism in posterior cingulate cortex relative to hypometabolism in precuneus and cuneus, the cingulate island sign, is a feature of dementia with Lewy bodies (DLB) on FDG-PET. Lower cingulate island sign ratio (posterior cingulate cortex/cuneus+precuneus; FDG-CISr) values have been associated with a higher Braak neurofibrillary tangle stage in autopsied DLB. Using voxel-wise analysis, we assessed the patterns of regional cortical perfusion and metabolism, and using an atlas-based approach, we measured perfusion cingulate island sign ratio on arterial spin labeling MRI (ASL-CISr), and its associations with FDG-CISr, uptake on tau-PET and clinical severity in DLB. Our study sample (n = 114) included clinically probable DLB patients (n = 19), age-matched patients with probable Alzheimer's disease dementia (AD; n = 19) and matched controls (n = 76) who underwent MRI with 3-dimensional pseudo-continuous arterial spin labeling, 18F-FDG-PET and 18F-AV-1451 tau PET. Patterns of cortical perfusion and metabolism were derived from quantitative maps using Statistical Parametric Mapping. DLB patients showed hypoperfusion on ASL-MRI in precuneus, cuneus and posterior parieto-occipital cortices, compared to controls, and relatively spared posterior cingulate gyrus, similar to pattern of hypometabolism on FDG-PET. DLB patients had higher ASL-CISr and FDG-CISr than AD patients (p <0.001). ASL-CISr correlated with FDG-CISr in DLB patients (r = 0.67; p =0.002). Accuracy of distinguishing DLB from AD patients was 0.80 for ASL-CISr and 0.91 for FDG-CISr. Lower ASL-CISr was moderately associated with a higher composite medial temporal AV-1451 uptake (r = −0.50; p =0.03) in DLB. Lower perfusion in precuneus and cuneus was associated with worse global clinical scores. In summary, the pattern of cortical hypoperfusion on ASL-MRI is similar to hypometabolism on FDG-PET, and respective cingulate island sign ratios correlate with each other in DLB. Non-invasive and radiotracer-free ASL-MRI may be further developed as a tool for the screening and diagnostic evaluation of DLB patients in a variety of clinical settings where FDG-PET is not accessible.
Keywords: Dementia with Lewy bodies, Cingulate island sign ratio, Cortical perfusion, Arterial spin labeling MRI, Or AV1–1451 tau PET, FDG PET
Graphical abstract

Highlights
-
•
DLB has relatively preserved posterior cingulate perfusion on ASL, referred to as cingulate island sign ratio (ASL-CISr)
-
•
The pattern of hypoperfusion on ASL is similar to hypometabolism on FDG-PET in DLB, and ASL-CISr correlates with FDG-CISr
-
•
Lower ASL-CISr is associated with a higher medial temporal lobe AV-1451 uptake on tau-PET in DLB
-
•
Higher ASL-CISr differentiates DLB from AD dementia patients with good accuracy
-
•
ASL is noninvasive, radiotracer-free and may be considered an alternative for screening of DLB when FDG-PET is inaccessible
1. Introduction
Although dementia with Lewy bodies (DLB) is the second most common neurodegenerative dementia in older adults, the diagnostic accuracy has been suboptimal (Nelson et al., 2010) and DLB remains underdiagnosed (Mok et al., 2004) in the clinical setting. In addition, pathology underlying clinically diagnosed patients with DLB is often mixed with AD pathology (Irwin et al., 2017; Merdes et al., 2003; Mckeith et al., 2017; Halliday et al., 2011) and these can be misdiagnosed as having AD. Diagnostic accuracy needs to improve because the spectrum of DLB clinical symptoms is variable and wide, and DLB patients are sensitive to atypical neuroleptics that are commonly prescribed to the elderly.
DLB patients are characterized by parieto-occipital hypometabolism on 18F-fluorodeoxyglucose PET (FDG-PET) (Minoshima et al., 2001; Kantarci et al., 2012; Imamura et al., 1997), and visually preserved metabolism in the posterior cingulate cortex relative to hypometabolism in cuneus and precuneus, known as cingulate island sign (CIS) (Imamura et al., 1997; Lim et al., 2009). The quantitative measure of metabolism in posterior cingulate gyrus divided by metabolism in precuneus and cuneus is CIS ratio (Lim et al., 2009) (henceforth FDG-CISr). A lower FDG-CISr has been associated with a higher Braak neurofibrillary tangle stage at autopsy (Graff-Radford et al., 2014) and a greater medial temporal atrophy on MRI (Iizuka and Kameyama, 2016), but was not influenced by β-amyloid load on PET (Graff-Radford et al., 2014). FDG-CISr has been considered highly specific for the diagnosis of probable DLB (Lim et al., 2009), and has been recently included as a supportive biomarker in the fourth consensus report of the DLB Consortium (Mckeith et al., 2017). However, unlike MRI, FDG-PET is less available in many clinical facilities.
Arterial spin labeling (ASL) (Williams et al., 1992; Detre et al., 2009) is an MRI technique for quantitative measurement of the regional cerebral blood flow at the tissue level using the water molecules in the blood as endogenous magnetically labeled tracers. ASL can be included in a routine MRI examination and does not require injection of a radiotracer or contrast agent. Various ASL-MRI techniques have been used to evaluate patients within the AD spectrum (Musiek et al., 2012; Wolk and Detre, 2012; Chen et al., 2011). The pseudo-continuous ASL (Dai et al., 2008) has demonstrated a very good reliability and precision compared to a gold standard perfusion 15O-water PET in elderly and patients with AD dementia (Xu et al., 2010) where a short acquisition time is important (Dai et al., 2008; Xu et al., 2010).
It remains unclear whether regional changes in cortical perfusion on ASL-MRI, particularly in CIS regions (Imabayashi et al., 2017; Imabayashi et al., 2016) are similar to hypometabolic changes on FDG-PET in DLB patients, and whether measuring the cortical perfusion on ASL MRI, particularly in regions that make up CIS, can be potentially useful for differentiating DLB patients from those with AD dementia.
Our objectives were first to assess the pattern of regional cortical perfusion using ASL-MRI in DLB patients and compare this pattern of regional cortical perfusion to regional metabolism on FDG-PET using voxel-wise approach. Second, to measure the perfusion and metabolism in the regions making up the CISr (henceforth ASL-CISr and FDG-CISr) using an atlas-based approach. Third, to determine the associations of ASL-CISr with composite medial temporal 18F-AV-1451 uptake on tau-PET which was chosen as proxy of an additional AD-related neurofibrillary tangle pathology in DLB patients, and associations of ASL-CISr with severity of the clinical impairment in DLB patients.
2. Materials and methods
2.1. Participants
This prospective study was approved by the Mayo Clinic Institutional Review Board in compliance with Health Insurance Portability and Accountability Act. All participants or their proxies provided a written informed consent prior to their participation. We included consecutive patients with clinically probable DLB (n = 19) (Mckeith et al., 2005) who were evaluated at the Mayo Clinic Alzheimer's Disease Research Center between June 2015 and March 2017. For comparison, we included concurrent patients with clinically probable AD dementia (n = 19) (Mckhann et al., 2011), matched 1:1 on age to DLB patients. As another comparison group, we selected clinically unimpaired older adults (CN; n = 76), matched 4:1 to DLB patients on age and sex from the Mayo Clinic Study of Aging, a population-based study of aging (Roberts et al., 2008). Patients with DLB and AD dementia were treated with acetylcholinesterase inhibitors in a standard dosing regimen and with additional medications if needed.
All patients underwent comprehensive evaluations including neurological examination, interview with patient and his/her caregiver and neuropsychological tests covering four cognitive domains (memory, language, executive, visuospatial). Global measures of Clinical Dementia Rating Sum of Boxes (CDR-SOB); Dementia Rating Scale (DRS) and short test of mental status (Kokmen et al., 1991) were used to assess the global cognition and clinical disease severity of patients with dementia.
2.2. Ascertainment of DLB features
The presence, duration and severity of DLB clinical features, and the duration of dementia were evaluated. Visual hallucinations were considered present if they were well-formed and recurrent images of people, animals or objects. Fluctuations were considered as present if patients scored 3 or 4 points on the Mayo Clinic Fluctuations questionnaire (Ferman et al., 2004). Parkinsonism was rated using the Unified Parkinson's Disease Rating Scale part III (UPDRS-III). Probable REM sleep behavior disorder (RBD) was diagnosed using the International Classification of Sleep Disorders-II diagnostic criteria B for probable RBD (AASM, 2005).
2.3. Ascertainment of clinically unimpaired controls
Criteria for being clinically unimpaired were independent functioning and normal performance on tests covering four cognitive domains (memory, language, executive, visuospatial). The raw score from each test was transformed into age-adjusted score using previously established normative data from the Mayo Clinic's Older Americans Normative Studies (Ivnik et al., 1992) on the participants from the same population. Participants scoring 1.0 SD or more than the age-specific mean in the general population were considered for possible cognitive impairment (Petersen et al., 2010). The final decision on normal cognition was established during a panel consensus after taking into account education, prior occupation, visual or hearing deficits, and reviewing all other participant's information.
To be included in the current study, all participants needed to undergo MRI with pseudo-continuous ASL. All participants underwent FDG-PET except for one DLB patient. All DLB patients were requested to undergo AV-1451 tau PET. Only participants with scans of sufficient technical quality and without comorbidities that could interfere with cognitive functioning (brain tumor, large cortical infarct, normal pressure hydrocephalus, traumatic brain injury, alcoholism) were included. We excluded two DLB, two AD patients and four controls due to excessive head motion prior to image analysis.
2.4. Imaging studies
To investigate the patterns of cortical hypoperfusion, cortical metabolism and similarities between the two patterns in DLB patients as compared to controls, we used voxel-wise analysis. We further used an atlas-based approach to measure the perfusion and metabolism in regions that make up the ASL-CISr and FDG-CISr. CIS ratio denotes that the atlas-based measurement of perfusion or metabolism from the posterior cingulate cortex is divided by the perfusion or metabolism in cuneus+precuneus combined. An atlas-based approach was used to compare the magnitude of FDG-CISr and ASL-CISr to each other, and measure the associations between ASL-CISr and composite medial temporal AV-1451 uptake on tau PET and measures of clinical severity in DLB patients.
The relationship between the magnitude of ASL-CISr and severity of AD tau-related pathology in DLB patients was assessed using the AV-1451 uptake in a composite medial temporal region of the entorhinal cortex, parahippocampal gyrus and hippocampus. A study on differences in tau deposition by AV-1451 between DLB and AD patients (Kantarci et al., 2017) showed that a composite meta-ROI consisting of these regions distinguished patients with DLB from those with AD using AV-1451 tau PET. Thus, medial temporal AV-1451 uptake can be considered to reflect AD-related tau pathology in patients with DLB.
2.5. ASL-MRI acquisition
For anatomical segmentation and labeling, a T1-weighted 3-dimensional high resolution magnetization prepared rapid acquisition gradient echo sequence was performed on a 3 Tesla MRI scanner (GE Healthcare; Waukesha, Wisconsin) with an eight channel phased array head coil. During the acquisition, participants were wearing ear plugs and were asked to relax but were not asked to close their eyes.
Cerebral blood flow of the entire cerebral cortex was acquired using a product 3-dimensional fast spin echo (FSE) pseudo-continuous ASL sequence with an interleaved stack-of-spiral readout and background suppression (Dai et al., 2008). The imaging parameters used were a labeling duration of 1450 ms, post labeling delay of 2025 ms, repetition time/echo time of 4800/10 milliseconds, refocusing flip angle 111.1 degrees, FOV 240 mm, acquisition matrix 512/8 samples re-gridded to a 128 × 128 matrix with an in-plane reconstructed resolution of 1.875 × 1.875 cm2; 40 slices with slice thickness 4 mm, no gap. Using the same readout scheme, 3 excitation averages of label and control volume pairs were acquired, a proton density (PD) weighted volume, and 4 discarded acquisitions to reach steady state were acquired, resulting in an overall scan duration of 4 min 48 s. The mean ASL difference image and the PD-weighted image were combined to calculate quantitative cerebral blood flow maps. Scans were visually inspected to ensure the whole brain coverage, and checked for image artefacts and only scans with sufficient quality were used for analysis.
2.6. Analysis of cortical perfusion on ASL-MRI
Individual pseudo-continuous ASL acquisitions were converted from DICOM to nifti-1 format, resulting in a single 4-dimensional nifti-1 volume where the first 3-dimensional volume was the PD and the second 3-dimensional volume was the PW - a difference between tag and control volumes. This was split into one 3-dimensional PD nifti-1 volume and one 3-dimensional PW nifti-1 volume. Each was co-registered to the participant's own T1-weighted volume using Statistical Parametric Mapping registration module, with the PD as the source and the T1-weighted volume as the target, and this transformation was also applied to move the PW volume into the T1 space. The quantitative cerebral blood flow maps were generated by fitting a derivative of the general kinetic model based on PW and PD volumes, using the formula provided in the recommendations for implementation of ASL (Alsop et al., 2015).
We used 2-class partial volume correction in ASL analysis (Meltzer et al., 1999).
Atlas-based parcellation of quantitative cerebral blood flow maps into regions of interest was performed by propagating an in-house modified version of the automated anatomic labeling atlas (Tzourio-Mazoyer et al., 2002) from template space into participant's T1 space, using the inverse spatial normalization parameters obtained from Statistical Parametric Mapping unified segmentation.
To reduce the subject-to-subject variability of ASL cerebral blood flow, the mean blood flow of the whole cerebellum gray matter was chosen as an internal reference in both voxel- and atlas-based analyses. The mean blood flow in the numerator (posterior cingulate cortex) and denominator (precuneus+cuneus) components of the CISr were divided by the mean flow in the whole cerebellum gray matter. Since CISr was measured as perfusion in posterior cingulate region divided by perfusion in precuneus+cuneus, the internal reference was not needed in this measurement.
2.7. Acquisition and analysis of 18F-FDG-PET and 18F-AV1451 tau PET
Scans were acquired using PET/CT scanner (DRX; GE Healthcare; Milwaukee, Wisconsin) operating in 3-dimensional mode. Briefly, FDG-PET was performed after 30 min of uptake, with four 2-minute dynamic frames. A 20-minute AV-1451 PET scan was performed after 80 min of uptake. During the acquisition, participants were wearing ear plugs and were asked to relax but were not asked to close their eyes. Individual FDG-PET and AV-1451 PET scans were co-registered to the participant's own T1-weighted MRI with a subsequent atlas-based parcellation.
For AV-1451 PET used in the current study solely as a proxy of an additional AD-related pathology in DLB, the median standardized uptake value in left + right cerebellar crus was used as a reference (Kantarci et al., 2017).
For FDG-PET and for a consistency with ASL-MRI analysis, the mean standardized uptake in the cerebellar gray matter has been chosen as a reference.
2-class partial volume correction was used in tau-PET and FDG-PET analysis (Meltzer et al., 1999).
The patterns of hypoperfusion on ASL-MRI and hypometabolism on FDG-PET in DLB patients were derived from an exploratory voxel-based analysis of the cortical gray matter using multiple regressions in Statistic Parametric Mapping. Smoothing was not applied. DLB patients were compared to controls using t-test and cluster size k of minimum 100 voxels. Comparisons were displayed as uncorrected for multiple comparisons (p <0.001) to show the full range of differences, and applying the voxel-wise family wise error correction for multiple comparisons (FWE; p <0.05).
2.8. Statistical analysis
Participants' characteristics were summarized using means and standard deviations (SD) or proportions (%). Continuous variables were compared across clinical groups using analysis of variance with a random block design to account for matching, followed by a priori chosen contrasts for pair-wise comparisons. The dummy (0, 1) variables (or blocks) were included as predictors in the models to account for the matching. Associations between continuous variables (FDG-CISr and ASL-CISr) among all were expressed as the partial correlations and were calculated after adjustment for the blocks. Categorical variables were compared between DLB and AD groups and between DLB and controls using either conditional logistic regression or exact conditional logistic regression. Associations between continuous variables in DLB patients where appropriate were assessed using Pearson correlations and their associated p-values. Medial temporal composite AV-1451 standardized uptake value ratio was log-transformed to meet the model assumptions.
Area under the receiver operating characteristic curve statistics with 95% confidence intervals (CI) was calculated to measure the performance of ASL-CISr and FDG-CISr when distinguishing between DLB and AD patients. Analyses were performed using SAS version 9.4 and R statistical software version 3.1.1 http://www.R-project.org with significance set at type I error rate α < 0.05.
3. Results
3.1. Participants' characteristics
Demographic and clinical characteristics are summarized in Table 1. Due to matching, no differences in age were observed between DLB and AD dementia patients. As expected, there were more women in AD than DLB group due to sex-based differences between the two disorders. No differences in the education or functional measures of clinical impairment were observed between DLB and AD group by CDR-SOB and DRS; however MMSE was lower in AD than in DLB group (p =0.003). APOE ε4 carriers were more prevalent in AD group (p =0.016).
Table 1.
Participants' demographic and clinical characteristics.
| CN n = 76 |
DLB n = 19 |
AD n = 19 |
DLB vs CN p-value⁎ |
DLB vs AD p-value⁎ |
|
|---|---|---|---|---|---|
| Age, years | 68.9 (6.7) | 68.9 (6.4) | 69.1 (6.8) | 0.96 | 0.77 |
| Male, no. (%) | 72 (95%) | 18 (95%) | 15 (79%) | 1.00 | 0.09 |
| APOE ε4 carrier, no. (%) | 14 (19%) | 7 (37%) | 14 (82%) | <0.001 | <0.001 |
| Education, years | 14.8 (2.2) | 15.8 (2.5) | 16.3 (3.0) | 0.11 | 0.54 |
| MMSE | 28.7 (0.9) | 24.7 (4.3) | 21.8 (5.8) | <0.001 | 0.003 |
| CDR-SOB | 0.0 (0.1) | 5.5 (4.6) | 4.1 (2.9) | <0.001 | 0.07 |
| Motor UPDRS | 0.3 (1.0) | 13.0 (7.8) | 0.3 (0.6) | <0.001 | <0.001 |
| DRS | NA | 122.4 (26.0) | 124.7 (10.1) | <0.001 | 0.81 |
| Visual hallucination, no. (%) | NA | 10 (53%) | 0 (0%) | – | – |
| Fluctuations, no. (%) | NA | 15 (79%) | 1 (6%) | – | – |
| Parkinsonism, no. (%) | NA | 19 (100%) | 1 (6%) | – | – |
| RBD, no. (%) | NA | 19 (100%) | 3 (17%) | – | – |
| ACHEI medication, no (%) | NA | 19 (100%) | 19 (100%) | – | – |
The mean (SD) is listed for the continuous variables and count (%) for the categorical variables.
Abbreviations: CN – clinically normal; DLB – dementia with Lewy bodies; AD – Alzheimer's disease dementia; APOE – apolipoprotein E; MMSE – Mini Mental State Examination; CDR-SOB – Clinical Dementia Rating – Sum of boxes; UPDRS – Unified Parkinson Disease Rating Scale; DRS – Dementia Rating Scale; RBD – REM sleep behavior disorder; ACHEI – acetylcholinesterase inhibitor.
p-values for continuous variables are from analysis of variance with a random block design to account for matching, followed by a priori chosen contrasts for pair-wise comparisons of the clinical groups of interest (CN compared to DLB patients and AD patients compared to CN. p-values for categorical variables are either from conditional logistic regression or exact conditional logistic regression.
3.2. Pattern of hypoperfusion in DLB patients
Fig. 1 illustrates the voxel-wise pattern of cortical hypoperfusion side by side with cortical hypometabolism in DLB patients when compared to controls. Overall, the hypoperfusion was the most severe in the posterior parieto-temporal and occipital cortices that included precuneus and cuneus and supramarginal and angular gyrus, whereas the posterior cingulate gyrus was relatively spared. Moreover, the pattern of cortical hypoperfusion was similar with hypometabolism, although hypometabolism was slightly more wide-spread and included also voxels in the frontal cortices. No voxels with a higher perfusion in DLB than in controls were found.
Fig. 1.

Cortical hypoperfusion on ASL-MRI and hypometabolism on FDG-PET in DLB patients.
Regional cortical hypoperfusion on ASL is compared voxel-wise between DLB patients and CN (top panels). Pattern of cortical hypometabolism on FDG-PET is shown in the bottom panels. In the uncorrected analysis (p <0.001, top left), DLB patients have hypoperfusion in the medial parieto-occipital cortices, specifically in precuneus and cuneus and in the lateral occipital and temporo-parietal cortex (e.g. angular, supramarginal and middle and inferior temporal gyrus) compared to CN. The perfusion in posterior cingulate gyrus is relatively spared. Pattern of hypoperfusion is similar to hypometabolism (bottom left), although the hypometabolism is more wide-spread involving voxels in temporo-parietal and frontal cortices. The posterior cingulate gyrus is only marginally involved. After voxel-wise correction for multiple comparisons with family-wise error (FWE) (p <0.05, top right), the hypoperfusion remains confined to precuneus and cuneus and also supramarginal and angular gyrus. Hypometabolic areas overlap with hypoperfusion, although hypometabolism extends more into lateral temporo-parietal and to a lesser degree into frontal cortices (bottom right).
3.3. Magnitude of ASL-CISr and FDG-CISr by clinical group
CISr were consistently highest in DLB and lowest in AD dementia patients on both ASL and FDG-PET (Fig. 2). On pair-wise comparisons of ASL-CISr, DLB had higher ASL-CISr than AD dementia patients (p <0.001) and controls (p =0.007). On pair-wise comparisons of FDG-CISr, DLB patients also had higher FDG-CISr than both AD dementia patients and controls (p <0.001). The magnitude of ASL-CISr was slightly higher than FDG-CISr for a given clinical group.
Fig. 2.

Differences in ASL-CISr and FDG-CISr by clinical group.
Box-and-whisker plots show differences in magnitude of ASL-CISr and FDG-CISr; DLB patients have the highest CIS ratios whereas AD dementia patients have the lowest CIS ratios.
3.4. Correlation between ASL-CISr and FDG-CISr
The ASL-CISr correlated with FDG-CISr among all participants using partial correlations accounting for the matching and in DLB patients using Pearson correlation (Fig. 3).
Fig. 3.
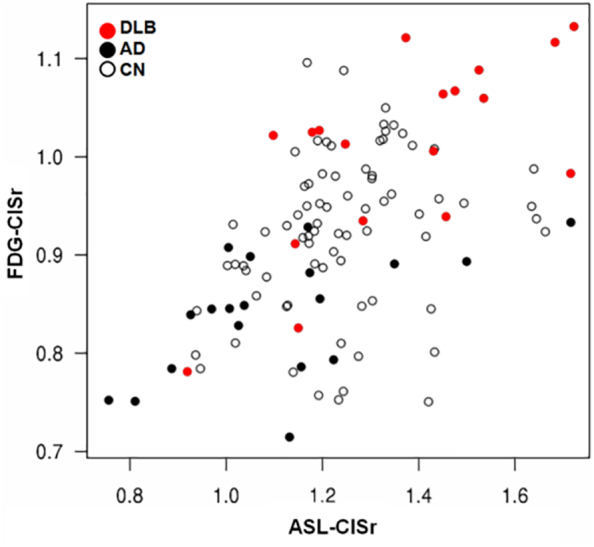
Correlation between ASL-CISr and FDG-CISr.
Scatter plot shows Pearson correlation between FDG-CISr and ASL-CISr in DLB patients (red dots; rp = 0.67; p =0.002) and among all (rp = 0.52; p <0.001).
3.5. Relationship between medial temporal AV-1451 uptake and ASL-CISr in DLB
As expected, AD dementia patients had the highest whereas controls had the lowest medial temporal AV-1451 uptake (p <0.001). DLB patients had higher medial temporal AV-1451 uptake than controls (p =0.022). A higher medial temporal AV-1451 uptake correlated with lower ASL-CISr in DLB patients (r = −0.50; p =0.03; Fig. 4).
Fig. 4.

Correlation between perfusion cingulate island sign ratio and medial temporal tau AV-1451 uptake in DLB.
Pearson correlation between a higher composite medial temporal AV-1451 uptake as a proxy of AD-related tau pathology and lower ASL-CISr in DLB patients (r = −0.50; p =0.03). The SUVr of AV-1451 uptake is log-transformed.
Fig. 5 shows images of the individuals with DLB and AD dementia from our cohort which demonstrate CIS as a visually recognizable finding on ASL MRI and FDG-PET along with the corresponding AV-1451 uptake in medial temporal regions.
Fig. 5.

Individual imaging findings in DLB and AD patients.
Left: a 70 years old male DLB patient who has visually preserved CIS on ASL and FDG-PET: the arrow head points to the relatively preserved perfusion in the posterior cingulate cortex, when compared to a lower signal in precuneus and cuneus. He has a minimal medial temporal AV-1451 uptake (the bright spot on the right side is a non-specific uptake in the choroid plexus and not in the hippocampus itself). Middle: A 74 years old male AD dementia patient who does not have visually preserved CIS on ASL or FDG-PET. He has a considerable AV-1451 uptake including the medial temporal cortex. Right: an 82 years old male DLB patient who does not have visually preserved CIS on either ASL or FDG-PET and he has higher medial temporal AV-1451 uptake than DLB patient to the left.
3.6. Regional perfusion in CISr regions and clinical impairment in DLB
Associations between ASL-CISr and MMSE, DRS, CDR-SOB or motor UPDRS were not observed. However, a lower perfusion in precuneus+cuneus (relative to perfusion in cerebellum) which make up the denominator of the CISr correlated with a higher CDR-SOB (r = −0.57; p =0.012) and with lower DRS (r = 0.54; p =0.038) and lower MMSE (r = 0.50; p =0.043) corresponding to a worse global cognitive or functional impairment in DLB patients.
3.7. Utilizing CIS ratios to distinguish the DLB from AD patients
The receiver operating characteristics (ROC) curves with associated area under the ROC (AUROC) were calculated for ASL-CISr and for FDG-CISr used to distinguish between DLB and AD dementia patients. Although FDG-CISr performed better (AUROC 0.91; 95% CI 0.79–1.00), the accuracy of ASL-CISr was also good (0.80; 95% CI 0.65–0.95), Fig. 6.
Fig. 6.

Discrimination between DLB and AD patients using CISr.
The receiver operating characteristics (ROC) curves are shown for ASL-CISr and for FDG-CISr for distinguishing DLB and AD dementia patients. The overall accuracy for ASL-CISr corresponds to area under the ROC (AUROC) of 0.80 (95% CI 0.79–1.00) and for FDG-CISr to AUROC of 0.91 (95% CI 0.65–0.95). Various sensitivities and associated specificities for both measures are listed.
4. Discussion
In this study, we demonstrated that patients with DLB had relatively spared regional perfusion in the posterior cingulate cortex in contrast with a hypoperfusion in precuneus and cuneus on ASL-MRI. Voxel-wise findings of hypoperfusion on ASL-MRI were similar to hypometabolism on FDG-PET in DLB, especially in posterior parietal and occipital regions, and the magnitude of ASL-CISr correlated with FDG-CISr. Conversely, AD dementia patients had severe hypoperfusion in posterior cingulate cortex; therefore ASL-CISr was higher in DLB than in AD dementia patients. Lower ASL-CISr in DLB patients was associated with a higher medial temporal AV-1451 uptake, a proxy of additional AD tau-related pathology in DLB patients. Lower perfusion in precuneus and cuneus that make up the denominator of ASL-CISr was associated with a greater clinical impairment by global cognitive and functional scores. Although the accuracy of FDG-CISr for distinguishing between DLB and AD dementia patients was higher, the accuracy of ASL-CISr was also good.
Only a few recent studies investigated ASL-MRI perfusion in a smaller number of DLB patients compared to controls (Binnewijzend et al., 2014; Taylor et al., 2012; Roquet et al., 2016). The severity and distribution of hypoperfusion in DLB patients varied, likely due to various methods used for ASL-MRI acquisition (sometimes not covering the entire brain or covering only a selected section), post-processing, and utilizing various voxel cluster thresholds at various significance levels. One of more consistent finding across these studies (Binnewijzend et al., 2014; Taylor et al., 2012) was hypoperfusion in precuneus and cuneus. Recently, a pattern of relatively preserved perfusion in the posterior cingulate cortex and cingulate island sign in DLB patients was also confirmed on perfusion SPECT imaging (Imabayashi et al., 2017; Imabayashi et al., 2016; Iizuka et al., 2017). Comparison of ASL-MRI with FDG-PET, a well-established functional method included as supportive feature for DLB diagnosis (Mckeith et al., 2017; Mckeith et al., 2005) has not been performed.
The pattern of hypoperfusion in our cohort of DLB patients was similar to the hypometabolic pattern on FDG-PET (Minoshima et al., 2001; Imamura et al., 1997; Kantarci et al., 2012) although the involvement on FDG-PET was more severe, especially in cuneus, and included voxels in lingual and frontal cortices. Similarly, highly correlated patterns have been observed in early phase perfusion of AV-1451 PET and glucose hypometabolism on FDG-PET in a variety of neurodegenerative diseases (Hammes et al., 2017).
The consistent findings of relatively spared perfusion in posterior cingulate gyrus, hypoperfusion in precuneus and cuneus, and particularly their ratio ASL-CISr that we investigated in the current study, may be of added value for assessment of patients for DLB. ASL-CISr was highest in DLB and lowest in AD dementia patients, a finding consistent with FDG-CISr, although two AD dementia patients had higher ASL-CISr than expected (Fig. 2). Patients with atypical AD such as posterior cortical atrophy can have higher FDG-CISr (and potentially also higher ASL-CISr), although CISr and occipital involvement would be typically asymmetrical in posterior cortical atrophy (Whitwell et al., 2017).
ASL-MRI and FDG-PET are measuring two interrelated processes; perfusion and metabolism (Buxton and Frank, 1997). We found a good correlation between the FDG-PET and ASL findings in DLB patients. However, the magnitude of ASL-CISr was slightly higher than FDG-CISr in a given clinical group. This may be explained by potential regional (posterior cingulate versus cuneus and precuneus) differences in perfusion and metabolism (Chen et al., 2011) on ASL and FDG-PET, although the pattern of hypoperfusion overlapped with hypometabolism.
Higher composite medial temporal AV-1451 uptake on tau PET was associated with lower ASL-CISr, in agreement with a previous finding of a higher neurofibrillary tangle Braak stage at autopsy correlating with a lower FDG-CISr (Lim et al., 2009; Graff-Radford et al., 2014). This relationship is likely a reflection of greater AD-related neurofibrillary tangle pathology in the limbic network of those patients who have overlapping AD and Lewy body pathology. Posterior cingulate cortex is a part of the limbic network that is affected by AD-related neurofibrillary tangle pathology since the early stage of the disease (Minoshima et al., 1997; Reiman et al., 1996), and may be less targeted by Lewy body pathology (Lim et al., 2009). The relationship between a higher composite medial temporal AV-1451 uptake and lower ASL-CISr, however, needs to be interpreted with a caution since there were a few DLB patients with low medial temporal AV-1451 uptake who also had lower ASL-CISr values where higher ASL-CISr values would be expected instead. Other underlying pathologies than neurofibrillary tangle tau pathology, such as hippocampal sclerosis, TAR DNA-binding protein 43 or cerebrovascular disease could contribute to this. Presence of these pathologies could explain lower AV-1451 uptake in DLB patients with lower ASL-CISr, in whom higher ASL-CISr values were expected in the presumed absence of neurofibrillary tangle tau pathology.
Among DLB patients, neuroimaging markers of AD-related pathology such as hippocampal volumes predict the treatment response with acetylcholinesterase inhibitors (Graff-Radford et al., 2012), therefore, ASL-CISr which is associated with neurofibrillary tangle pathology may serve as a prognostic biomarker but further research will be required.
Our consecutive DLB patients were mildly demented. We did not include DLB patients with more severe clinical disease as it has been challenging to acquire multimodality imaging of sufficient quality from DLB patients with moderate to severe dementia, a frequent problem in multimodality imaging studies in DLB patients. At this milder stage, a lower perfusion in precuneus and cuneus, relative to perfusion in cerebellar gray matter, correlated with greater clinical impairment by higher CDR-SOB, lower DRS and lower MMSE. However, there was no correlation between ASL-CISr as such and clinical disease severity; or between perfusion in the posterior cingulate cortex relative to cerebellum and the clinical measures of disease severity. This may be due to the relatively lower amount of AD-related tau pathology in posterior cingulate cortex in our DLB patients, or because the perfusion in precuneus and cuneus (as opposed to perfusion in posterior cingulate cortex) may reflect the severity of underlying pathologies, their interactions and associated clinical impairment more optimally. The Lewy body and AD-related pathologies may also progress at the different rates in these regions; a recent study using serial SPECT (Iizuka et al., 2017) reported that CISr was initially low in prodromal DLB patients, then high in mild DLB patients and again lower on follow up SPECT in DLB patients, potentially due to the progression of AD-related pathology.
AUROC statistics is commonly used to compare the diagnostic imaging methods. Using AUROC statistics, FDG-CISr was more accurate than ASL in distinguishing DLB and AD dementia patients possibly due to lower signal-to-noise ratio of the ASL acquisition. However, ASL-CISr also performed favorably with good sensitivity. Using a head array receiver coil with a higher number of channels, or increasing the number of averages could potentially increase the diagnostic accuracy for ASL-CISr measurement. Given the practical advantages of ASL, ASL-CISr may be considered as a potential screening tool for DLB in the clinical settings.
An internal reference region is needed in the quantitative analysis of cerebral blood flow because of the wide subject-to-subject variability in cerebral perfusion. We chose the whole cerebellar gray matter as an internal reference for ASL, and for consistency for FDG-PET, for the following reasons: 1) The ASL acquisition covered the entire cerebral and cerebellar hemispheres and signal-to-noise ratio in the cerebellum was on par with that of the cerebrum; 2) cerebellum has not been preferentially affected by either Lewy body or AD pathology.
ASL-MRI is a non-invasive and radiotracer-free imaging modality that may be considered and further developed as tool for screening and diagnosis of DLB in a wide range of the clinical facilities where FDG-PET is not accessible.
Study funding
This study was funded by the NIH (R01-AG040042, R01-AG11378, P50-AG16574, U01-AG06786, U01-AG024904, R01-AG041851 and C06-RR018898), Foundation Dr. Corinne Schulerand, the Mangurian Foundation for Lewy Body Research, The Elsie and Marvin Dekelboum Family Foundation, and the Robert H. and Clarice Smith and Abigail Van Buren Alzheimer's Disease Research Program.
Acknowledgements and disclosures
We would like to greatly thank AVID Radiopharmaceuticals, Inc., for their support in supplying AV-1451 precursor, chemistry production advice and oversight, and FDA regulatory cross-filing permission and documentation needed for this work.
M. Senjem, S. Przybelski, T. Lesnick, C. Schwarz, D. Jones and R. Savica report no disclosures. Z. Nedelska was supported by a joint Research Fellowship 2016 provided by the International Brain Research Organization (IBRO) and the International Society for Neurochemistry (ISN), Czech Alzheimer Foundation and by CTSA Grant Number UL1 TR002377 from the National Center for Advancing Translational Sciences (NCATS), a component of the National Institutes of Health (NIH); its contents are solely the responsibility of the authors and do not necessarily represent the official view of NIH. V. Lowe is a consultant for Bayer Schering Pharma and receives research support from GE Healthcare, Siemens Molecular Imaging, AVID Radiopharmaceuticals, the NIH (National Institute on Aging [NIA], National Cancer Institute), the Elsie and Marvin Dekelboum Family Foundation, the MN Partnership for Biotechnology and Medical Genomics, and the Leukemia & Lymphoma Society. B. Boeve has served as an investigator for clinical trials sponsored by GE Healthcare, FORUM Pharmaceuticals, C2N Diagnostics and Axovant. He receives royalties from the publication of a book entitled Behavioral Neurology of Dementia (Cambridge Medicine, 2009). He serves on the Scientific Advisory Board of the Tau Consortium. He receives research support from the NIH (U01-AG045390, U54-NS092089, P50-AG016574, U01-AG006786, and R01-AG041797), the Mayo Clinic Dorothy and Harry T. Mangurian Jr. Lewy Body Dementia Program and the Little Family Foundation. Dr. Vemuri receives support from the NIH (R01-NS097495 and P50-AG16574 [PI]). Dr. Graff-Radford receives research support from the NIH-NIA under Award Number K76AG057015. D. Knopman served as Deputy Editor for Neurology®; served on a Data Safety Monitoring Board for Lilly Pharmaceuticals; serves on a Data Safety Monitoring Board for Lundbeck Pharmaceuticals and for the DIAN study; served as a consultant to TauRx Pharmaceuticals ending in November 2012; was an investigator in clinical trials sponsored by Baxter and Elan Pharmaceuticals in the past 2 years; is currently an investigator in a clinical trial sponsored by TauRx; and receives research support from the NIH. R. Petersen serves on scientific advisory boards for Pfizer, Elan Pharmaceuticals, Wyeth Pharmaceuticals, and GE Healthcare, receives royalties from the publication of Mild Cognitive Impairment (Oxford University Press, 2003); and receives research support from the NIH/NIA and receives research support from the NIH (P50-AG16574 [PI] and U01-AG06786 [PI], R01-AG11378 [Co—I], and U01–24904 [Co—I]). C. Jack serves as a consultant for Janssen, Bristol-Meyer-Squibb, General Electric, and Johnson & Johnson; is involved in clinical trials sponsored by Allon and Baxter, Inc.; and receives research support from Pfizer, Inc., the NIA (AG11378 [PI], P50-AG16574 [Co—I], and U01-AG024904–01 [Co—I]), and the Alexander Family Alzheimer's Disease Research Professorship of the Mayo Foundation. K. Kantarci serves on the Data Safety Monitoring Board for Takeda Global Research & Development Center, Inc.; data monitoring boards of Pfizer and Janssen Alzheimer Immunotherapy; and is funded by the NIH (R01-AG040042 [PI], R21-NS066147 [PI], P50-AG44170/Project 2 [PI], P50-AG16574/Project 1 [PI], and R01-AG11378 [Co—I]).
References
- AASM . American Academy of Sleep Medicine; Chicago: 2005. International Classification of Sleep Disorders—2: Diagnostic and Coding Manual. [Google Scholar]
- Alsop D.C., Detre J.A., Golay X., Gunther M., Hendrikse J., Hernandez-Garcia L. Recommended implementation of arterial spin-labeled perfusion MRI for clinical applications: a consensus of the ISMRM perfusion study group and the European consortium for ASL in dementia. Magn. Reson. Med. 2015;73(1):102–116. doi: 10.1002/mrm.25197. [DOI] [PMC free article] [PubMed] [Google Scholar]
- Binnewijzend M.A., Kuijer J.P., van der Flier W.M., Benedictus M.R., Moller C.M., Pijnenburg Y.A. Distinct perfusion patterns in Alzheimer's disease, frontotemporal dementia and dementia with Lewy bodies. Eur. Radiol. 2014;24(9):2326–2333. doi: 10.1007/s00330-014-3172-3. [DOI] [PubMed] [Google Scholar]
- Buxton R.B., Frank L.R. A model for the coupling between cerebral blood flow and oxygen metabolism during neural stimulation. J. Cereb. Blood Flow Metab. 1997;17(1):64–72. doi: 10.1097/00004647-199701000-00009. [DOI] [PubMed] [Google Scholar]
- Chen Y., Wolk D.A., Reddin J.S., Korczykowski M., Martinez P.M., Musiek E.S. Voxel-level comparison of arterial spin-labeled perfusion MRI and FDG-PET in Alzheimer disease. Neurology. 2011;77(22):1977–1985. doi: 10.1212/WNL.0b013e31823a0ef7. [DOI] [PMC free article] [PubMed] [Google Scholar]
- Dai W., Garcia D., de Bazelaire C., Alsop D.C. Continuous flow-driven inversion for arterial spin labeling using pulsed radio frequency and gradient fields. Magn. Reson. Med. 2008;60(6):1488–1497. doi: 10.1002/mrm.21790. [DOI] [PMC free article] [PubMed] [Google Scholar]
- Detre J.A., Wang J., Wang Z., Rao H. Arterial spin-labeled perfusion MRI in basic and clinical neuroscience. Curr. Opin. Neurol. 2009;22(4):348–355. doi: 10.1097/WCO.0b013e32832d9505. [DOI] [PubMed] [Google Scholar]
- Ferman T.J., Smith G.E., Boeve B.F., Ivnik R.J., Petersen R.C., Knopman D. DLB fluctuations: specific features that reliably differentiate DLB from AD and normal aging. Neurology. 2004;62(2):181–187. doi: 10.1212/wnl.62.2.181. [DOI] [PubMed] [Google Scholar]
- Graff-Radford J., Boeve B.F., Pedraza O., Ferman T.J., Przybelski S., Lesnick T.G. Imaging and acetylcholinesterase inhibitor response in dementia with Lewy bodies. Brain. 2012;135(Pt 8):2470–2477. doi: 10.1093/brain/aws173. [DOI] [PMC free article] [PubMed] [Google Scholar]
- Graff-Radford J., Murray M.E., Lowe V.J., Boeve B.F., Ferman T.J., Przybelski S.A. Dementia with Lewy bodies: basis of cingulate island sign. Neurology. 2014;83(9):801–809. doi: 10.1212/WNL.0000000000000734. [DOI] [PMC free article] [PubMed] [Google Scholar]
- Halliday G.M., Holton J.L., Revesz T., Dickson D.W. Neuropathology underlying clinical variability in patients with synucleinopathies. Acta Neuropathol. 2011;122(2):187–204. doi: 10.1007/s00401-011-0852-9. [DOI] [PubMed] [Google Scholar]
- Hammes J., Bischof G.N., Giehl K., Faber J., Drzezga A., Klockgether T. Elevated in vivo [18F]-AV-1451 uptake in a patient with progressive supranuclear palsy. Mov. Disord. 2017;32(1):170–171. doi: 10.1002/mds.26727. [DOI] [PubMed] [Google Scholar]
- Iizuka T., Kameyama M. Cingulate island sign on FDG-PET is associated with medial temporal lobe atrophy in dementia with Lewy bodies. Ann. Nucl. Med. 2016;30(6):421–429. doi: 10.1007/s12149-016-1076-9. [DOI] [PubMed] [Google Scholar]
- Iizuka T., Iizuka R., Kameyama M. Cingulate island sign temporally changes in dementia with Lewy bodies. Sci. Rep. 2017;7(1):14745. doi: 10.1038/s41598-017-15263-2. [DOI] [PMC free article] [PubMed] [Google Scholar]
- Imabayashi E., Yokoyama K., Tsukamoto T., Sone D., Sumida K., Kimura Y. The cingulate island sign within early Alzheimer's disease-specific hypoperfusion volumes of interest is useful for differentiating Alzheimer's disease from dementia with Lewy bodies. EJNMMI Res. 2016;6(1):67. doi: 10.1186/s13550-016-0224-5. [DOI] [PMC free article] [PubMed] [Google Scholar]
- Imabayashi E., Soma T., Sone D., Tsukamoto T., Kimura Y., Sato N. Validation of the cingulate island sign with optimized ratios for discriminating dementia with Lewy bodies from Alzheimer's disease using brain perfusion SPECT. Ann. Nucl. Med. 2017;31(7):536–543. doi: 10.1007/s12149-017-1181-4. [DOI] [PMC free article] [PubMed] [Google Scholar]
- Imamura T., Ishii K., Sasaki M., Kitagaki H., Yamaji S., Hirono N. Regional cerebral glucose metabolism in dementia with Lewy bodies and Alzheimer's disease: a comparative study using positron emission tomography. Neurosci. Lett. 1997;235(1–2):49–52. doi: 10.1016/s0304-3940(97)00713-1. [DOI] [PubMed] [Google Scholar]
- Irwin D.J., Grossman M., Weintraub D., Hurtig H.I., Duda J.E., Xie S.X. Neuropathological and genetic correlates of survival and dementia onset in synucleinopathies: a retrospective analysis. Lancet Neurol. 2017;16(1):55–65. doi: 10.1016/S1474-4422(16)30291-5. [DOI] [PMC free article] [PubMed] [Google Scholar]
- Ivnik R.J., Malec J.F., Smith G.E., Tangalos E.G., Petersen R.C., Kokmen E. Mayo's Older Americans Normative Studies: WAIS-R, WMS-R and AVLT norms for ages 56 through 97. Clin. Neuropsychol. 1992;6(Suppl. 2):1–104. [Google Scholar]
- Kantarci K., Lowe V.J., Boeve B.F., Weigand S.D., Senjem M.L., Przybelski S.A. Multimodality imaging characteristics of dementia with Lewy bodies. Neurobiol. Aging. 2012;33(9):2091–2105. doi: 10.1016/j.neurobiolaging.2011.09.024. Sep 21,2012. [DOI] [PMC free article] [PubMed] [Google Scholar]
- Kantarci K., Lowe V.J., Boeve B.F., Senjem M.L., Tosakulwong N., Lesnick T.G. AV-1451 tau and beta-amyloid positron emission tomography imaging in dementia with Lewy bodies. Ann. Neurol. 2017;81(1):58–67. doi: 10.1002/ana.24825. [DOI] [PMC free article] [PubMed] [Google Scholar]
- Kokmen E., Smith G.E., Petersen R.C., Tangalos E., Ivnik R.C. The short test of mental status. Correlations with standardized psychometric testing. Arch. Neurol. 1991;48(7):725–728. doi: 10.1001/archneur.1991.00530190071018. [DOI] [PubMed] [Google Scholar]
- Lim S.M., Katsifis A., Villemagne V.L., Best R., Jones G., Saling M. The 18F-FDG PET cingulate island sign and comparison to 123I-beta-CIT SPECT for diagnosis of dementia with Lewy bodies. J. Nucl. Med. 2009;50(10):1638–1645. doi: 10.2967/jnumed.109.065870. [DOI] [PubMed] [Google Scholar]
- Mckeith I.G., Dickson D.W., Lowe J., Emre M., O'Brien J.T., Feldman H. Diagnosis and management of dementia with Lewy bodies: third report of the DLB consortium. Neurology. 2005;65(12):1863–1872. doi: 10.1212/01.wnl.0000187889.17253.b1. [DOI] [PubMed] [Google Scholar]
- Mckeith I.G., Boeve B.F., Dickson D.W., Halliday G., Taylor J.P., Weintraub D. Diagnosis and management of dementia with Lewy bodies: fourth consensus report of the DLB consortium. Neurology. 2017;89(1):88–100. doi: 10.1212/WNL.0000000000004058. [DOI] [PMC free article] [PubMed] [Google Scholar]
- Mckhann G.M., Knopman D.S., Chertkow H., Hyman B.T., Jack C.R., Jr., Kawas C.H. The diagnosis of dementia due to Alzheimer's disease: recommendations from the National Institute on Aging-Alzheimer's Association workgroups on diagnostic guidelines for Alzheimer's disease. Alzheimers Dement. 2011;7(3):263–269. doi: 10.1016/j.jalz.2011.03.005. [DOI] [PMC free article] [PubMed] [Google Scholar]
- Meltzer C.C., Kinahan P.E., Greer P.J., Nichols T.E., Comtat C., Cantwell M.N. Comparative evaluation of MR-based partial-volume correction schemes for PET. J. Nucl. Med. 1999;40(12):2053–2065. [PubMed] [Google Scholar]
- Merdes A.R., Hansen L.A., Jeste D.V., Galasko D., Hofstetter C.R., Ho G.J. Influence of Alzheimer pathology on clinical diagnostic accuracy in dementia with Lewy bodies. Neurology. 2003;60(10):1586–1590. doi: 10.1212/01.wnl.0000065889.42856.f2. [DOI] [PubMed] [Google Scholar]
- Minoshima S., Giordani B., Berent S., Frey K.A., Foster N.L., Kuhl D.E. Metabolic reduction in the posterior cingulate cortex in very early Alzheimer's disease. Ann. Neurol. 1997;42(1):85–94. doi: 10.1002/ana.410420114. [DOI] [PubMed] [Google Scholar]
- Minoshima S., Foster N.L., Sima A.A., Frey K.A., Albin R.L., Kuhl D.E. Alzheimer's disease versus dementia with Lewy bodies: cerebral metabolic distinction with autopsy confirmation. Ann. Neurol. 2001;50(3):358–365. doi: 10.1002/ana.1133. [DOI] [PubMed] [Google Scholar]
- Mok W., Chow T.W., Zheng L., Mack W.J., Miller C. Clinicopathological concordance of dementia diagnoses by community versus tertiary care clinicians. Am. J. Alzheimers Dis. Other Dement. 2004;19(3):161–165. doi: 10.1177/153331750401900309. [DOI] [PMC free article] [PubMed] [Google Scholar]
- Musiek E.S., Chen Y., Korczykowski M., Saboury B., Martinez P.M., Reddin J.S. Direct comparison of fluorodeoxyglucose positron emission tomography and arterial spin labeling magnetic resonance imaging in Alzheimer's disease. Alzheimers Dement. 2012;8(1):51–59. doi: 10.1016/j.jalz.2011.06.003. [DOI] [PMC free article] [PubMed] [Google Scholar]
- Nelson P.T., Jicha G.A., Kryscio R.J., Abner E.L., Schmitt F.A., Cooper G. Low sensitivity in clinical diagnoses of dementia with Lewy bodies. J. Neurol. 2010;257(3):359–366. doi: 10.1007/s00415-009-5324-y. [DOI] [PMC free article] [PubMed] [Google Scholar]
- Petersen R.C., Roberts R.O., Knopman D.S., Geda Y.E., Cha R.H., Pankratz V.S. Prevalence of mild cognitive impairment is higher in men. The Mayo Clinic study of aging. Neurology. 2010;75(10):889–897. doi: 10.1212/WNL.0b013e3181f11d85. [DOI] [PMC free article] [PubMed] [Google Scholar]
- Reiman E.M., Caselli R.J., Yun L.S., Chen K., Bandy D., Minoshima S. Preclinical evidence of Alzheimer's disease in persons homozygous for the epsilon 4 allele for apolipoprotein E. N. Engl. J. Med. 1996;334(12):752–758. doi: 10.1056/NEJM199603213341202. [DOI] [PubMed] [Google Scholar]
- Roberts R.O., Geda Y.E., Knopman D.S., Cha R.H., Pankratz V.S., Boeve B.F. The Mayo Clinic study of aging: design and sampling, participation, baseline measures and sample characteristics. Neuroepidemiology. 2008;30(1):58–69. doi: 10.1159/000115751. [DOI] [PMC free article] [PubMed] [Google Scholar]
- Roquet D., Sourty M., Botzung A., Armspach J.P., Blanc F. Brain perfusion in dementia with Lewy bodies and Alzheimer's disease: an arterial spin labeling MRI study on prodromal and mild dementia stages. Alzheimers Res. Ther. 2016;8:29. doi: 10.1186/s13195-016-0196-8. [DOI] [PMC free article] [PubMed] [Google Scholar]
- Taylor J.P., Firbank M.J., He J., Barnett N., Pearce S., Livingstone A. Visual cortex in dementia with Lewy bodies: magnetic resonance imaging study. Br. J. Psychiatry. 2012;200(6):491–498. doi: 10.1192/bjp.bp.111.099432. [DOI] [PMC free article] [PubMed] [Google Scholar]
- Tzourio-Mazoyer N., Landeau B., Papathanassiou D., Crivello F., Etard O., Delcroix N. Automated anatomical labeling of activations in SPM using a macroscopic anatomical parcellation of the MNI MRI single-subject brain. NeuroImage. 2002;15(1):273–289. doi: 10.1006/nimg.2001.0978. [DOI] [PubMed] [Google Scholar]
- Whitwell J.L., Graff-Radford J., Singh T.D., Drubach D.A., Senjem M.L., Spychalla A.J. 18F-FDG PET in posterior cortical atrophy and dementia with Lewy bodies. J. Nucl. Med. 2017;58(4):632–638. doi: 10.2967/jnumed.116.179903. [DOI] [PMC free article] [PubMed] [Google Scholar]
- Williams D.S., Detre J.A., Leigh J.S., Koretsky A.P. Magnetic resonance imaging of perfusion using spin inversion of arterial water. Proc. Natl. Acad. Sci. U. S. A. 1992;89(1):212–216. doi: 10.1073/pnas.89.1.212. [DOI] [PMC free article] [PubMed] [Google Scholar]
- Wolk D.A., Detre J.A. Arterial spin labeling MRI: an emerging biomarker for Alzheimer's disease and other neurodegenerative conditions. Curr. Opin. Neurol. 2012;25(4):421–428. doi: 10.1097/WCO.0b013e328354ff0a. [DOI] [PMC free article] [PubMed] [Google Scholar]
- Xu G., Rowley H.A., Wu G., Alsop D.C., Shankaranarayanan A., Dowling M. Reliability and precision of pseudo-continuous arterial spin labeling perfusion MRI on 3.0 T and comparison with 15O-water PET in elderly subjects at risk for Alzheimer's disease. NMR Biomed. 2010;23(3):286–293. doi: 10.1002/nbm.1462. [DOI] [PMC free article] [PubMed] [Google Scholar]