

Abstract
Poor executive functioning increases risk of decline in Mild Cognitive Impairment (MCI). Executive functioning can be conceptualized within the framework of working memory. While some components are responsible for maintaining representations in working memory, the central executive is involved in the manipulation of information and creation of new representations. We aimed to examine the neural correlates of these components of working memory using a maintenance working memory and visuospatial reasoning task. Twenty-five patients with amnestic MCI and 19 elderly controls (EC) completed functional MRI during reasoning and maintenance working memory tasks. In MCI, maintenance working memory was associated with hypoactivation of right frontoparietal regions and hyperactivation of left prefrontal cortex, coupled with attenuation of default mode network (DMN) relative to EC. During reasoning, MCI showed hypoactivation of parietal regions, coupled with attenuation of anterior DMN and increased deactivation of posterior DMN relative to EC. Comparing the reasoning task to the maintenance working memory task yields the central executive. In MCI, the central executive showed hypoactivation of right parietal lobe and increased deactivation of posterior DMN compared to EC. Consistent with prior work on executive functioning, MCI show different neural circuitry during visuospatial reasoning, including changes to both task positive frontoparietal regions, as well as to deactivation patterns within the DMN. Both hyperactivation of task positive networks and increased deactivation of DMN may be compensatory.
Keywords: Mild cognitive impairment, Executive functioning, Working memory, Prefrontal cortex, Default mode network
Highlights
-
•
MCI show changes to task positive & negative networks during executive functioning.
-
•
MCI show hypoactivation of parietal cortex & attenuation of medial PFC deactivation.
-
•
Hypoactivation occurs in regions vulnerable to AD pathology.
-
•
MCI show hyperactivation of left PFC & more deactivation of posterior DMN.
-
•
These activity increases correlate with stronger cognition and may be compensatory.
1. Introduction
Mild Cognitive Impairment (MCI) is a diagnosis given to older adults who show declines in cognition, but retain generally intact ability to manage instrumental activities of daily living (IADLs) such as managing finances and medications. Patients with amnestic MCI (MCI) are at increased risk of conversion to dementia due to Alzheimer's Disease (AD) (Albert et al., 2011). While severity of memory impairment is associated with disease progression (Gainotti et al., 2014), declines in executive functioning (EF), such as reasoning and problem-solving, are also predictive (Dickerson et al., 2007; Tabert et al., 2006). While there is an extensive literature investigating the neural correlates of memory dysfunction in MCI, only a few studies have examined neural activation patterns associated with poor EF in MCI.
Neuropsychologists define EF as those abilities that enable an individual to engage in purposeful, self-serving behavior (Lezak, 1995), and includes behaviors such as volition, planning, the ability to translate a plan into productive behavior, and self-monitoring. It represents a broad set of cognitive abilities that appear to share variance, but can be separated into distinct abilities such as shifting between tasks, updating information in working memory, and inhibition of prepotent responses (Miyake et al., 2000). There are many ways to conceptualize EF. From a cognitive science framework, EF can be considered in the context of working memory. Working memory is defined as the ability to temporarily hold on to and manipulate information. According to Baddeley (Baddeley, 2003; Baddeley and Hitch, 1974) working memory involves four interrelated processes: the visuospatial sketchpad, phonological loop, episodic buffer, and central executive. The visuospatial sketchpad and phonological loop are involved in the temporary representation of visual and auditory stimuli, respectively. The episodic buffer is a temporary storage mechanism that integrates information from both the visuospatial sketchpad and phonological loop, as well as long-term memory. The central executive acts as a central coordinator, and in this respect can 1) focus, divide, and switch attention, 2) connect the contents of working memory with long-term memory, and 3) manipulate information and create new representations.
Previous work has examined the neural correlates of working memory and executive processes in MCI. In general, when MCI participants performed as well as controls on working memory tasks, MCI patients showed hyperactivation in task regions (Migo et al., 2015; Yetkin et al., 2006). When MCI participants performed worse on the task at hand, fMRI patterns generally revealed hypoactivations (Alichniewicz et al., 2012; Berger et al., 2014; Lou et al., 2015). A similar pattern of findings has been reported in studies of executive processes, including tasks of inhibition, complex attention, and manipulation (Alichniewicz et al., 2012; Clément et al. (2013); Kaufmann et al., 2008; Rosano et al., 2005; Van Dam et al., 2013). Moreover, Clément et al. (2013) observed that high performing MCI patients showed hyperactivation of task regions, while low performing MCI patients showed hypoactivation. Thus MCI patients appear to show regional hyperactivation in normal task networks during executive processing when the task is within cognitive ability. Increased activation is generally interpreted as a compensatory response, suggesting that greater neural resources are required to maintain task performance.
In the past decade, fMRI research has started to focus on regional activity within “brain networks.” Most task-based fMRI studies focus on so called task-positive networks, regions identified when contrasting an experimental trial against either a control trial or fixation. These networks support goal-driven processing. It is also possible to examine task negative networks, identified by contrasting fixation or control trials to the primary experimental trials. Studies of task negative networks center on the default mode network (DMN). The DMN is thought to support self-relevant mentalizing characterized by introspective, task-independent thought and attention to internal, emotional states, as well as, perhaps, broad information gathering and sensory monitoring of the external environment (Buckner et al., 2008). DMN generally includes midline regions within posterior cingulate cortex, precuneus, medial PFC, and regions of parietal and lateral temporal cortex. Baseline activity in these regions decreases with engagement in a variety of goal-directed paradigms to support efficient performance. Suboptimal efficiency of both task positive networks and DMN likely underlies cognitive symptoms in MCI (Wermke et al., 2008).
There is a growing literature about deactivations in MCI. These studies typically observe attenuation of deactivations in MCI (e.g. Migo et al., 2015; Rombouts et al., 2005). In contrast, some work has been supportive of increased deactivation of medial posterior DMN in MCI during working memory (Kochan et al., 2010). Likewise, it has been observed that mild MCI patients show increased deactivation, while those with more severe impairment show an attenuation of deactivation during memory encoding (Celone et al., 2006). Thus MCI is also associated with disruption to task negative networks. While the reasons for this change is unclear, cognitive interpretations argue attenuation of deactivation may reflect that MCI patients have a more difficult time suppressing internal thoughts during cognitively demanding tasks, while increased deactivation may be compensatory.
Because of the literature suggesting that EF decline is associated with conversion from MCI to dementia, we sought to compare activity in brain regions involved in EF in an MCI sample versus elderly controls. More specifically, we aimed to extend current literature by examining potential alterations to both task positive and task negative cognitive networks. Recognizing that EF is a broad term, we specifically examined visuospatial reasoning, and conceptualized EF within the framework of Baddeley. Participants completed a fMRI task that was previously used to identify reasoning-related brain activity in young, healthy adults (Melrose et al., 2007). The task included both hard and easy maintenance working memory trials, and hard and easy reasoning trials. Maintenance working memory trials were thought to tap specifically into the visuospatial sketchpad. In young adults this task showed activation of frontoparietal regions (Melrose et al., 2007). Reasoning trials required the detection and application of a rule dictating a change across visuospatial stimuli, and conceptually relied on both the visuospatial sketchpad and the central executive. The role of the central executive in reasoning tasks has been hypothesized to include maintaining solutions within working memory, manipulation of self-generated information required to solve the reasoning trials, or integration of information from working memory with current task demands (Christoff et al., 2001; Kroger et al., 2002; Prabhakaran et al., 1997). This task likewise recruited frontoparietal regions in young adults. Reasoning-related activity was compared to working memory-related activity, allowing for elucidation of the neural correlates of the “central executive” (Baddeley, 2003), which in young adults included portions of prefrontal cortex (particularly anterior PFC and right ventral lateral PFC) and bilateral inferior parietal lobe. We administered this task to a group of MCI and healthy elderly controls (EC). Our aim was to identify the neural underpinnings of executive dysfunction as defined here in MCI. We hypothesized that MCI would show hyperactivation of task positive frontoparietal networks. Given that most fMRI studies have reported attenuation of deactivations in the DMN, we hypothesized that we would replicate this finding.
2. Methods
2.1. Clinical evaluation
2.1.1. Subjects
Participants were recruited from VA Greater Los Angeles Healthcare System (VA) clinics that regularly assess and treat older adults with cognitive disorders. Additional MCI and EC patients were recruited from VA Primary Care clinics and the community. Participants were excluded if they reported history of major psychiatric illness other than depression/anxiety, history of substance abuse within the past 5 years, history of severe traumatic brain injury, history of stroke, history of other medical/neurologic illness that could account for cognitive deficits, showed cortical or subcortical infarcts on MRI, or had any contraindications to MRI safety. Sixty-two participants completed fMRI scanning. Of these, ten were excluded for evidence of cortical infarct or subcortical infarct(s). Two MCI and five EC participants were excluded from further analysis because there were no behavioral responses recorded during fMRI scanning. One additional EC participant was excluded due to registration errors during image processing. The final data set included twenty-five patients with amnestic MCI and 19 cognitively healthy elderly controls (EC).
This study was approved by the VA Institutional Review Board and Research & Development Committee and the UCLA IRB.
2.1.2. Evaluation procedures and diagnosis
All patients provided written informed consent per VA and UCLA protocol. Patients completed a clinical interview and medical records were reviewed to confirm exclusion criteria as outlined above. Patients completed neuropsychological testing (see Table 1 for list of tests and mean scores per group). Diagnosis was made by two neuropsychologists, in accordance with Winblad & Petersen criteria (Winblad et al., 2004). Patients with MCI showed impairment (~1.5 standard deviations or more) on at least one memory test. Non-memory domains were additionally rated to yield amnestic vs multidomain amnestic diagnoses. Eight patients met criteria for aMCI and 17 for multidomain amnestic MCI. ECs did not show any domains of cognitive impairment.
Table 1.
Demographic and clinical data.
| Control (n = 19) |
MCI (n = 25) |
p-value | |
|---|---|---|---|
| Mean (S.D.) | Mean (S.D.) | ||
| Demographic information | |||
| Age (yrs.) | 71.84 (6.6) | 75.52 (7.5) | t = 1.7, p = 0.09 |
| Education (yrs.) | 16 (2.1) | 15.76 (2.4) | t = .35, p > 0.5 |
| Gender | M = 15, F = 4 | M = 20, F = 5 | X2 = 0.007, p > 0.5 |
| Neuropsychological profile | |||
| Estimated Verbal IQ | |||
| WTAR estimated VIQ | 110.9 (8.2) | 105.8 (9.6) | t = 1.9, p = 0.07 |
| Global cognition | |||
| MMSEc | 29.1 (0.58) | 27.3 (2.2) | t = 3.4, p = 0.002 |
| Intellectual functioning | |||
| WAIS- IV Information SS | 12.7 (2.9) | 11 (3.1) | t = 1.9, p = 0.07 |
| Attention/executive functioning | |||
| Trails A (sec)a | 40.3 (14.4) | 49.7 (17.3) | t = 1.9, p = 0.07 |
| Trails B (sec)b | 86.4 (33.6) | 135.9 (72.0) | U = 93, p = 0.006 |
| Golden Stroop Color-Word T score | 47 (9.1) | 38.8 (9.6) | t = 2.9, p = 0.006 |
| Memory | |||
| CVLT learning (trials1–5) T score | 56.9 (9.1) | 47.7 (11.9) | t = 2.8, p = 0.008 |
| CVLT Delayed Recall z-score | 0.5 (0.9) | −0.9(1.3) | t = 4.2, p < 0.001 |
| WMS-R Logical Memory I SS | 10 (1.7) | 7.1 (2.7) | t = 4.1, p < 0.001 |
| WMS-R Logical Memory II SS | 9.7 (1.6) | 7.0 (2.9) | t = 3.7, p < 0.001 |
| REY-O Immediate Recall T scored | 59.7 (10.4) | 40.7 (12) | t = 5.3, p < 0.001 |
| BVMT-R Total Recall T scorec | 45.1 (9.2) | 31.2 (10.3) | t = 4.6, p < 0.001 |
| BVMT-R Delayed Recall T scorec | 50.6 (10) | 32.6 (10.3) | t = 5.7, p < 0.001 |
| Language | |||
| Boston Naming Test SS | 13.4 (2.7) | 10.2 (3.7) | t = 3.1, p = 0.003 |
| FAS z-scorea | 0.07 (0.9) | −0.1 (1.02) | t = 0.56, p = 0.58 |
| Animals z-score | .53 (.88) | −0.27 (1.1) | t = 2.7, p = 0.01 |
| WAIS-IV Similarities SSa | 12.9 (2.6) | 11.8 (2.2) | t = 1.7, p = 0.10 |
| Visuospatial | |||
| WAIS-IV Block Design SS | 10.6 (1.7) | 9.6 (1.9) | t = 2.0, p = 0.06 |
| WAIS-IV Matrix Reasoning SSa | 11.5 (3.0) | 11.5 (4.0) | t = 0.06, p > 0.5 |
| Processing speed | |||
| WAIS-IV Coding SS | 10.5 (2.4) | 8.9 (2.2) | t = 2.3, p = 0.03 |
| Psychological functioning | |||
| Global Depression Scale Rawc | 3.9 (2.7) | 7.5 (6.2) | U = 131.0, p = 0.02 |
WTAR = Wechsler Test of Adult Reading, MMSE = Mini-Mental Status Exam, WAIS-IV = Wechsler Adult Intelligence Scale-IV, CVLT = California Verbal Learning Test-II, WMS-R = Wechsler Memory Scale-Revised, Rey-O = Rey–Osterrieth complex figure, BVMT-R = Brief Visuospatial Memory Test–Revised; SS = Scaled Score.
Data from one MCI participant was not available.
Data from 5 MCI participants was not available.
Data from one EC participant was not available.
Data from two EC participants was not available.
2.2. MRI
2.2.1. MRI procedure
Participants returned for MRI scanning within 3 months of their initial appointment (3 patients had extended periods: one EC was scanned 7.5 months after baseline; one MCI was scanned 4.5 months later and one MCI was scanned 11 months after baseline). Scanning was performed at the VA on a 3T Siemens Skyra scanner (Erlangen, Germany) with a 20 channel head/neck coil. MRI stimuli were presented via MRI compatible goggles (MRI Resonance Technology). Participants wore headphones and held a Resonance Technology response button box in their right hand. Each session began with a T1-weighted magnetization prepared rapid-acquisition gradient echo (MPRAGE) structural sequence (256 × 256, TR = 1900 ms, TE = 2.5 ms, flip angle = 9°, thickness = 1.0 mm, 1 × 1 × 1 mm3). A T2*-weighted blood oxygen level-dependent (BOLD) gradient echo planar imaging (EPI) sequence was obtained for each activation task run (64 × 64, TR = 2000 ms, TE = 30 ms, flip angle = 80°, slice thickness = 5 mm, 28 slices, 3 × 3 × 5 mm3, volumes = 114).
2.2.2. fMRI task
Participants completed two fMRI tasks, the Match task and Reasoning task (Fig. 1).
Fig. 1.
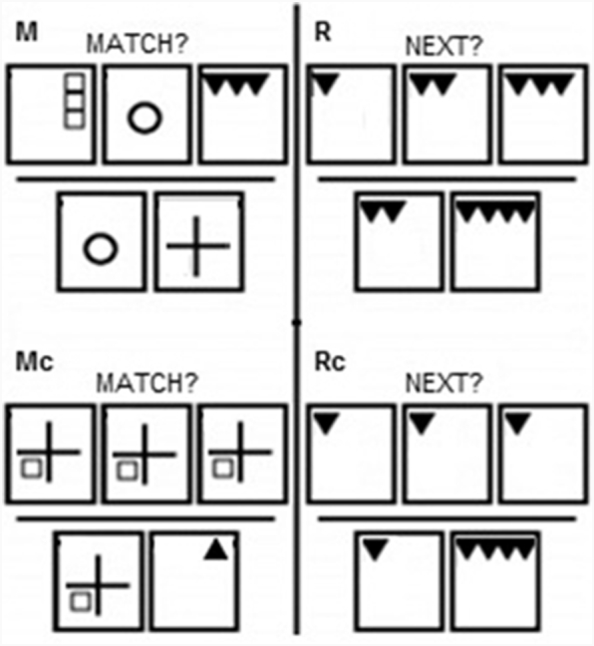
fMRI Task. In the M and Mc conditions, the subject sees three pictures along the top of the screen and is instructed to remember these pictures. After six seconds, this row disappears and two answers immediately appear at the bottom. The subject is instructed to find the MATCH to the previously studied pictures. In the R and Rc conditions, the subject is instructed to predict the NEXT picture in the sequence. After six seconds, the top row disappears and two possible answer choices appear. The subject is instructed to press the button corresponding to the correct answer.
Both tasks consisted of experimental and control (c) conditions, and followed a slow event related design. All stimuli consisted of geometrical patterns. The Match task assessed maintenance working memory. It consisted of both hard Match (M) experimental and easy Match control (Mc) trials. In M trials, subjects were shown three different pictures along the top of the screen for 6 s, and instructed to remember them. Immediately following this, the top row disappeared, and subjects saw two pictures on the bottom of the screen. Subjects were asked to find the MATCH to one of the pictures they just studied. This phase lasted for 4 s. The format of Mc was the same, but during the presentation phase the same picture was displayed in all three locations. The Reasoning task consisted of two conditions, hard Reasoning (R) experimental and easy Reasoning control (Rc) trials. For both conditions, subjects were first shown 3 boxes in a row for 6 s, and instructed to determine what the NEXT picture in the sequence would be. Immediately following this, the top row disappeared, and subjects saw two pictures on the bottom of the screen. Subjects were instructed to press a button to indicate which answer best completed the sequence. This phase lasted for 4 s. In the R condition, the stimuli in the top boxes changed (as described below). In the Rc condition all three top boxes contained the same image. Although both conditions involve deducing and applying a rule, only the R condition involved deducing a rule that dictated a change. The two answers consisted of the correct answer (the next pattern in the sequence) and a foil.
Participants completed a total of 8 runs. Trials from each of the 4 task conditions (M, Mc, R, and Rc) were randomized throughout each run. Each run had 4 trials per condition, for a total of 16 trials. Fixation crosses were randomly jittered throughout the run, with durations spanning from 2 to 20 s. Each run lasted for 228 s.
2.3. Image processing
2.3.1. Structural image processing
Cortical and sub-cortical reconstruction and segmentation was performed on the structural MPRAGE images using the FreeSurfer image analysis suite (http://surfer.nmr.mgh.harvard.edu/; version number: Darwin-lion-dev-20150701). Segmentation was reviewed and manual adjustments to grey-white boundaries were made if needed. The hippocampal region-of-interest (ROI) was created by adding together volumes across hemispheres and dividing by intracranial cavity volume. We created three bilateral cortical ROIs known to be vulnerable to the progression of MCI (Carmichael et al., 2013). These included the total volume of the “default mode network” (DMN ROI), which consists of medial posterior regions, inferior parietal, and lateral temporal regions; a medial temporal lobe (MTL ROI), including medial temporal cortical regions); and a Frontal ROI, including prefrontal cortex.
2.3.2. Functional image processing
Functional BOLD images were analyzed using the FMRIB Software Library (FSL v 5.0.4; Analysis Group, Oxford, UK) (Woolrich et al., 2009). Data were spatially smoothed using an 8 mm full-width at half-maximum Gaussian kernel and temporally filtered using a 100 s cut-off highpass filter. Slice timing correction was applied (interleaved). Skull stripping of both MPRAGE and BOLD images was completed using Brain Extraction Tool (BET; (Smith, 2002). Movement parameters, calculated using MCFLIRT (Jenkinson and Smith, 2001), were modeled as nuisance covariates. Translational movement parameters of each run did not exceed 3 mm. Using FLIRT (FMRIB's Linear Image Registration Tool v6.0) (Jenkinson and Smith, 2001), BOLD images were registered to the T1-weighted MPRAGE via affine transformation (6 degrees of freedom), then to Montreal Neurological Institute (MNI) standard space (affine transformation, 12 degrees of freedom). Data were visually inspected to ensure accurate registration.
2.4. Analysis
2.4.1. Demographic and neuropsychological data analysis
Neuropsychological and volumetric data were compared between groups using two sample t-test or Mann-Whitney U when appropriate (Table 1). Analyses were conducted with SPSS version 24.
Composite cognitive scores were created for the memory and executive domains. First, raw scores were converted to z-scores via published norms. These were then averaged together. Immediate memory composite included Logical Memory I (Ivnik et al., 1992), California Verbal Learning Test (CVLT) Trials 1–5 (Delis et al., 2000), and Brief Visuospatial Memory Test-R (BVMT-R) learning trials (Benedict, 1997). Delayed memory composite included Logical Memory II (Ivnik et al., 1992), Rey-Osterreith Complex Figure (ROCF) Recall (3 min; Meyers and Meyers, 1995), CVLT Long delay free recall (Delis et al., 2000), and BVMT-R delayed recall (Benedict, 1997). Average recognition discriminability (d′) was calculated from the CVLT (Delis et al., 2000), ROCF (Meyers and Meyers, 1995), and BVMT-R (Benedict, 1997) recognition conditions. Executive functioning component included letter fluency (FAS (Tombaugh et al., 1999), Trails B (Tombaugh, 2004), and Stroop Interference (Golden and Freshwater, 2002).
2.4.2. fMRI behavioral performance
Behavioral performance on the task was assessed via mixed ANOVA, with condition (R, Rc, M, Mc) as the within subjects factor, and diagnosis as the between subjects factor. Separate models were run for accuracy (percent correct) and reaction time (mean RT across all trials within a condition).
2.4.3. Image analysis
Analysis of functional imaging data was performed using a multi-stage general linear model approach with FEAT (fMRI Expert Analysis Tool v6.0) and a timing model based on a double-gamma hemodynamic response function. In the individual first-level analyses, each functional run was modeled separately. Only trials in which the participant responded correctly were included; incorrect trials were modeled as covariates of no interest. Fixation points were implicitly modeled. Contrasts of interest included M > Mc (Maintenance Working Memory), R > Rc (Reasoning), and R > M (Central Executive). Task-associated deactivations were also assessed (Mc > M, Rc > R, M > R). Individual runs were inspected after modeling. Any runs showing greater than 3 mm translational movement were removed from further analysis. In addition any runs in which a respondent showed no valid correct responses for a given trial (and thus showed no contrast map) were also excluded. The number of runs entering into higher level analysis was as follows: EC, average 7.1 runs, range 5–8; MCI average 7.1 runs, range 4–8. All runs for one individual were then averaged using fixed effects higher level modeling.
Within- and between-group effects for contrasts of interest were compared using mixed effects analysis via FLAME (FMRIB's Local Analysis of Mixed Effects stage 1 module (Beckmann et al., 2003). In order to tease apart task positive and negative findings, between group contrasts were masked with the appropriate within group map at a liberal threshold (p < .05 uncorrected). For example, to assess between group differences in task positive activity in Maintenance Working Memory (M > Mc), the EC > MCI between group map was masked with the EC M > Mc within group findings. The MCI > EC contrast was masked with the MCI M > Mc within group findings. To assess task negative findings, the EC > MCI comparison was masked with the EC Mc > M group map, and the MCI > EC comparison was masked with the MCI Mc > M within group findings.
Within group results were considered significant across the entire brain at p < .001, cluster size of 57 voxels, equivalent to a corrected threshold of p < .05 using Monte Carlo simulation with 10,000 simulations (Slotnick et al., 2003). Between-group differences were assessed at p < .01 with a cluster size of 85 voxels, which was significant at a corrected threshold of p < .05 across the entire brain using Monte Carlo simulation (10,000 simulations; (Slotnick et al., 2003). As the original data acquisition did not cover the entire cerebellum, only cortical and subcortical findings are reported.
In order to visualize the data and assess associations with clinical metrics, mean beta weights of voxels in regions that were significantly different between groups were extracted via the fslmeants utility and imported into SPSS. These values were correlated with task performance, neuropsychological composite scores, and structural volume to assess associations between BOLD activity, clinical outcomes, and volumetric data.
In order to understand what was driving any between group differences, fslmeants was also used to extract beta weights of each condition versus fixation (R > fixation, Rc > fixation, M > fixation, Mc > fixation). Mixed ANOVA was used to identify the condition(s) driving any significant between group differences. Greenhouse-Geisser corrected results are reported.
3. Results
3.1. Participant information
Demographic and neuropsychological functioning is presented in Table 1. Participants were largely male (EC male = 15, female = 4; MCI male = 20, female = 5).In the EC group, 1 identified as Hispanic, 5 as African American, and 13 as Caucasian.In the MCI group, 2 identified as Hispanic, 5 as African American, 1 as Asian, and 17 as Caucasian.Ten MCI patients were taking dementia medications (7 on donepezil, 1 on memantine, 2 on donepezil/galantamine and memantine). As expected, MCI participants performed worse on memory tests.
Between group t-tests showed that MCI had lower brain volume in the MTL ROI (t(41) = 2.20, p < .033; EC = .017, s.d. 002; MCI = .015, s.d. .002) and hippocampus (t(41) = 2.97, p < .005, EC = .0058, s.d. .0007; MCI = .0052, s.d. .0007). MCI showed a trend towards lower volume of DMN ROI (t(41) = 1.76, p = .086, EC = .105, s.d. = .013; MCI = .100, s.d. = .009). There were no differences in the Frontal ROI (p < .4).
3.2. Behavioral performance
See Fig. 2 for behavioral results. Regarding accuracy, results of the mixed ANOVA showed a main effect of condition (F(2.23,93.68) = 10.01, p < .001) and an interaction between condition and diagnosis (F(2.23,93.68) = 6.47, p = .002), but no overall effect of diagnosis (F(1,42) = 1.72, n.s.). Performance was highest on Mc, followed by Rc, M, and R. Performance on Mc was significantly better than all other conditions and Rc performance was better than R. The condition by diagnosis interaction was driven by lower performance in MCI on R (t(42) = 3.02, p = .004). Regarding reaction time, there was an effect of condition (F(2.55, 104.61 = 60.91, p < .001). Reaction time from fastest to slowest was as follows: Mc, Rc, R, M. All conditions were significantly different from one another. Although there was no effect of diagnosis or an interaction between condition and diagnosis, there was a trend towards slower reaction time on R in the MCI group (t(41) = 1.75, p = .09). In sum, MCI showed worse performance on R relative to EC. MCI performance was similar to EC for all other conditions. Across all participants, performance on R and M was lower and reaction time slower than their respective control conditions.
Fig. 2.
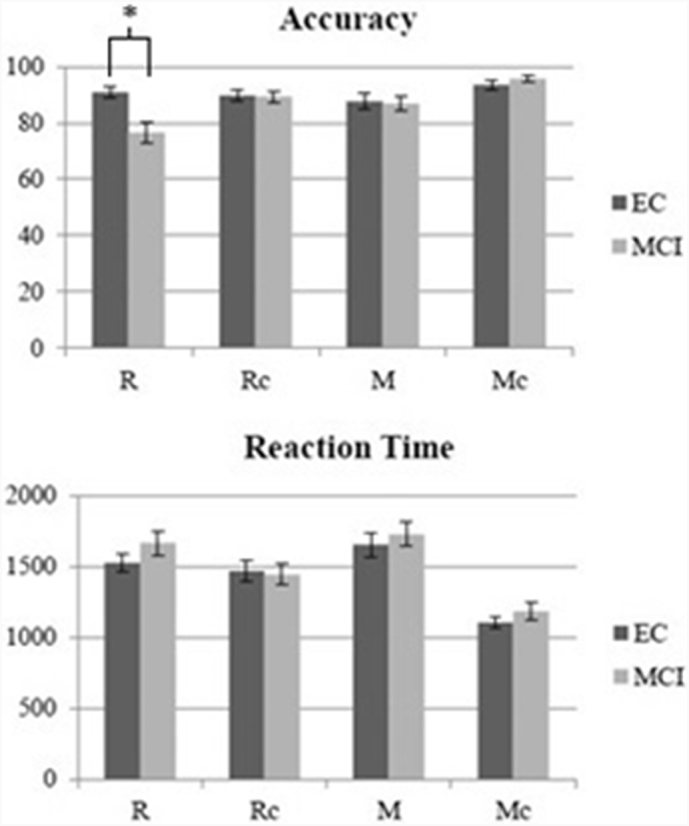
Behavioral performance. Percent correct (top) and mean reaction time (bottom) are presented for each group. Error bars reflect the standard error of the mean. *p < .05 (only between group differences are noted. See Results section for differences amongst the conditions). Range of scores was as follows for EC: R: 72–100%, Rc: 72–100%, M: 44–97%, Mc: 75–100%. Range of scores was as follows for MCI: R: 25–97%, Rc: 63–100%, M: 50–100%, Mc: 72–100%.
3.3. fMRI results
3.3.1. Maintenance working memory (MvMc)
3.3.1.1. Task positive
For the M > Mc within group contrasts, both groups showed activation of frontal-parietal and temporal regions (Fig. 3A, Supplementary Table 1).
Fig. 3.

A & B Maintenance Working Memory (Match Task): Neuroimaging findings significant at p < .05 corrected using Monte Carlo simulation (see Methods). Within group results of task positive and task negative networks reported in 3A. Between group findings reported in 3B. Bar graphs show the data underlying the between group differences. For the MCI > EC bar graph, results from the left MFG cluster only are shown. *p < .05.
Relative to EC, MCI showed hypoactivation of right MFG, bilateral SPL/intraparietal sulci (IPS), and right occipital pole (Fig. 3B, Table 2). We investigated this finding by extracting mean activity in the M > fixation and Mc > fixation contrasts. Mixed effects ANOVA showed hypoactivation in MCI was driven by an effect of condition (F(1,42) = 114.42, p < .001), diagnosis (F(1,42) = 15.67, p < .001) and condition by diagnosis interaction (F(1,42) = 18.46, p < .001). Both groups showed greater activity in M compared to Mc; MCI showed reduced activity in both conditions relative to EC (Fig. 3B, bar graph).
Table 2.
Maintenance Working Memory (Match task), between group results for the task positive (M > Mc) and task negative (Mc > M) contrasts. SPL = superior parietal lobule; STG = superior temporal gyrus; MTG = middle temporal gyrus; ITG = inferior temporal gyrus; SFG = superior frontal gyrus; MFG = middle frontal gyrus; IFG = inferior frontal gyrus; mPFC = medial prefrontal cortex; Max = maximum z-statistic within the cluster; x,y,z = voxel coordinates of maximum intensity within the cluster; R = right, L = left; BA = approximate Brodmann's Areas.
| Cluster size | Max | x | y | z | Region | Side | BA | |
|---|---|---|---|---|---|---|---|---|
| Task positive | ||||||||
| EC > MCI | 126 | 2.83 | 31 | 18 | 48 | occipital lobe | R | 18,19 |
| 473 | 3.59 | 32 | 35 | 49 | SPL | R | 7 | |
| 907 | 3.32 | 60 | 44 | 51 | SPL/IPS | L | 7,40 | |
| 87 | 2.9 | 29 | 62 | 58 | MFG/precentral gyrus | R | 6 | |
| 197 | 3.34 | 23 | 81 | 50 | MFG | R | 9/46 | |
| MCI > EC | 244 | 3.81 | 44 | 74 | 31 | mPFC | R/L | 25 |
| 113 | 3.02 | 64 | 75 | 63 | MFG | L | 9/46 | |
| Task negative | ||||||||
| EC > MCI | 952 | 3.81 | 44 | 74 | 31 | mPFC | R/L | 11 |
Relative to EC, MCI showed hyperactivation of left MFG and medial PFC (Fig. 3B, Table 2). This was driven by an effect of condition (F(1,42) = 4.43, p < .041 and a condition by diagnosis interaction (F(1,42) = 20.12, p < .001) but no overall effect of diagnosis. (n.s.). MCI showed greater activity in M relative to Mc; EC did not. MCI showed greater activity in M relative to EC, while there were no differences between groups in the Mc condition. In order to better understand the effects behind the left MFG activity specifically, mean activity from only this region was extracted. Results from this region only are shown in the bar graph in Fig. 3B. The MFG finding was driven by an effect of condition (F(1,42) = 26.592, p < .001 and a condition by diagnosis interaction (F(1,42) = 10.259, p = .003). There was no overall effect of diagnosis (n.s.). Both groups showed more activity in M relative to Mc. MCI showed greater activity in M than EC; there were no differences in Mc activation.
3.3.1.2. Task negative
EC showed deactivation of medial PFC and right posterior regions. MCI showed no significant areas of deactivation for the Mc > M contrast (Fig. 3A, Supplementary Table 1).
Relative to EC, MCI showed attenuation of deactivation in medial PFC (Fig. 3B, Table 2). Examination of the extracted data showed this was driven by an effect of condition (F(1,42) = 11.597, p = .001) and an interaction between condition and diagnosis (F(1.42) = 15.229, p < .001). There was no overall effect of diagnosis on activity (n.s.). EC showed greater deactivation during M than Mc; there were no differences between conditions within the MCI group. MCI showed less deactivation during M compared to EC; there were no between group differences in Mc deactivation.
There were no regions in which MCI showed greater deactivation than EC.
3.3.2. Reasoning (RvRc)
3.3.2.1. Task positive
Both groups showed activity of bilateral frontal, parietal, and temporal cortex (Fig. 4A, Supplementary Table 2).
Fig. 4.

A & B Reasoning: Neuroimaging findings significant at p < .05 corrected using Monte Carlo simulation (see Methods). Within group results of task positive and task negative networks reported in 3A. Between group findings reported in 3B. Bar graphs show the data underlying the between group differences. *p < .05.
Relative to EC, MCI showed hypoactivation of posterior regions in bilateral occipital cortex, bilateral SPL/precuneous, and right supramarginal gyrus (Fig. 4B, Table 3). This was driven by an effect of condition (F(1,42) = 18.45, p < .001, diagnosis (F(1,42) = 19.55, p < .001), and a condition by diagnosis interaction (F(1,42) = 11.26, p = .002). EC showed greater activity in R compared to Rc, whereas MCI did not. MCI showed lower activation in both the R and Rc conditions compared to EC.
Table 3.
Reasoning Task, between group results for the task positive (R > Rc) and task negative (Rc > R) contrasts. SPL = superior parietal lobule; STG = superior temporal gyrus; MTG = middle temporal gyrus; ITG = inferior temporal gyurs; SFG = superior frontal gyrus; MFG = middle frontal gyrus; IFG = inferior frontal gyrus; Max = maximum z-statistic within the cluster; x,y,z = voxel coordinates of maximum intensity within the cluster; R = right, L = left; BA = approximate Brodmann's Areas.
| Cluster size | Max | x | y | z | Region | Side | BA | |
|---|---|---|---|---|---|---|---|---|
| Task positive | ||||||||
| EC > MCI | 239 | 3.28 | 54 | 14 | 42 | Occipital pole | L | 18 |
| 1034 | 3.58 | 34 | 22 | 43 | Occipital cortex | R | 18/19 | |
| 155 | 3.73 | 60 | 23 | 35 | Occipital cortex | L | 18/19 | |
| 203 | 3.06 | 41 | 27 | 28 | Lingual gyrus/cerebellum | R | 18 | |
| 141 | 3.14 | 25 | 27 | 36 | Occipital cortex | R | 19 | |
| 167 | 2.89 | 52 | 33 | 63 | SPL/precuneous | L | 7 | |
| 397 | 3.2 | 40 | 38 | 72 | SPL/postcentral gyrus/precuneous | R | 7,5 | |
| 159 | 2.84 | 26 | 43 | 62 | Postcentral gyrus | R | 1–3,5 | |
| 105 | 3.14 | 17 | 51 | 57 | Supramarginal gyrus | R | 40 | |
| Task negative | ||||||||
| EC > MCI | 1270 | 3.47 | 41 | 72 | 28 | Inferior medial PFC | R/L | 11 |
| MCI > EC | 102 | 2.82 | 44 | 22 | 51 | Medial occipital | R/L | 18 |
There were no regions where MCI showed hyperactivation.
3.3.2.2. Task negative
For the Rc > R contrast, EC showed deactivation of inferior medial PFC. MCI showed deactivation of medial PFC and posterior regions (Fig. 4A, Supplementary Table 2).
Relative to EC, MCI showed attenuation of deactivation in inferior medial PFC (Fig. 4B, Table 3). This was driven by an effect of condition (F(1,42) = 20.910, p < .001) and a condition by diagnosis interaction (F(1,42) = 20.614, p < .001) but no overall effect of diagnosis. EC showed more deactivation in R relative to Rc, while MCI showed no difference between conditions. EC had greater deactivation in R relative to MCI; there were no between group differences in Rc deactivation.
MCI showed more deactivation of medial occipital cortex relative to EC (Fig. 4B, Table 3). This was driven by an interaction between condition and diagnosis (F(1,42) = 7.623, p = .009) but no overall effect of condition or diagnosis. MCI showed deactivation in R relative to Rc, while EC showed a trend towards the opposite pattern (p = .09). There were no differences between groups regarding mean deactivation in R or Rc.
3.3.3. Central executive (RvM)
3.3.3.1. Task positive
Both groups showed showed activation of right sided frontal, parietal, and occipital cortex (Fig. 5A, Supplementary Table 3).
Fig. 5.

A & B Central Executive: Neuroimaging findings significant at p < .05 corrected using Monte Carlo simulation (see Methods). Within group results of task positive and task negative networks reported in 5A. Between group findings reported in 5B. Bar graphs show the data underlying the between group differences. *p < .05.
Relative to EC, MCI showed hypoactivation of right supramarginal gyrus/SPL (Fig. 5B, Table 4). Results showed an effect of condition (F(1.42) = 32.895, p < .001) and an interaction between diagnosis and condition (F(1,42) = 10.685, p = .002). There was an effect of diagnosis (F(1,42) = 5.334, p = .026). EC showed greater activity in R relative to M; there was a trend towards greater activity in R relative to M in MCI (p = .066). EC showed greater activity than MCI in R, but there was no between group difference in M.
Table 4.
Central Executive Task, between group results for the task positive (R > M) and task negative (M > R) contrasts. SPL = superior parietal lobule; STG = superior temporal gyrus; MTG = middle temporal gyrus; ITG = inferior temporal gyurs; SFG = superior frontal gyrus; MFG = middle frontal gyrus; IFG = inferior frontal gyrus; Max = maximum z-statistic within the cluster; x,y,z = voxel coordinates of maximum intensity within the cluster; R = right, L = left; BA = approximate Brodmann's Areas.
| Cluster size | Max | x | y | z | Region | Side | BA | |
|---|---|---|---|---|---|---|---|---|
| Task positive | ||||||||
| EC > MCI | 612 | 3.2 | 19 | 44 | 62 | Supramarginal gyrus, SPL | R | 40,7 |
| Task negative | ||||||||
| EC > MCI | 87 | 2.71 | 28 | 57 | 20 | Fusiform gyrus | R | 20 |
| MCI > EC | 150 | 2.73 | 46 | 20 | 54 | Occipital lobe | R/L | 18,19 |
| 137 | 2.77 | 21 | 50 | 35 | Superior temporal sulcus, posterior |
R | 21,22 | |
| 106 | 3.04 | 10 | 56 | 31 | Superior temporal sulcus, anterior | R | 21,22 | |
| 86 | 2.81 | 77 | 56 | 35 | Superior temporal sulcus | L | 21, 22 | |
| 190 | 3.09 | 51 | 76 | 42 | Corpus callosum | |||
There were no areas of hyperactivation in MCI.
3.3.3.2. Task negative
Both groups showed deactivation of frontal, temporal, and occipital regions (Fig. 5A, Supplementary Table 3).
Relative to EC, MCI showed attenuation of right fusiform deactivation (Fig. 5B, Table 4). There was a marginal effect of condition (F)1,42 = 3.981, p = .053 and an interaction between condition and diagnosis (F(1.42) = 8.648, p = .005). There was an overall effect of diagnosis (F(1,42) = 5.584, p = .023). EC showed lower activity in R relative to M; there were no differences between conditions in MCI. There were no differences between groups in R; MCI showed more deactivation in M relative to R. Examination of the BOLD data shows that EC patients showed positive activity in M. Thus, this difference appeared driven by a lack of recruitment of the region during M in MCI, and not a true deactivation during R.
MCI showed more deactivation of medial posterior occipital lobe, right superior temporal sulcus, and left superior temporal sulcus relative to EC (Fig. 5B, Table 4). This was driven by an effect of condition (F(1,42) = 6.335, p = .016) and an interaction between condition and diagnosis (F(1.42) = 8.945, p = .005). There was no overall effect of diagnosis (n.s). MCI showed more deactivation in R relative to M; EC showed no differences between conditions. The extent of deactivation during R in MCI was greater than that evident in ECs; there were no differences between groups in the M condition.
3.4. Associations between fMRI and clinical data
Correlations were run between the left MFG region showing hyperactivation in Maintenance Working Memory (M > Mc) and clinical outcomes. In MCI, there were no significant correlations between left MFG activity and accuracy or reaction time on the task. Increased activity in this region was associated with Immediate Memory (r = .406, p = .044) in the MCI group. We assessed correlations between clinical outcomes and activity in regions showing increased deactivations in MCI in both the Reasoning (Rc > R) and Central Executive (M > R) contrasts. There were no significant associations in the Reasoning contrast (Rc > R). In the MCI group, activity in the regions that showed increased deactivation in the Central Executive (M > R) were associated with Immediate Memory (r = .399, p = .048), Delayed Memory (r = .415, p = .039), and hippocampal volume (r = .487, p = .016). In sum, increased activity (either higher task positive activity or increased task negative activity) was associated with better cognition in MCI.
3.5. Analyses covarying for age
We repeated the analyses, controlling for age. For the Reasoning task the general pattern of findings was largely unchanged, with two exceptions. For the task positive analyses (R > Rc), MCI now showed hyperactivation of left MFG, an area similar to the region showing hyperactivation in the MATCH task (MCI > EC) in the original analyses. For task negative analyses (Rc > R), MCI showed additional regions of increased deactivation, now including bilateral pre/postcentral gyrus, right STG/MTG, and left lingual gyrus (MCI > EC). Findings were largely unchanged for the Maintenance Working Memory (M > Mc and Mc > M) analyses. For the Central Executive task positive analysis (R > M), regions of hypoactivation in MCI expanded to include right IFG/precentral gyrus (EC > MCI).
3.6. Post-hoc analyses
To determine if medications were driving associations, the MCI group was divided into those on (n = 10) and off (n = 15) dementia medications. MMSE was lower in the on-medication group (off = 28.2, on = 26.00, t(23) = 2.78, p = .011). Independent samples t-test was used to compare the mean fMRI signal from regions that were significantly different in the EC vs. MCI contrasts. This signal was compared between on and off medication MCI groups. There were no differences between on and off medication MCI groups in the average activity in any of the contrasts of interest. There was a trend towards higher activity in the on med group in the regions showing hypoactivity in the Central Executive task positive (R > M) contrast (off = 1.17, on = 8.61, t(23) = 1.83, p = .072).
4. Discussion
We aimed to understand the neural correlates of executive dysfunction in MCI. Executive functioning represents a broad range of cognitive abilities necessary for higher-order thought, and in the present study was operationalized via the framework of Baddeley's working memory model (Baddeley, 2003). During Maintenance Working Memory, MCI showed hypoactivation of right frontal and bilateral parietal regions, coupled with hyperactivation of left PFC compared to EC. MCI also showed attenuation of DMN (i.e. less activation) in medial PFC. During Reasoning, we observed hypoactivation of task positive parietal regions in MCI. In addition, MCI showed attenuation of DMN in medial PFC, but greater deactivation of medial occipital regions. Finally, we examined Reasoning while controlling for Maintenance Working Memory to isolate the Central Executive. In this analysis MCI again showed hypoactivation of parietal regions, coupled with increased deactivation of widespread regions within DMN. Overall these findings suggest that parietal aspects of task positive networks, and medial PFC regions of DMN are disrupted in MCI. MCI employ both hyperactivation of PFC, and increased deactivation of posterior DMN, possibly to compensate for AD pathology. These studies highlight the complex changes to both task positive and negative networks underlying executive functioning in MCI.
4.1. Central executive in MCI
The primary aim of this study was to characterize neural correlates underlying executive dysfunction in MCI, specifically in the context of visuospatial reasoning. We evaluated activity in the R > M contrast to isolate the executive processes of reasoning, over and above maintenance working memory demands (Baddeley, 2003). In both groups, we observed that the Central Executive is associated with right sided regions, including the IPL and inferior frontal gyrus. In MCI, we observed attenuation of right supramarginal gyrus/SPL activity, surrounding the IPS. The IPS has been implicated in the manipulation of information within working memory (Bray et al., 2015) and parietal regions more generally appear involved in visuospatial working memory (Logie, 1989). The IPS has also been implicated in attentional processing, particularly the direction of goal-directed activity (Corbetta and Shulman, 2002; Petersen and Posner, 2012). Thus, deficient executive processing may in part be due to declines in visuospatial attention. While we do not have confirmation of AD pathology in our sample, it is noted that AD pathology is associated with cholinergic dysfunction (Potter, 2015), and the cholinergic system is associated with the successful functioning of the orienting attention network (Davidson and Marrocco, 2000). We also observed changes to the functioning of the DMN that included both increases and decreases to the extent of deactivation. Prior fMRI studies of EF have investigated inhibition, complex attention, and manipulation, pointing to dysfunction of frontoparietal regions during task processing (Alichniewicz et al., 2012; Clément et al., 2013; Kaufmann et al., 2008; Rosano et al., 2005). Here we demonstrate a similar underlying neurobiology during reasoning, and also highlight the extensive alterations to the DMN that underlie aspects of executive dysfunction in MCI.
4.2. Hyperactivation in MCI
In addition to exploring the central executive, we examined the neural correlates of working memory and reasoning more generally. In all tasks we observed hyperactivation: increased activation of task positive networks, or increased deactivation of DMN. Increased activity in aging or disease has been explained by two predominant theories. Dedifferentiation refers to the concept that brain regions stop showing selectivity to stimuli, consequently increasing the amount of brain tissue dedicated to a specific task (Li and Lindenberger, 1999). In contrast, compensation refers to the idea that either new neural networks or increased functioning of task networks are recruited to support cognitive processing when the normal circuits are insufficient (Cabeza and Dennis, 2013). Compensation may be supported when task difficulty is equivalent across groups, BOLD signal increases are observed with higher task demands, and BOLD activity positively correlates with task performance (Cabeza and Dennis, 2013).
During Maintenance Working Memory (M > Mc), MCI showed hyperactivation of left PFC. We observed equivalent task performance between the MCI and EC groups during M and Mc trials. Exploration of the fMRI data showed the group difference in this region was driven by a condition by diagnosis interaction, such that MCI had increased activity during M trials specifically, suggesting activity was driven by higher task demands. However, we did not observe an association between behavioral performance and hyperactivation of left PFC. Thus, although the findings could reflect a compensatory mechanism, it could also be argued that the findings reflect some more general, maladaptive response that is not directly linked to behavior. However, in MCI, those with better memory performance on neuropsychological testing also showed increased hyperactivation. This suggests that the observed hyperactivity is associated with better cognition. While this may not directly satisfy a compensatory interpretation, it is consistent with the hypothesis that the frontal lobe acts as a buffer to promote task processing in the face of aging and disease (Goh and Park, 2009).
We also observed increased deactivation of various regions of the DMN in both the Reasoning (Rc v R) and Central Executive (MvR) contrasts. In other words, regardless of the control comparison used, MCI showed regions (particularly in posterior brain) of increased deactivation relative to EC during R trials. It is less clear if this activity can be considered compensatory. Compared to EC, patients did worse during R trials, which makes interpretation complicated. In the Reasoning contrast (Rc > R), MCI were more likely to deactivate in R, while there was a trend towards the opposite pattern in EC. Thus it is not clear that task demands, per se, drove the between group differences. There were also no associations between this activity and behavioral performance in the MCI group. Regarding the Central Executive (M > R) deactivation, again MCI showed worse behavioral performance on R trials relative to the EC group. Unlike the Rc > R analysis, MCI were more likely to deactivate during R relative to M, while EC showed no difference between conditions. This suggests that greater deactivation in MCI was associated with higher task demands. While there were no associations between this activity and behavioral performance, in MCI activity did show direct correlations with cognition, such that those with better cognitive ability showed the greatest extent of deactivation. Again, while not definitive, this latter point is more consistent with a compensatory interpretation. Assuming that for the tasks used here the DMN is a “nuisance” network (e.g. reflects mind-wondering or other internal processes not related to task processing) increased suppression of this network may be a strategy needed to prioritize and focus task processing. This observation is line with previous work demonstrating that in MCI, high cognitive reserve is correlated with increased deactivations (Bosch et al., 2010).
4.3. Hypoactivation in MCI
Across all task contrasts we observed hypoactivation of posterior brain regions, in particular, the right IPL or IPS. This was observed both when patients were performing the task well (MvMc) and when they were not (RvRc, RvM). The tasks utilized here are highly reliant on the parietal lobe, and given the involvement of parietal regions in MCI (Karas et al., 2008) it is not surprising that hypoactivation was observed. While the finding was not significant in this small sample, we did observe numerically smaller brain volume in posterior regions of the DMN in MCI. Likewise, we observed an attenuation of deactivation of inferior medial PFC in the Reasoning (RvRc) and Maintenance Working Memory (MvMc) contrasts. Rostral medial PFC deactivations appear greatest when there is a need to support working memory representations, such as internal cues or reminders (Landsiedel and Gilbert, 2015), suggesting disruptions to anterior DMN also underlie cognitive symptoms in MCI. The DMN appears vulnerable to amyloid accumulation (Buckner et al., 2008). While we did not confirm amyloid positivity in this sample, patients with MCI have higher rates of amyloid accumulation than cognitively normal adults (Pike et al., 2007). Thus, patterns of hypoactivation occurred in regions both important for the tasks under investigation, and regions vulnerable to disease in MCI.
4.4. Task difficulty in MCI
This analysis enabled multiple examinations of the networks involved in executive processing. We observed hyperactivation of left PFC during Maintenance Working Memory in individuals with MCI, which may be driven by the maintenance requirements of the task, as suggested in prior work in MCI (Bokde et al., 2010). While we observed hyperactivation of left prefrontal cortex during Maintenance Working Memory (M > Mc) in MCI, this did not persist in our Central Executive comparison (R > M). As summarized in the introduction, task difficulty appears related to task positive activation, in that MCI patients tend to show regional hyperactivation for hard versus easy contrasts when behavioral performance is equivalent to the control group (e.g. M > Mc), but hypoactivation when they perform worse (e.g. R > Rc, R > M). Given that MCI patients performed worse on R trials than EC, but there were no differences between groups on M, this may explain why we did not observe prefrontal hyperactivations in R > M but did in M > Mc. To the extent prefrontal hyperactivation does reflect neural compensation, it appears adaptive to the task at hand. Complicating this interpretation, we did observe hyperactivation in this same region in M > Mc in the MCI group when we covaried for age. In contrast, we did observe increased deactivation in DMN in the Central Executive and Reasoning contrasts, despite the R trials being more difficult for MCI. Prior work has also observed increased deactivation during more difficult task processing in MCI (Kochan et al., 2010). Thus these DMN changes may be a less efficient compensatory response than increased utilization of task positive networks. In other words, they may reflect a secondary attempt at compensation, when frontal systems are insufficient.
4.5. Limitations
There are limitations to the present paper. First, patients with MCI included both those on and off dementia medications. In our post-hoc analyses we did not see any differences in activity when split by medication status. Because we recruited primarily from the VA, most of our sample consists of men. Ideally, we would investigate the Central Executive during a task with matched behavioral performance in the MCI group. Our analysis focused on correct trials only, in an attempt to correct for this. We also note that we investigated only one aspect of executive functioning. This is a cross-sectional study, and as such interpretations about how these network changes relate to disease progression are speculative.
The cross-sectional nature of the study also makes it impossible to confirm the underlying pathology of our MCI participants, some of whom may eventually revert back to EC or develop a form of dementia other than AD. We took several measures to increase the likelihood that participants in our study represent early AD rather than another underlying pathology. First, the MCI participants included here were diagnosed based on consensus meeting between two neuropsychologists, with non-amnestic subtypes of MCI excluded from study. Current research suggests that individuals with an amnestic MCI presentation (single or multi-domain) are more likely to develop AD than other MCI subtypes (Ravaglia et al., 2005; Yaffe et al., 2006). Additionally, MRI scans were reviewed and participants were excluded if they had evidence of significant cerebrovascular disease thus reducing the likelihood of an underlying vascular, rather than AD, pathology. We did not include biological biomarkers of AD (e.g., amyloid imaging) in our diagnostic procedures. Recent reviews cite the utility of neuropsychological measures in detecting early AD related changes with high sensitivity and specificity, thus speaking to their potential role as AD biomarkers (Han et al., 2017; Weissberger et al., 2017) and supporting our use of neuropsychological test review as a diagnostic procedure in this study.
The Central Executive contrast compares R trials to M trials. When assessing between group differences in deactivations, we have interpreted our findings with the M trials as our reference control. However it is also possible to consider this analysis from the opposite contrast- that we are examining brain regions more active in M trials than R. This may in part explain why we see “deactivation” of occipital and fusiform regions in this contrast (M > R; Fig. 5A). This is not true deactivation, but rather a reflection of the fact that M trials are associated with more activity in these regions, likely due to the greater visual complexity of the task stimuli. The bar graphs showing the signal underlying the between group differences demonstrates that the region showing less activity in the MCI group is actually a region that the MCI group fails to activate during M trials, consistent with this perspective. In contrast, those regions in which MCI showed increased deactivations (Fig. 5B) relative to EC appear to be driven by true greater extent of deactivation in R trials in the MCI group.
4.6. Conclusions
Putting these findings together, this study highlights differences in both task positive and task negative networks during executive functioning in MCI. Across comparisons, patients showed hypoactivation of parietal lobe activity, and attenuation of medial PFC deactivation. In addition to being relevant to the tasks at hand, both regions are implicated in AD pathology (Braak and Braak, 1995; Klunk et al., 2004). During the Maintenance Working Memory task, a task that was behaviorally intact for the MCI group, we observed hyperactivation of the left PFC. In our Central Executive comparison, in which MCI performance was behaviorally worse than EC performance, we observed increased deactivation of posterior regions of the DMN. These latter two findings may be compensatory, given that those patients with the largest functional activity differences were those that showed either better clinical presentation or larger hippocampal volume. Thus, executive functioning is characterized by a break down and subsequent attenuation of normal task positive and negative networks, coupled with the recruitment of other regions within these networks potentially to compensate for this break down.
The following are the supplementary data related to this article.
Maintenance Working Memory within group findings.
Reasoning within group findings.
Central Executive within group findings.
Funding
This work was supported by the VA [Career Development Award and Merit Review CX-001128 to R. Melrose] and UCLA [Semel Scholar Award to R. Melrose].
Declarations of interest
None.
References
- Albert M.S., Dekosky S.T., Dickson D., Dubois B., Feldman H.H., Fox N.C., Gamst A., Holtzman D.M., Jagust W.J., Petersen R.C., Snyder P.J., Carrillo M.C., Thies B., Phelps C.H. The diagnosis of mild cognitive impairment due to Alzheimer's disease: recommendations from the National Institute on Aging-Alzheimer's Association workgroups on diagnostic guidelines for Alzheimer's disease. Alzheimers Dement. 2011;7(3):270–279. doi: 10.1016/j.jalz.2011.03.008. [DOI] [PMC free article] [PubMed] [Google Scholar]
- Alichniewicz K., Brunner F., Klünemann H., Greenlee M. Structural and functional neural correlates of visuospatial information processing in normal aging and amnestic mild cognitive impairment. Neurobiol. Aging. 2012;33(12):2782–2797. doi: 10.1016/j.neurobiolaging.2012.02.010. [DOI] [PubMed] [Google Scholar]
- Baddeley A.D. Working memory: looking back and looking forward. Nat. Rev. Neurosci. 2003;4(10):829–839. doi: 10.1038/nrn1201. [DOI] [PubMed] [Google Scholar]
- Baddeley A.D., Hitch G.J. In: Recent Advances in Learning and Motivation. Bower G.A., editor. Academic; New York: 1974. pp. 47–89. [Google Scholar]
- Beckmann C.F., Jenkinson M., Smith S.M. General multilevel linear modeling for group analysis in FMRI. NeuroImage. 2003;20(2):1052–1063. doi: 10.1016/S1053-8119(03)00435-X. [DOI] [PubMed] [Google Scholar]
- Benedict R.H.B. Psychological Assessment Resources, Inc; Lutz, FL: 1997. Brief Visuospatial Memory Test-Revised. [Google Scholar]
- Berger C., Erbe A.K., Ehlers I., Marx I., Hauenstein K., Teipel S. 2014. Effects of Task-Irrelevant Emotional Stimuli on Working Memory Processes in Mild Cognitive Impairment. [DOI] [PubMed] [Google Scholar]
- Bokde A.L., Karmann M., Born C., Teipel S.J., Omerovic M., Ewers M., Frodl T., Meisenzahl E., Reiser M., Moller H.J., Hampel H. Altered brain activation during a verbal working memory task in subjects with amnestic mild cognitive impairment. J. Alzheimers Dis. 2010;21(1):103–118. doi: 10.3233/JAD-2010-091054. [DOI] [PubMed] [Google Scholar]
- Bosch B., Bartres-Faz D., Rami L., Arenaza-Urquijo E.M., Fernandez-Espejo D., Junque C., Sole-Padulles C., Sanchez-Valle R., Bargallo N., Falcon C., Molinuevo J.L. Cognitive reserve modulates task-induced activations and deactivations in healthy elders, amnestic mild cognitive impairment and mild Alzheimer's disease. Cortex. 2010;46(4):451–461. doi: 10.1016/j.cortex.2009.05.006. [DOI] [PubMed] [Google Scholar]
- Braak H., Braak E. Staging of Alzheimer's disease-related neurofibrillary changes. Neurobiol. Aging. 1995;16(3):271–278. doi: 10.1016/0197-4580(95)00021-6. (discussion 278-284) [DOI] [PubMed] [Google Scholar]
- Bray S., Almas R., Arnold A.E., Iaria G., Macqueen G. Intraparietal sulcus activity and functional connectivity supporting spatial working memory manipulation. Cereb. Cortex. 2015;25(5):1252–1264. doi: 10.1093/cercor/bht320. [DOI] [PubMed] [Google Scholar]
- Buckner R.L., Andrews-Hanna J.R., Schacter D.L. The brain's default network: anatomy, function, and relevance to disease. Ann. N. Y. Acad. Sci. 2008;1124:1–38. doi: 10.1196/annals.1440.011. [DOI] [PubMed] [Google Scholar]
- Cabeza R., Dennis N.A. 2nd ed. Oxford University Press; New York: 2013. Frontal Lobes and Aging: Deterioration and Compensation. [Google Scholar]
- Carmichael O., McLaren D.G., Tommet D., Mungas D., Jones R.N., for the Alzheimer's Disease Neuroimaging, I Coevolution of brain structures in amnestic mild cognitive impairment. NeuroImage. 2013;66C:449–456. doi: 10.1016/j.neuroimage.2012.10.029. [DOI] [PMC free article] [PubMed] [Google Scholar]
- Celone K.A., Calhoun V.D., Dickerson B.C., Atri A., Chua E.F., Miller S.L., Depeau K., Rentz D.M., Selkoe D.J., Blacker D., Albert M.S., Sperling R.A. Alterations in memory networks in mild cognitive impairment and Alzheimer's disease: an independent component analysis. J. Neurosci. 2006;26(40):10222–10231. doi: 10.1523/JNEUROSCI.2250-06.2006. [DOI] [PMC free article] [PubMed] [Google Scholar]
- Christoff K., Prabhakaran V., Dorfman J., Zhao Z., Kroger J.K., Holyoak K.J., Gabrieli J.D. Rostrolateral prefrontal cortex involvement in relational integration during reasoning. NeuroImage. 2001;14(5):1136–1149. doi: 10.1006/nimg.2001.0922. [DOI] [PubMed] [Google Scholar]
- Clément F., Gauthier S., Belleville S. Executive functions in mild cognitive impairment: emergence and breakdown of neural plasticity. Cortex. 2013;49(5):1268–1279. doi: 10.1016/j.cortex.2012.06.004. [DOI] [PubMed] [Google Scholar]
- Corbetta M., Shulman G.L. Control of goal-directed and stimulus-driven attention in the brain. Nat. Rev. Neurosci. 2002;3(3):201–215. doi: 10.1038/nrn755. [DOI] [PubMed] [Google Scholar]
- Davidson M.C., Marrocco R.T. Local infusion of scopolamine into intraparietal cortex slows covert orienting in rhesus monkeys. J. Neurophysiol. 2000;83(3):1536–1549. doi: 10.1152/jn.2000.83.3.1536. [DOI] [PubMed] [Google Scholar]
- Delis D.C., Kramer J.H., Kaplan E., Ober B.A. Second Edition. NCS Pearson, Inc; Bloomington, MN: 2000. California Verbal Learning Test- Second Edition Adult Version. [Google Scholar]
- Dickerson B.C., Sperling R.A., Hyman B.T., Albert M.S., Blacker D. Clinical prediction of Alzheimer disease dementia across the spectrum of mild cognitive impairment. Arch. Gen. Psychiatry. 2007;64(12):1443–1450. doi: 10.1001/archpsyc.64.12.1443. [DOI] [PMC free article] [PubMed] [Google Scholar]
- Gainotti G., Quaranta D., Vita M.G., Marra C. Neuropsychological predictors of conversion from mild cognitive impairment to Alzheimer's disease. J. Alzheimers Dis. 2014;38(3):481–495. doi: 10.3233/JAD-130881. [DOI] [PubMed] [Google Scholar]
- Goh J.O., Park D.C. Neuroplasticity and cognitive aging: the scaffolding theory of aging and cognition. Restor. Neurol. Neurosci. 2009;27(5):391–403. doi: 10.3233/RNN-2009-0493. [DOI] [PMC free article] [PubMed] [Google Scholar]
- Golden C.J., Freshwater S.M. Stoelting; Chicago: 2002. Stroop color and word test: A manual for clinical and experimental uses. [Google Scholar]
- Han S.D., Nguyen C.P., Stricker N.H., Nation D.A. Correction to: detectable neuropsychological differences in early preclinical Alzheimer's disease: a meta-analysis. Neuropsychol. Rev. 2017;27(4):326–327. doi: 10.1007/s11065-017-9366-0. [DOI] [PubMed] [Google Scholar]
- Ivnik R.J., Malec J.F., Smith G.E., Tangalos E.G., Kokmen E., Petersen R.C., Kurland L.T. Mayo's older americans normative studies: WMS-R norms for ages 56 to 94. Clin. Neuropsychol. 1992;6:49–82. (sup001) [Google Scholar]
- Jenkinson M., Smith S. A global optimisation method for robust affine registration of brain images. Med. Image Anal. 2001;5(2):143–156. doi: 10.1016/s1361-8415(01)00036-6. [DOI] [PubMed] [Google Scholar]
- Karas G., Sluimer J., Goekoop R., van der Flier W., Rombouts S.A., Vrenken H., Scheltens P., Fox N., Barkhof F. Amnestic mild cognitive impairment: structural MR imaging findings predictive of conversion to Alzheimer disease. AJNR Am. J. Neuroradiol. 2008;29(5):944–949. doi: 10.3174/ajnr.A0949. [DOI] [PMC free article] [PubMed] [Google Scholar]
- Kaufmann L., Ischebeck A., Weiss E., Koppelstaetter F., Siedentopf C., Vogel S.E., Gotwald T., Marksteiner J., Wood G. An fMRI study of the numerical Stroop task in individuals with and without minimal cognitive impairment. Cortex. 2008;44(9):1248–1255. doi: 10.1016/j.cortex.2007.11.009. [DOI] [PubMed] [Google Scholar]
- Klunk W.E., Engler H., Nordberg A., Wang Y., Blomqvist G., Holt D.P., Bergstrom M., Savitcheva I., Huang G.F., Estrada S., Ausen B., Debnath M.L., Barletta J., Price J.C., Sandell J., Lopresti B.J., Wall A., Koivisto P., Antoni G., Mathis C.A., Langstrom B. Imaging brain amyloid in Alzheimer's disease with Pittsburgh Compound-B. Ann. Neurol. 2004;55(3):306–319. doi: 10.1002/ana.20009. [DOI] [PubMed] [Google Scholar]
- Kochan N.A., Breakspear M., Slavin M.J., Valenzuela M., Mccraw S., Brodaty H., Sachdev P.S. Functional alterations in brain activation and deactivation in mild cognitive impairment in response to a graded working memory challenge. Dement. Geriatr. Cogn. Disord. 2010;30(6):553–568. doi: 10.1159/000322112. [DOI] [PubMed] [Google Scholar]
- Kroger J.K., Sabb F.W., Fales C.L., Bookheimer S.Y., Cohen M.S., Holyoak K.J. Recruitment of anterior dorsolateral prefrontal cortex in human reasoning: a parametric study of relational complexity. Cereb. Cortex. 2002;12(5):477–485. doi: 10.1093/cercor/12.5.477. [DOI] [PubMed] [Google Scholar]
- Landsiedel J., Gilbert S.J. Creating external reminders for delayed intentions: dissociable influence on “task-positive” and “task-negative” brain networks. NeuroImage. 2015;104(Supplement C):231–240. doi: 10.1016/j.neuroimage.2014.10.021. [DOI] [PubMed] [Google Scholar]
- Lezak M.D. Oxford University Press; New York: 1995. Neuropsychological Assessment. [Google Scholar]
- Li S.-C., Lindenberger U. 1999. Cross-Level Unification: A Computational Exploration of the Link between Deterioration of Neurotransmitter Systems and Dedifferentiation of Cognitive Abilities in Old Age. [Google Scholar]
- Logie R.H. Characteristics of visual short-term memory. Eur. J. Cogn. Psychol. 1989;1(4):275–284. [Google Scholar]
- Lou W., Shi L., Wang D., Tam C.W., Chu W.C., Mok V.C., Cheng S.T., Lam L.C. Decreased activity with increased background network efficiency in amnestic MCI during a visuospatial working memory task. Hum. Brain Mapp. 2015;36(9):3387–3403. doi: 10.1002/hbm.22851. [DOI] [PMC free article] [PubMed] [Google Scholar]
- Melrose R.J., Poulin R.M., Stern C.E. An fMRI investigation of the role of the basal ganglia in reasoning. Brain Res. 2007;1142:146–158. doi: 10.1016/j.brainres.2007.01.060. [DOI] [PubMed] [Google Scholar]
- Meyers J., Meyers K. Psychological Assessment Resources; Odessa, FL: 1995. The Meyers Scoring System for the Rey Complex Figure and the Recognition Trial: Professional Manual. [Google Scholar]
- Migo E.M., Mitterschiffthaler M., O'Daly O., Dawson G.R., Dourish C.T., Craig K.J., Simmons A., Wilcock G.K., McCulloch E., Jackson S.H., Kopelman M.D., Williams S.C., Morris R.G. Alterations in working memory networks in amnestic mild cognitive impairment. Neuropsychol. Dev. Cogn. B Aging Neuropsychol. Cogn. 2015;22(1):106–127. doi: 10.1080/13825585.2014.894958. [DOI] [PubMed] [Google Scholar]
- Miyake A., Friedman N.P., Emerson M.J., Witzki A.H., Howerter A., Wager T.D. The unity and diversity of executive functions and their contributions to complex "Frontal Lobe" tasks: a latent variable analysis. Cogn. Psychol. 2000;41(1):49–100. doi: 10.1006/cogp.1999.0734. [DOI] [PubMed] [Google Scholar]
- Petersen S.E., Posner M.I. The attention system of the human brain: 20 years after. Annu. Rev. Neurosci. 2012;35:73–89. doi: 10.1146/annurev-neuro-062111-150525. [DOI] [PMC free article] [PubMed] [Google Scholar]
- Pike K., Savage G., Villemagne V.L., Ng S., Moss S., Maruff P., Mathis C., Klunk W.E., Masters C., Rowe C.C. Beta-amyloid imaging and memory in non-demented individuals: evidence for preclinical Alzheimer's disease. Brain. 2007;130(Pt 11):2837–2844. doi: 10.1093/brain/awm238. [DOI] [PubMed] [Google Scholar]
- Potter P.E. Current and investigational drugs for treatment of Alzheimer's disease. FCDR-Alzheimer Disord. 2015;4 [Google Scholar]
- Prabhakaran V., Smith J.A., Desmond J.E., Glover G.H., Gabrieli J.D. Neural substrates of fluid reasoning: an fMRI study of neocortical activation during performance of the Raven's Progressive Matrices Test. Cogn. Psychol. 1997;33(1):43–63. doi: 10.1006/cogp.1997.0659. [DOI] [PubMed] [Google Scholar]
- Ravaglia G., Forti P., Maioli F., Martelli M., Servadei L., Brunetti N., Pantieri G., Mariani E. Conversion of mild cognitive impairment to dementia: predictive role of mild cognitive impairment subtypes and vascular risk factors. Dement. Geriatr. Cogn. Disord. 2005;21(1):51–58. doi: 10.1159/000089515. [DOI] [PubMed] [Google Scholar]
- Rombouts S.A., Barkhof F., Goekoop R., Stam C.J., Scheltens P. Altered resting state networks in mild cognitive impairment and mild Alzheimer's disease: an fMRI study. Hum. Brain Mapp. 2005;26(4):231–239. doi: 10.1002/hbm.20160. [DOI] [PMC free article] [PubMed] [Google Scholar]
- Rosano C., Aizenstein H.J., Cochran J.L., Saxton J.A., De Kosky S.T., Newman A.B., Kuller L.H., Lopez O.L., Carter C.S. Event-related functional magnetic resonance imaging investigation of executive control in very old individuals with mild cognitive impairment. Biol. Psychiatry. 2005;57(7):761–767. doi: 10.1016/j.biopsych.2004.12.031. [DOI] [PMC free article] [PubMed] [Google Scholar]
- Slotnick S.D., Moo L.R., Segal J.B., Hart J., Jr. Distinct prefrontal cortex activity associated with item memory and source memory for visual shapes. Brain Res. Cogn. Brain Res. 2003;17(1):75–82. doi: 10.1016/s0926-6410(03)00082-x. [DOI] [PubMed] [Google Scholar]
- Smith S.M. Fast robust automated brain extraction. Hum. Brain Mapp. 2002;17(3):143–155. doi: 10.1002/hbm.10062. [DOI] [PMC free article] [PubMed] [Google Scholar]
- Tabert M.H., Manly J.J., Liu X., Pelton G.H., Rosenblum S., Jacobs M., Zamora D., Goodkind M., Bell K., Stern Y., Devanand D.P. Neuropsychological prediction of conversion to Alzheimer disease in patients with mild cognitive impairment. Arch. Gen. Psychiatry. 2006;63(8):916–924. doi: 10.1001/archpsyc.63.8.916. [DOI] [PubMed] [Google Scholar]
- Tombaugh T.N. Trail Making Test a and B: normative data stratified by age and education. Arch. Clin. Neuropsychol. 2004;19(2):203–214. doi: 10.1016/S0887-6177(03)00039-8. [DOI] [PubMed] [Google Scholar]
- Tombaugh T.N., Kozak J., Rees L. Normative data stratified by age and education for two measures of verbal fluency: FAS and animal naming. Arch. Clin. Neuropsychol. 1999;14(2):167–177. [PubMed] [Google Scholar]
- Van Dam N.T., Sano M., Mitsis E.M., Grossman H.T., Gu X., Park Y., Hof P.R., Fan J. Functional neural correlates of attentional deficits in amnestic mild cognitive impairment. PLoS One. 2013;8(1) doi: 10.1371/journal.pone.0054035. [DOI] [PMC free article] [PubMed] [Google Scholar]
- Weissberger G.H., Strong J.V., Stefanidis K.B., Summers M.J., Bondi M.W., Stricker N.H. Diagnostic accuracy of memory measures in Alzheimer's dementia and mild cognitive impairment: a systematic review and meta-analysis. Neuropsychol. Rev. 2017;27(4):354–388. doi: 10.1007/s11065-017-9360-6. [DOI] [PMC free article] [PubMed] [Google Scholar]
- Wermke M., Sorg C., Wohlschlager A.M., Drzezga A. A new integrative model of cerebral activation, deactivation and default mode function in Alzheimer's disease. Eur. J. Nucl. Med. Mol. Imaging. 2008;35(Suppl. 1):S12–S24. doi: 10.1007/s00259-007-0698-5. [DOI] [PubMed] [Google Scholar]
- Winblad B., Palmer K., Kivipelto M., Jelic V., Fratiglioni L., Wahlund L.O., Nordberg A., Bäckman L., Albert M., Almkvist O., Arai H., Basun H., Blennow K., De Leon M., DeCarli C., Erkinjuntti T., Giacobini E., Graff C., Hardy J., Jack C., Jorm A., Ritchie K., Van Duijn C., Visser P., Petersen R.C. Mild cognitive impairment – beyond controversies, towards a consensus: report of the International Working Group on Mild Cognitive Impairment. J. Intern. Med. 2004;256(3):240–246. doi: 10.1111/j.1365-2796.2004.01380.x. [DOI] [PubMed] [Google Scholar]
- Woolrich M.W., Jbabdi S., Patenaude B., Chappell M., Makni S., Behrens T., Beckmann C., Jenkinson M., Smith S.M. Bayesian analysis of neuroimaging data in FSL. NeuroImage. 2009;45(1 Suppl):S173–S186. doi: 10.1016/j.neuroimage.2008.10.055. [DOI] [PubMed] [Google Scholar]
- Yaffe K., Petersen R.C., Lindquist K., Kramer J., Miller B. Subtype of mild cognitive impairment and progression to dementia and death. Dement. Geriatr. Cogn. Disord. 2006;22(4):312–319. doi: 10.1159/000095427. [DOI] [PubMed] [Google Scholar]
- Yetkin F.Z., Rosenberg R.N., Weiner M.F., Purdy P.D., Cullum C.M. FMRI of working memory in patients with mild cognitive impairment and probable Alzheimer's disease. Eur. Radiol. 2006;16(1):193–206. doi: 10.1007/s00330-005-2794-x. [DOI] [PubMed] [Google Scholar]
Associated Data
This section collects any data citations, data availability statements, or supplementary materials included in this article.
Supplementary Materials
Maintenance Working Memory within group findings.
Reasoning within group findings.
Central Executive within group findings.