F1000Research logoLink to F1000Research
. 2017 Jun 9;6:569. Originally published 2017 Apr 26. [Version 2] doi: 10.12688/f1000research.11438.2

The dynamic upper limit of human lifespan

Saul Newman 1, Simon Easteal 1,a
PMCID: PMC6039923  PMID: 30026910

Version Changes

Revised. Amendments from Version 1

We have conducted minor changes to the phrasing of the manuscript regarding projections of MSA and the expected increase in MRAD, and corrected the spelling of "Calment". We have also added Supplementary Figure S1 and Supplementary Figure S2 with reference in the text, initially embedded in the supplementary material code, to address the concerns and comments of reviewers.

Abstract

We respond to claims by Dong et al. that human lifespan is limited below 125 years. Using the log-linear increase in mortality rates with age to predict the upper limits of human survival we find, in contrast to Dong et al., that the limit to human lifespan is historically flexible and increasing. This discrepancy can be explained by Dong et al.’s use of data with variable sample sizes, age-biased rounding errors, and log(0) instead of log(1) values in linear regressions. Addressing these issues eliminates the proposed 125-year upper limit to human lifespan.

Keywords: lifespan, human lifespan, contradictory findings, ageing, life history, refutation


Recent findings by Dong et al. 1 suggested fixed upper limits to the human life span. Using the same data, we replicated their analysis to obtain an entirely different result: the upper limit of human life is rapidly increasing.

Dong et al. conclude that the maximum reported age at death (MRAD) is limited to 125 years in humans 1 and that lifespan increases above age 110 are highly unlikely, due to the reduced rate of increase in life expectancy at advanced ages.

We repeated Dong et al.’s 1 analysis using identical data (SI). Replicating these findings requires the inclusion of rounding errors, treating zero-rounded values as log(1) and the incorrect pooling of populations.

The Human Mortality Database ( HMD) data provide both the age-specific probability of survival ( q x) and the survival rates of a hypothetical cohort of 100,000 individuals ( l x). However, l x survival rates are rounded off to the nearest integer value.

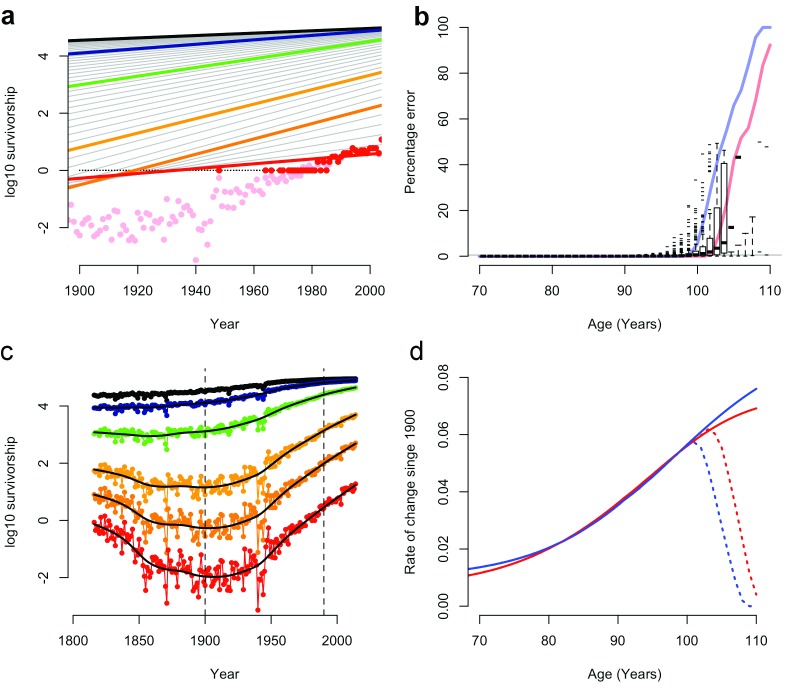
The magnitude and frequency of l x rounding errors increases as the probability of survival approaches 1 in 100,000. These rounding errors mask variation in survival rates at advanced ages: over half of l x survival data are rounded to zero above age 90 ( Figure 1b).

Figure 1. Rate of change in late-life survival for the French population 1816-2014.

Figure 1.

( a) Figure modified after Dong et al. Figure 1b, showing rounded survival data (red points), rounded survival data with log(0)=log(1) (black points), the resulting linear regression in Dong et al. (solid red line) and observed survival data (pink points). ( b) Rounding errors in survival data (box-whisker plots; 95% CI) and the proportion of survival data rounded to zero in males (blue line) and females (red line). ( c) Survival data from ( a) with rounding errors removed, showing variation outside the 1900-1990 period (vertical dotted lines). ( d) The rate of change in late-life mortality since 1900 with (dotted lines) and without (solid lines) rounding errors (after Dong et al. Figure 1c).

Dong et al. appear to have used these rounded-off survival data in their models 1 and incorrectly treated log(0) values as log(1) in log-linear regressions ( Figure 1a–d; SI).

These errors have considerable impact. Re-calculating cohort survival from raw data or excluding zero-rounded figures eliminates the proposed decline in old-age survival gains ( Figure 1d; SI).

Likewise, recalculating these data removed their proposed limits to the age of greatest survival gain (SI), which in 15% of cases were the result of the artificial 110-year age limit placed on HMD data 2.

We also found that variation in the probability of death was masked by date censoring 1. Major non-linear shifts in old-age survival occur outside the 1900–1990 period used by Dong et al. ( Figure 1c). Why these data were excluded from this regression, but included elsewhere, is unclear.

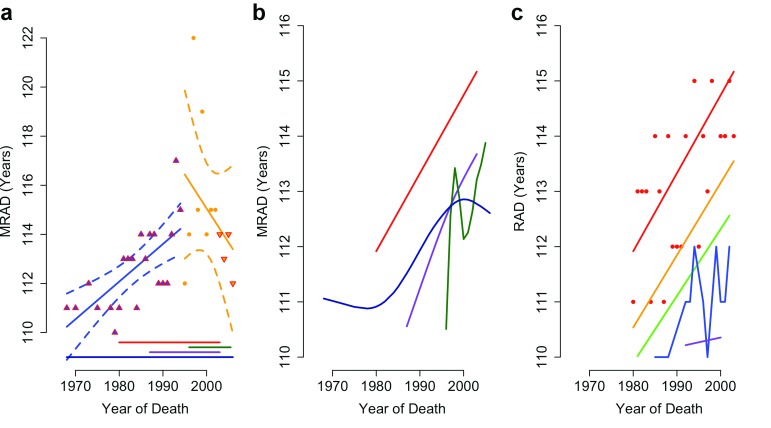
Evidence based on observed survival above age 110 appears to support a late-life deceleration in survival gains 1. For the period 1960–2005 Dong et al. present data 1 from 4 of the 15 countries in the International Database on Longevity 3 ( IDL). In their pooled sample of these countries, there is a non-significant (p=0.3) reduction in MRAD between 1995 and 2006 ( Figure 2a).

Figure 2. Maximum reported age at death of supercentenarians.

Figure 2.

( a) Reproduction of Dong et al. Figure 2a, including 95% CI for increasing (p<0.0001) and falling (p=0.3) maximum recorded age at death (MRAD), showing data biased by the addition and removal (up and down arrows) of populations. ( b) Locally weighted smoothed splines of MRAD in Japan (green), the USA (red), the UK (dark blue) and France (purple). ( c) Locally weighted trends of MRAD in the USA across the oldest 5 reported ages at death (red, orange, green, blue and purple lines show rank 1–5 respectively).

The declining MRAD reported by Dong et al. 1 arises from the use of falling sample sizes. According to the Gerontology Research Group ( GRG), 62% of validated supercentenarians alive in 2007 resided in France and the USA. However, these countries are not surveyed 3 by the IDL after 2003 ( Figure 2a). The proposed post-1995 decline in MRAD results from this dramatic fall in sample size.

Viewed individually, all four countries have an upward trend in the mean reported age at death (RAD; Figure 2b) of supercentenarians (SI) and the top 5 ranked RADs ( Figure 2c). All four countries achieved record lifespans since 1995, as did 80% of the countries in the IDL. Without the pooling of IDL data used by Dong et al. there is no evidence for a plateau in late-life survival gains.

We attempted to reproduce Dong et al.’s supporting analysis of GRG records. The text and Extended Data Figure 6 of Dong et al. do not match annual MRAD records from 1972 as stated 1. However, they do match deaths of the world’s oldest person titleholders from 1955 (GRG Table C, Revision 9) with all deaths in May and June removed (SI).

Actual MRAD data from the GRG support a significant decline in the top-ranked age at death since 1995 (r = -0.47; p = 0.03, MSE = 3.2). However, this trend is not significant if only Jeanne Calment is removed (p = 0.9). Linear models fit to lower-ranked RADs have an order of magnitude better fit, and all indicate an increase in maximum lifespan since 1995 ( Supplementary Figure S1; N= 64; SI).

Collectively, these data indicate an ongoing rebound of upper lifespan limits since 1950, with a progressive increase in observed upper limit of human life. To estimate theoretical limits, we developed a simple approximation of the upper limit of human life.

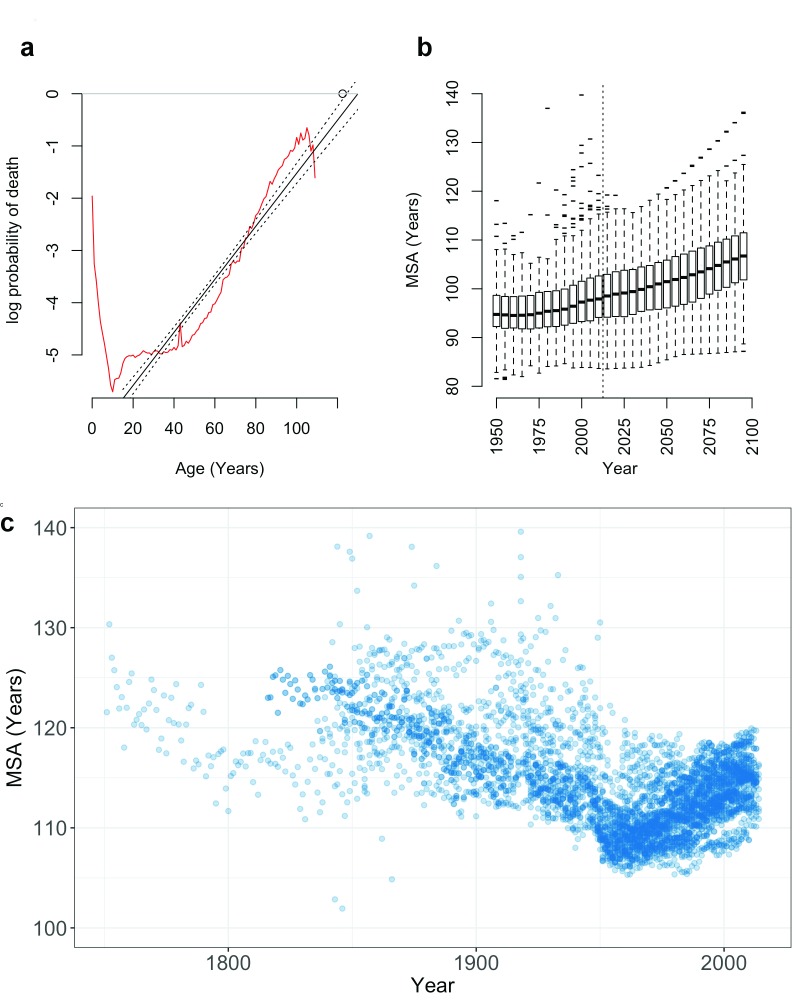
Mortality rates double with age in human populations ( Figure 3a and b). Log-linear models fit to this rate-increase closely approximate the observed age-specific probability of death 4. These models also provide a simple method of predicting upper limits to human life span that is independent of population size.

Figure 3. Observed and projected variation in the maximum survivable age (MSA).

Figure 3.

( a) In humans, the probability of death q at age x ( q x; red line) increases at an approximately log-linear rate with age (black lines; 95% CI), shown here for the birth cohort of Jeanne Calment (d.122.5 years; circle). Projection of this log-linear increase to log( q) = 0 provides the MSA, the upper limit of human survival, shown here for ( b) observed and projected global populations 5 and ( c) 40 historic HMD populations 1751–2014.

We fit log-linear models to age-specific mortality rates from the HMD data used by Dong et al. 1, and used these models to predict the age at which the probability of death intercepts one. This maximum survivable age (MSA) provides a simple, conservative estimate of the upper limit of human life ( Figure 3c).

Log-linear models closely approximate the observed probability of death in HMD populations for both period and cohort life tables (median R 2 = 0.99; 4501 population-years). The MSA limit is compatible with observed ages at death in the GRG database with 330 out of 331 supercentenarians approaching, but not exceeding, their predicted lifespan limit ( Supplementary Figure S2; SI). These models predict an MSA exceeding 125 years within observed historic periods ( Figure 3b and c; SI).

Furthermore, period HMD data indicate that MSA is steadily increasing from a historic low c.1956 ( Figure 3b and c), tracking the increasing MRAD during the same period. The United Nations 5 global mortality data from 194 nations support this trend, with projected population data from the UN predicting a gradual rise in MRAD and MSA through the year 2100 ( Figure 3b).

This analysis provides an estimate of human lifespan limits that is conservatively low. Log-linear mortality models assume no late-life deceleration in mortality rates 6, which, if present, would increase the upper limits of human lifespan 7. In addition, these models are fit to population rates and cannot provide an estimate of individual variation in the rate of mortality acceleration.

Given historical flexibility in lifespan limits and the possibility of late-life mortality deceleration in humans 8, these models should, however, be treated with caution.

A claim might be made for a general, higher 130-year bound to the human lifespan. However, an even higher limit is possible and should not be ruled out simply because it exceeds observed historical limits.

Methods

Life table data were downloaded from the United Nations 5 (UN) and the Human Mortality Database (HMD) and lifespan records from the International Database on Longevity (IDL) and the Gerontology Research Group (GRG).

Least squared linear models were fit to life table data on the log-transformed age-specific probability of death ( q x), and projected to q x=1 to predict the maximum survivable age in each population ( Figure 1b and c; SI). Maximum lifespan within GRG and IDL data was annually aggregated and fit by locally weighted smoothed splines 9 ( Figure 3b and c).

We reproduced the analysis of Dong et al. in R version 10 3.2.1 (SI), using the code in Supplementary File 1.

An earlier version of this article can be found on bioRxiv (doi: 10.1101/124800).

Data availability

The authors declare that all data are available within the paper and its supplementary material.

Funding Statement

The author(s) declared that no grants were involved in supporting this work.

[version 2; referees: 1 approved

Supplementary material

Supplementary File 1: Supplementary information guide. The supplementary information supplied here constitutes two sections of integrated code in the R statistical language:

  • 1.

    R code required to calculate the maximum survivable age or MSA from both public data and the human mortality data used by Dong et al., and required to reproduce our findings in full.

  • 2.

    R code required to reproduce Dong et al. 1 with original errors, often including several error-corrected or partially corrected versions.

Both sections are wrapped in the same script, and require several package dependencies and datasets outlined in the annotated code.

Supplementary Figure S1. Trends across ranked supercentenarian recorded ages at death from the GRG.

Supplementary Figure S2. Relationship between the maximum reported age at death and the theoretical maximum survivable age. Of 331 GRG supercentenarians born into populations with a known lifespan limit, only Jeanne Calment exceeded the theoretical gender-pooled lifespan limit (diagonal line). However, Jeanne Calment did not exceed the theoretical limit of her female cohort (see Figure 3a).

References

  • 1. Dong X, Milholland B, Vijg J: Evidence for a limit to human lifespan. Nature. 2016;538(7624):257–259. 10.1038/nature19793 [DOI] [PubMed] [Google Scholar]
  • 2. Wilmoth JR, Andreev K, Jdanov D, et al. : Methods Protocol for the Human Mortality Database.Version 5.0. 83.2007. Reference Source [Google Scholar]
  • 3. Maier H, Gampe J, Jeune B, et al. : Supercentenarians. Demogr Res Monogr. 2010;7 10.1007/978-3-642-11520-2 [DOI] [Google Scholar]
  • 4. Finch CE: Variations in senescence and longevity include the possibility of negligible senescence. J Gerontol A Biol Sci Med Sci. 1998;53(4):B235–9. 10.1093/gerona/53A.4.B235 [DOI] [PubMed] [Google Scholar]
  • 5. United Nations: World Population Prospects: The 2015 Revision. United Nations Econ Soc Aff. 2015;XXXIII:1–66. Reference Source [Google Scholar]
  • 6. Rose MR, Drapeau MD, Yazdi PG, et al. : Evolution of late-life mortality in Drosophila melanogaster. Evolution. 2002;56(10):1982–1991. 10.1111/j.0014-3820.2002.tb00124.x [DOI] [PubMed] [Google Scholar]
  • 7. Thatcher AR: The long-term pattern of adult mortality and the highest attained age. J R Stat Soc Ser A Stat Soc. 1999;162(Pt 1):5–43. 10.1111/1467-985X.00119 [DOI] [PubMed] [Google Scholar]
  • 8. Kannisto V, Lauritsen J, Thatcher AR, et al. : Reductions in Mortality at Advanced Ages: Several Decades of Evidence from 27 Countries. Popul Dev Rev. 1994;20(4):793–810. 10.2307/2137662 [DOI] [Google Scholar]
  • 9. Cleveland WS: LOWESS: A program for smoothing scatterplots by robust locally weighted regression. Am Stat. 1981;35(1):54 10.2307/2683591 [DOI] [Google Scholar]
  • 10. R Core Development Team: . R: A language and environment for statistical computing. R Foundation for Statistical Computing. Vienna, Austria. . 2012 Reference Source [Google Scholar]
F1000Res. 2018 Jul 10. doi: 10.5256/f1000research.12820.r30810

Referee response for version 2

James Vaupel 1, José Manuel Aburto 1

Newman and Easteal 1 challenge the findings of Dong et al 2on the evidence of a limit for human lifespan. They highlight rounding errors and inappropriate selection of data. These errors have been documented in a series of communications to Nature 3 - 6 and in a recent article 7 questioning Dong et al’s results. Newman and Easteal provide code to reproduce their results, which is highly valuable.

Newman and Easteal state that “we fit log-linear models to age-specific mortality rates”, which, called the Gompertz model, is common practice in demography for some ages (usually between 30 and 90). However, the authors do not fit a Gompertz model to the age-specific mortality rates (denoted m x by demographers). Instead they fit log-linear models to the age-specific probabilities of death (which demographers denote by q x). They do so to estimate the Maximum Survivable Age (MSA), as can be seen from lines 950-989 of the provided code.

There is a fundamental problem with this approach. A linear model fit to the log probabilities predicts probabilities exceeding one at high ages. To avoid this fallacy, Newman and Easteal postulate that the MSA is the age when their model predicts a probability of death of one. This is arbitrary and unconvincing, especially in light of evidence suggesting that age-specific probabilities of death reach a plateau at advanced ages at a value of about 0.5 8 - 9. Although the authors acknowledge this evidence, they disregard it.

Moreover, they fit their model using the Ordinary Least Squares approach, which assumes normally distributed errors that are identical over age. This is an assumption that does not hold, implying that their estimated coefficients and standard errors are not correctly calculated.

We have read this submission. We believe that we have an appropriate level of expertise to confirm that it is of an acceptable scientific standard, however we have significant reservations, as outlined above.

References

  • 1. Newman S, Easteal S: The dynamic upper limit of human lifespan. F1000Research.2017;6: 10.12688/f1000research.11438.2 10.12688/f1000research.11438.2 [DOI] [PMC free article] [PubMed] [Google Scholar]
  • 2. Dong X, Milholland B, Vijg J: Evidence for a limit to human lifespan. Nature.2016;538(7624) : 10.1038/nature19793 257-259 10.1038/nature19793 [DOI] [PubMed] [Google Scholar]
  • 3. Lenart A, Vaupel J: Questionable evidence for a limit to human lifespan. Nature.2017;546(7660) : 10.1038/nature22790 E13-E14 10.1038/nature22790 [DOI] [PubMed] [Google Scholar]
  • 4. Rozing M, Kirkwood T, Westendorp R: Is there evidence for a limit to human lifespan?. Nature.2017;546(7660) : 10.1038/nature22788 E11-E12 10.1038/nature22788 [DOI] [PubMed] [Google Scholar]
  • 5. de Beer J, Bardoutsos A, Janssen F: Maximum human lifespan may increase to 125 years. Nature.2017;546(7660) : 10.1038/nature22792 E16-E17 10.1038/nature22792 [DOI] [PubMed] [Google Scholar]
  • 6. Hughes B, Hekimi S: Many possible maximum lifespan trajectories. Nature.2017;546(7660) : 10.1038/nature22786 E8-E9 10.1038/nature22786 [DOI] [PubMed] [Google Scholar]
  • 7. Rootzén H, Zholud D: Human life is unlimited – but short. Extremes.2017;20(4) : 10.1007/s10687-017-0305-5 713-728 10.1007/s10687-017-0305-5 [DOI] [Google Scholar]
  • 8. Barbi E, Lagona F, Marsili M, Vaupel JW, Wachter KW: The plateau of human mortality: Demography of longevity pioneers. Science.2018;360(6396) : 10.1126/science.aat3119 1459-1461 10.1126/science.aat3119 [DOI] [PMC free article] [PubMed] [Google Scholar]
  • 9. Gampe J: Human mortality beyond age 110. In Supercentenarians. Springer, Berlin, Heidelberg.2010;219-230
F1000Res. 2017 May 30. doi: 10.5256/f1000research.12350.r22232

Referee response for version 1

Michael R Rose 1, Laurence D Mueller 2

Evidently the Dong et al. Nature article 1 made some major, though elementary, mistakes: (a) an incorrect rounding procedure; and (b) choosing data from an historical period (1900-1990) that generally fit a limited lifespan expectation, while neglecting to consider other data. Newman and Easteal 2 correct the rounding error and look at human cohort data from a broader range of historical dates. However, they fit log-linear Gompertz models to the data, though doing so is questionable as they themselves admit, if in fact human mortality rates plateau 3. It is often the case that extrapolating regression models beyond the range used to fit them is fraught with danger.

Of most interest for us was whether the fundamental concept of inferring a species-wide maximum lifespan from one or even many cohorts of demographic data is cogent at all. With that in mind, we used mortality data from a twenty-cohort study of Drosophila melanogaster that we and our colleagues recently published 4. Specifically, we used “A-type” populations to predict sex-specific “maximum lifespans” for populations of “C-type” populations. Each of the ten pairs of A and C type populations share a common ancestral population in our laboratory, though they have since evolutionarily diverged.

We took the initial sample size of, say, cohort CO-i, sex-j ( N ij), and then computed the age at which the probability of survival in the matching ACO-i, sex-j cohort is <= 1/(10* N ij).  We plotted the maximum lifespans predicted from the 20 “A” sex-specific cohorts versus the observed maximum lifespan in the 20 corresponding “C” cohorts (see Figure 1) using a double plateau Gompertz model 4. If the concept of species-wide maximum longevity were cogent, we would expect all the observed maximum lifespans to be near or well below the y=x line. In fact, most are well above that line, and show no correlation with the predicted values. Effectively, the maximum lifespan estimation procedure is not generally reliable. In the case of the example that we give here, the maximum lifespan was altered by substantial genetic changes caused by natural selection.

We have long used experimental evolution to reconfigure the onset and end of periods of aging in carefully handled cohorts, as illustrated in publications 3 and 4. We do not regard maximum lifespans as characteristic of entire species, however they might be defined demographically. Rather, we view them as phenotypes that depend on both genotype and environment even in so-called “wild-type” populations, like most components of life history, as the extensive evolutionary literature on life history and aging has long suggested. More importantly, in cohorts that show a cessation of aging 3 we doubt that the concept of maximum lifespan has any biological cogency.


Figure 1. The predicted maximum lifespan based on 10 A-type populations 4 and the observed maximum lifespan in 10 C-type populations:

https://f1000researchdata.s3.amazonaws.com/supplementary/11438/8c2e3298-9ed0-4ac5-8b85-ce62336a9bbb.png

We have read this submission. We believe that we have an appropriate level of expertise to confirm that it is of an acceptable scientific standard.

References

  • 1. Dong X, Milholland B, Vijg J: Evidence for a limit to human lifespan. Nature.2016;538(7624) : 10.1038/nature19793 257-259 10.1038/nature19793 [DOI] [PubMed] [Google Scholar]
  • 2. Newman S, Easteal S: The dynamic upper limit of human lifespan. F1000Research.2017;6: 10.12688/f1000research.11438.1 10.12688/f1000research.11438.1 [DOI] [PMC free article] [PubMed] [Google Scholar]
  • 3. Mueller LD, Rauser CL, Rose MR: Does Aging Stop?. Oxford University Press.2011;
  • 4. Burke MK, Barter TT, Cabral LG, Kezos JN, Phillips MA, Rutledge GA, Phung KH, Chen RH, Nguyen HD, Mueller LD, Rose MR: Rapid divergence and convergence of life-history in experimentally evolved Drosophila melanogaster. Evolution.2016;70(9) : 10.1111/evo.13006 2085-98 10.1111/evo.13006 [DOI] [PubMed] [Google Scholar]
F1000Res. 2017 Jun 8.
Saul Newman 1

We wish to thank MRR and LDM for their review. We agree with the ideas expressed, particularly with the risk of extrapolating log-linear models and the potential for improving estimates of lifespan limits using alternate models of old age survival.

There is little about maximum human lifespan or lifespan limits can be concluded with certainty. Therefore, our focus was on implementing the simplest available methods. The appended figure S2 supported the rationale for our use of log-linear models for projecting lifespan limits.

This figure reproduces the plot presented by MRR and LDM for Drosophila using human data. It plots the upper observed lifespan (MRAD) of individuals in the GRG against their calculated lifespan limit.

We could match 331 validated maximum lifespan observations to a historical gender-pooled MSA estimate. Of these, 330 approached but do not exceed their predicted limit. The only exception was Jeanne Calment, who outlived the gender-pooled MSA limit by 3 years but fell short of the female-cohort limit shown in Figure 3a. Unlike Drosophila, these calculated limits seem to fit reasonably well with MRAD.

However, there are many problems involved in human data that do not affect Drosophila. Human populations are not directly observable past their maximum age, individual variation in mortality acceleration is unknown, and ascertainment and validation problems abound.

Therefore, we still consider these projection methods, the GRG and IDL data, and much of the discussion of MRAD, problematic.

Finally, we agree that in species with a cessation of ageing or negative senescence there will be an unbounded, finite maximum lifespan with intrinsic limit. By extension, if there were a complete cessation of ageing in humans at extreme old ages there would be no intrinsic limit, but many probabilistic constraints, to human lifespan.

F1000Res. 2017 May 18. doi: 10.5256/f1000research.12350.r22231

Referee response for version 1

Jean-Michel Gaillard 1

This manuscript challenges the recent findings by Dong et al. that human lifespan has an upper limit and proposes that human lifespan is rapidly increasing. While I am quite convinced by all the problems the authors identified in the analysis performed by Dong et al. and by the maximum survivable age of about 125 years the authors estimated for humans, I am not convinced at all by the claim that maximum reported age at death is expected to rise over the next century.

In particular, I do not understand the rationale of removing Jeanne Calment from the analysis. This data point has been validated. Contrary to the authors' interpretation, the mere existence of a lifespan of 122 observed 20 years ago without being even approached since then seems to indicate that some saturation in the maximal age at death is occurring. It is required to estimate the probability of not observing older ages at death for 20 years under different scenarios of increasing trends in maximal age at death.

Detailed comments:

p. 3 second column 3rd paragraph l. 1: Remove "significant"

p. 3 second column 3rd paragraph l. 1: Should be "Calment", not "Clament"!

I have read this submission. I believe that I have an appropriate level of expertise to confirm that it is of an acceptable scientific standard, however I have significant reservations, as outlined above.

F1000Res. 2017 Jun 6.
Saul Newman 1

We thank J-MG for these comments, and welcome the opportunity to clarify our analysis and expand our rationale for this study.

We wish to clarify that our projected increase in MRAD over the coming century is not based on IDL or GRG lifespan data, and these projections do not require either removal or inclusion of Jeanne Calment. Rather, these projections are based on theoretical lifespan limits calculated using HMD and WHO life table data, including the WHO population projections through 2100.

Our statement that “period data indicate that MSA is steadily increasing from a historic low c.1956 (Figure 3b and c) and that the MRAD is expected to rise over the next century” is based on observed HMD and WHO data for the “historic low” in 1956 and on WHO population projections over 2015-2100 for the ‘steady rise’. We can see that we did not make this distinction sufficiently clear and we have amended the text to make it clearer.

The rationale for removing Jeanne Calment from the regression of observed trends was to demonstrate her singular effect on recent MRAD trends. Jeanne Calment is a remarkable statistical outlier from historic trends in both Dong et al. and our linear models, with a Cook’s distance of 1.97 (Cook, 1982).

A large Cook’s distance is not necessarily grounds for ignoring a well-validated data point. Our finding that the inferred decline in MRAD is eliminated by removal of one outlier demonstrates that the inference is tenuous rather than invalid.

We find it notable that such broad conclusions on lifespan limits depend on the status of a single data point. We agree that the 20-year streak set by Jeanne Calment is remarkable, and we consider it valid. However, we disagree that this indicates a saturation of old-age survival.

Jeanne Calment’s record-holding streak is not unprecedented in length. Mary Kelly held the overall lifespan record for 17 years from 1964 to 1981. Gert Adrians-Boomgaard held the male lifespan record for 68 years. Mathew Beard broke this record, and held it for another 21.9 years (1985-2007). Like Jeanne Calment, Mathew Beard exceeded the next-lowest record by three years for this period.

We consider that these record-holding streaks do not reflect saturation of the MRAD, but the uncertain ascertainment and stochastic nature of lifespan records. Therefore, we suggest Jeanne Calment’s survival reflects a rare statistical event where survival has approached the calculated upper limit of lifespan in her cohort. We think this event is a result of stochastic variation, and is biasing the projection of short-term trends. The simulated removal of Jeanne Calment was intended to indicate this. 

More broadly, we feel that too much emphasis is placed on this single data point. Jeanne Calment’s predecessor Carrie White held a well-verified claim to the world’s oldest and then second-oldest woman for 24 years, before the claim was recognised as a clerical error in 2012 and retracted.

In the unlikely event that Jeanne Calment’s lifespan claim is also false, demographers would be depending on conclusions about lifespan limits from a single, false data point that is an outlier from the aggregate trend across 1626 other supercentenarians in the GRG (see figure S1).

Furthermore, a declining or flat trend in lifespan limits is inconsistent with our analysis of 3.3 billion lifespan records in 194 nations. We maintain that statistical trends in data for billions of deaths should not be ignored in favour of a single data point in 1997.

Finally, we accept our spelling error for Jeanne Calment’s name. Yet we do not understand the request to remove the word ‘significantly’ from the text: the negative trend was significant (p=0.03).


Articles from F1000Research are provided here courtesy of F1000 Research Ltd

RESOURCES