

Abstract
Objective:
To identify the key risk factors and explain the spatiotemporal patterns of childhood asthma in the Memphis metropolitan area (MMA) over an 11-year period (2005–2015). We hypothesize that in the MMA region this burden is more prevalent among urban children living south, downtown, and north of Memphis than in other areas.
Methods:
We used a large-scale longitudinal electronic health record database from an integrated healthcare system, Geographic information systems (GIS), and statistical and space-time models to study the spatiotemporal distributions of childhood asthma at census tract level.
Results:
We found statistically significant spatiotemporal clusters of childhood asthma in the south, west, and north of Memphis city after adjusting for key covariates. The results further show a significant increase in temporal gradient in frequency of emergency department (ED) visits and inpatient hospitalizations from 2009 to 2013, and an upward trajectory from 4 per 1,000 children in 2005 to 16 per 1,000 children in 2015. The multivariate logistic regression identified age, race, insurance, admit source, encounter type, and frequency of visits as significant risk factors for childhood asthma (p < 0.05). We observed a greater asthma burden and healthcare utilization for African American (AA) patients living in a high-risk area than those living in a low-risk area in comparison to the white patients: AA vs. white [odds ratio (OR) = 3.03,95% confidence interval (CI):2.75–3.34]; and Hispanic vs. white (OR=1.62,95% CI:1.21–2.17).
Conclusions:
These findings provide a strong basis for developing geographically tailored population health strategies at the neighborhood level for young children with chronic respiratory conditions.
Keywords: Childhood asthma, healthcare utilization, race, risk factors, spatiotemporal patterns
Introduction
Asthma is a common chronic childhood disease and a major burden in terms of hospital admission, care utilization, and medical care expenses [1]. The strongest riskfactors for developing asthma are a combination of genetic predisposition with environmental exposure to inhaled substances and particles that may provoke allergic reactions or irritate the airways [2]. Such exposures include indoor allergens (for example, house dust mites in bedding, carpets and stuffed furniture, pollution, and pet dander); outdoor allergens (such as pollens and molds); tobacco smoke; chemical irritants in the workplace; and air pollution [2,3].
Data from the 2011 National Health Interview Survey (NHIS) showed a considerable increase in asthma prevalence in the United States from about 20 million in 2001, to about 26 million by 2011 [4]. According to 2011 NHIS data, 129.1 out of every 1,000 persons were diagnosed with asthma by a health professional [4]. The highest prevalence rate was observed in those aged 517 years (105.5 per 1,000 population) and the rate in those under 18 years (94.9 per 1,000) was significantly greater than those over 18 (81.6 per 1,000) [4]. Race-specific asthma trends continue to show higher asthma prevalence among blacks, with the current asthma prevalence rate being 47% higher in blacks than in whites (118.0 vs. 80.4 per 1,000 persons, respectively). Overall, asthma attacks occur more commonly among those with a family income less than 100% of the federal poverty threshold than persons with income between 250% and less than 450% of the 30 poverty threshold (55.1% vs. 47.9%) [4–7]. This is especially heightened among those living in the south and west of the United States, than those living in the Northeast [4–7].
Asthma exerts an economic burden seen in both the adult and pediatric population in the United States. From 2002 to 2007, the annual economic cost of asthma in the United States was $56 billion; of which $50.1 billion were direct healthcare costs while the remaining $5.9 billion were indirect costs due to loss of productivity [10]. In 2008, employed adults aged 18 years had at least one asthma attack in the past 12 months and reported 14.2 million missed work days [11]. Among the U.S. children, the asthma-specific missed school days were 10.5 million in 2008 compared to only 3.6 million days in 1997 [10]. Childhood asthma has detrimental health and economic effects, and is a principal driver of emergency department (ED) visits, inpatient hospitalizations, and missed school days [1,2,6,7].
Among the 50 states, the burden of asthma in Tennessee (TN) remains high. In 2007, the state was nationally ranked 22nd highest in childhood asthma prevalence and 27th highest in lifetime childhood asthma prevalence [12]. Asthma prevalence in this state increased from 8.6% in 2003 to 9.5% in 2007 [13]. It was also higher among males than females and higher among blacks than among whites [12,13]. Despite significant decreases in hospitalization rates among children in 2010, the rate for asthma was highest among children aged 1–4 years (215.9 per 100,000). In fact, between 2001 and 2010, children aged 5–10 years had an overall 18% increase in ED visits with primary asthma; the rates for this age bracket increased from 985.6 per 100,000 to 1,163.0 per 100,000. In TN, of all first-listed diagnosis ICD-9 codes for all inpatient hospital discharges with ED services in 2013, asthma accounted for 1.2% and the highest proportion of discharges, 7%, was observed among children aged 017 years [14]. Of note, in 2015, Memphis, TN was named as the Asthma Capital in the United States by the Asthma and Allergy Foundation [15]; this was a change in position from second place the previous year and from sixth place in 2009 [16]. Shelby County was among the top ten counties with the highest asthma ED and hospitalization rates between 2008 and 2012, with a hospitalization rate of 227 per 100,000 [17]. In 2013, the pediatric ED utilization rate in this county was 192.6 per 10,000, accounting for 31% of visits in TN; the overall ED utilization rate for the state stood at 102.1 per 10,000 [17]. Shelby County has one of the highest average per visit charges for inpatient hospitalizations for primary asthma, and the highest average per visit charges for outpatient or ED visits for children aged 1–17 years at $17,190 and $2,440, respectively [17].
The Memphis metropolitan area (MMA), where this study was conducted, is made up of eight counties, three in TN and five in Arkansas and Mississippi. Temporal data on asthma are still limited in this region [18,19]. There are knowledge gaps in the identification of spatiotemporal patterns in childhood asthma in the region, yet this knowledge is essential in facilitating the development of effective, geographically tailored population health interventions to reduce disease burden [22–38]. Some of the studies that attempted to bridge this gap include a smallsized study from Ontario, Canada, and the reported discrete spatial patterns of asthma were age and sex-specific [23]. Another study from Alameda County, California linked areas with lower socioeconomic status (SES) to elevated ED visits [20]. Similar studies are needed to better understand spatiotemporal patterns, to characterize the spatial/temporal distribution of childhood asthma, and to provide an in-depth analysis of spatial variations in health event risk. Robust spatiotemporal data from this study may aid in the systematic assessment of pediatric populations and reduction of asthma morbidity in the high-risk areas by mobilizing targeted programs such as the Changing High-Risk Asthma in Memphis through Partnership (CHAMP) program. We will fill these critical gaps through this study. In this study, we hypothesize that in the MMA region this burden is more prevalent among urban children living south, downtown, and north of Memphis than in other areas. We anticipate asthma trends in the MMA region will mirror the state-level and surrounding areas. Asthma prevalence will be higher among male children compared to females, higher in African American (AA) children compared to other ethnic/racial groups, and also will be more prevalent in the city of Memphis than other MMA regions.
Materials and methods
Study location and settings
The MMA region covers 312 census tracts situated in eight counties with an estimated population of 1,320,000, according to the U.S. 2010 Census Bureau (Figure 1). About 29% of this population is 18 years or younger. This region includes a large underserved population, a rapidly urbanizing low-income community emerging from the rural surroundings, inner-city, and immediate areas, which are characterized by low SES, poor housing conditions, high crime levels, high unemployment and poverty levels, and low education levels according to Shelby County Community Health Assessment Report 2015 and U.S. 2010 Census Bureau data.
Figure 1.
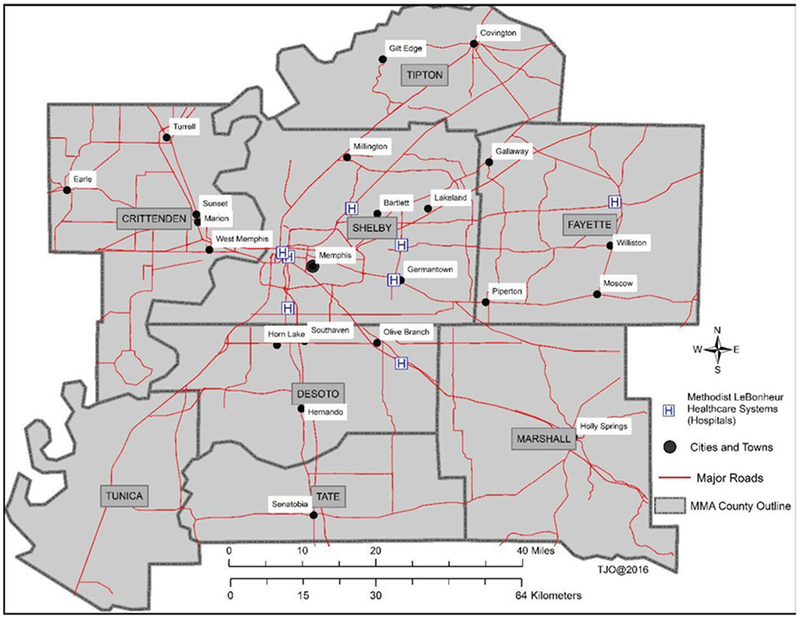
Locations, study area, and settings in Memphis metropolitan area. The Methodist Le Bonheur Healthcare consists of eight major regions.
Study design
A retrospective space-time study design, including a large-scale longitudinal electronic health records (EHR) database from an integrated healthcare system [Methodist Le Bonheur Healthcare (MLH)], GIS, and statistical and space-time models were used to study the spatiotemporal distributions and patterns of childhood asthma at census tract level in one of the largest metropolis in the southern United States over an 11-year period (2005–2015). Even if the MLH system started EHR database implementation in 2001, their registrations only went live in 2005. So, for this reason, we used hospital discharge records beginning from 2005. This study (15–04053-XM) was approved by the Institutional Review Boards at the University of Tennessee Health Science Center and MLH.
Data categories
Three categories of datasets were analyzed in this study.
ED visits and inpatient hospitalizations for asthma, 2005 through 2015
All asthma patients (≤18 years old at baseline, n = 28,793) residing in the MMA region were included in this study. Asthma patients were identified using code 493.xx (Asthma and subclassifications) as specified by the World Health Organization’s International Classification of Diseases Code, Ninth Revision, Clinical Modification (ICD-9-CM). Patients with primary and/or secondary (comorbid) asthma diagnosis codes documented in their medical records were included in the study. For this study, the medical records were available for the same patients and/or new patients over the course of the study period. The patient registry assigns two patient identifiers, which were used to link and harmonize individual medical records. A medical record number is assigned at the time of the initial encounter and the number remains the same for all ED visits and inpatient hospitalizations; and a financial identification number is assigned to each subsequent encounter to track overall utilization of the same patient.
Children population, U.S. Census Bureau
Demographic data for children who are 18 years or younger and living within the MMA region were downloaded from the 2010 U.S. Census Bureau. Additional demographic data for other years were obtained from the American Community Survey.
Geospatial data
Boundary outlines at census tract and county levels were obtained from the Geoplatform.gov website. City and place data were also compiled from the same website.
Measures
We linked all the geocoded asthma patient data (individuals were aggregated at census tract level) with adjusted rates at census tract level for all the counties in the MMA region. All patients coming from outside the MMA region were excluded from this study.
Health outcomes
(1) ED visits and hospitalization rates of children with an asthma diagnosis in the MMA region. Rates are derived using two denominators (total population of the sample and total population of children who are 18 years or younger for every 1,000 children). (2) High- and low-risk areas of childhood asthma in the MMA region identified using spatiotemporal models.
Variables
Race, ethnicity, age, sex, insurance, admit source, encounter type, length of stay (LOS), frequency of visits, diagnosis type, and unit cost. LOS is defined as the time in days between the patient’s admission and discharge dates.
Data analysis
Our data analysis plan involved three steps. The first step involved data processing and cleaning of ED and inpatient hospitalization data and other relevant datasets. The second step involved geocoding and mapping of ED and inpatient hospitalization data ArcGIS 10.2.2 (ESRI Inc., Redlands, CA, USA). Each patient’s home address was geocoded and aggregated to one of 312 geographic census tracts. In the third step, we conducted statistical and spatial analyses of the data using SAS 9.4 (SAS Institute Inc., Cary, NC, USA) and ArcGIS 10.2.2. In this step, we generated descriptive statistics and conducted statistical tests using Chi-Square and t-tests. We also constructed spatiotemporal models using SaTScan (developed jointly by Kulldorff M., Boston, Massachusetts and Information Management Services, Inc., Silver Spring, MD, USA). Kulldorff’s retrospective space-time statistics, discrete Poisson model, was used to determine whether high or low rates of childhood asthma were randomly distributed in the MMA region over space and time [45–49]. Using high- and low-risk area data from the spatiotemporal models, bivariate and multivariate logistic regression models were developed to compare health outcomes. In the three steps described above, we implemented commonly applied standards and protocols for data processing and cleaning, geocoding, and mapping. Additional quality assurance and quality control measures were undertaken to ensure correct address matching and all the data were consistent, representative, and of high quality.
Results
Characteristics and demographics of study sample
In the MLH patient data registry, there were 28,793 unique cases of children with asthma (patients) and 76,354 total encounters (i.e. number of patient visits represented by this sample) who either visited the ED or were hospitalized during the study period. Table 1 shows the demographic characteristics of asthma patients over the entire 11-year period. Among the unique asthma cases, about 79% were AA compared to only 16% whites. There were more males than females in the sample, 60.6% vs. 39.4%, respectively (Table 1). The overall mean age of patients enrolled was 4.6 years (Table 1). Demographics stratified by age groups show that 51% were less than five years, 27.5% five to eight years, 12.6% nine to eleven years, and 8.9% 12–18 years. A majority of the patients depended on TennCare (63.9%) followed by commercial or private insurance (23.2%). Encounter types were mostly emergency visits (74.3%), followed by inpatient admissions (14.2%). Most of the admission sources were home/self-referrals (68.5%), followed by admission from the emergency room (22.6%). Over half of the patients had a primary diagnosis of asthma (56.8%), with 43.0% having a secondary diagnosis of asthma.
Table 1.
Baseline characteristics of the asthma patients included in the study sample from 2005 to 2015 (N = 28,793).
| Variable | n | % or mean or median |
|---|---|---|
| Age, median (SD) | 28,793 | 4.0(3.9) |
| Age, mean (SD) | 28,793 | 4.6(3.9) |
| LOS, median | 28,793 | 0.7 |
| Sex, % | ||
| Female | 11,354 | 39.4% |
| Male | 17,436 | 60.6% |
| Race, % | ||
| Black or AA | 22,590 | 78.5% |
| White | 4,546 | 15.8% |
| Hispanic | 242 | 0.8% |
| Other | 1,415 | 4.9% |
| Ethnicity, % | ||
| Hispanic | 851 | 3.0% |
| Non-Hispanic | 23,037 | 80.0% |
| Other | 4,905 | 17.0% |
| Frequency of visits, % | ||
| 1 visit | 15,010 | 52.1% |
| 2–5 visits | 10,753 | 37.4% |
| 6–10 visits | 2,118 | 7.4% |
| 10+ visits | 912 | 3.2% |
| Insurance type | ||
| Medicaid | 2,601 | 9.0% |
| TennCare | 18,391 | 63.9% |
| Commercial or private | 6,678 | 23.2% |
| Charity/self-pay | 996 | 3.5% |
| Other | 127 | 0.4% |
| Encounter type | ||
| Emergency | 21,383 | 74.3% |
| Inpatient | 4,096 | 14.2% |
| Observation | 2,567 | 8.9% |
| Outpatient | 587 | 2.0% |
| Other | 160 | 0.6% |
| Admit source | ||
| Home/self-referral | 19,711 | 68.5% |
| Emergency room | 6,500 | 22.6% |
| Physician referral/clinic | 1,095 | 3.8% |
| Transfers within the system | 106 | 0.4% |
| Transfers from other systems | 140 | 0.5% |
| Non-healthcare facility | 56 | 0.2% |
| Other | 1,185 | 4.1% |
| Diagnosis type | ||
| Primary asthma | 16,341 | 56.8% |
| Secondary asthma | 12,387 | 43.0% |
| Both primary and secondary asthma | 65 | 0.2% |
Additional analysis of the number of encounters per unique patient showed an overall mean of 2.6 times in this pediatric population. However, subgroup analyses revealed that on an average AA children had 2.9 encounters compared to only 1.8 by the whites. In Table 2, we present the overall characteristics of asthma patients by frequency of encounters. In total, about 52.1% of the study sample had only one patient visit to the hospital, 37.4% two to five hospital visits, and 10.5% had six or more hospital visits. Figure 2b shows that more frequent encounters were seen with children less than 5 years, while Table 2 shows the mean age for patients with one encounter was 5.2, with two to five encounters was 4.2, with six to ten encounters was 3.4, and with ten or more encounters was 3.2, respectively. Males utilized the hospital more frequently than females—59.3% of males and 40.7% of females had one encounter, 61.56% of males and 38.4% of females had two to five encounters, 62.3% of males and 37.7% of females had six to ten encounters, and 64.7% of males and 35.2% of females had ten or more encounters. TennCare was the most commonly used type of insurance for all visits, and was used with increasing frequency as the number of encounters increased, accounting for 57.23% of insurance type for patients with one encounter, to 68.6% for patients with two to five encounters, 79.2% for those with six to ten encounters, and 81.5% of those with ten or more encounters. The frequency of visits was similar for patients admitted from home/self-referral despite the increasing number of encounters (70.3% for one encounter, 66.7% for two to five encounters, 65.8% for six to ten encounters, and 64.8% for patients with ten or more encounters). Patients admitted from the emergency room increased from 19.9% for those with one encounter, to greater than 25% for those with two or more encounters. Interestingly, encounters referred for admission by physician referral/clinical transfers though few decreased dramatically from 5.1% for one encounter, to 2.7% for two to five encounters, 1.5% for six to ten encounters, and 0.7% for ten or more encounters. With increasing frequency of encounters, the primary diagnosis of asthma increased from 51.0% for one encounter to 61.3% for two to five encounters, 68.2% for six to ten encounters, and 71.7% for ten or more encounters. The trend reversed however for secondary diagnosis of asthma, 48.8% for one encounter, 38.5% for two to five encounters, 31.6% for six to ten encounters, and 28.3% for ten or more encounters.
Table 2.
Baseline characteristics of asthma patients based on their overall utilization.
| Frequency of encounter = 1 (N = 15,010; 52.1%) | Frequency of encounters = 2–5 (N = 10,753; 37.4%) | Frequency of encounters = 6–10 (N = 2,118; 7.4%) | Frequency of encounters = 10+ encounters (N = 912; 3.2%) | |||||
|---|---|---|---|---|---|---|---|---|
| Variable | ||||||||
| Age, median (SD) | 15,010 | 4.0 (4.2) | 10,753 | 3.0 (3.5) | 2,118 | 3.0 (3.0) | 912 | 2.0 (2.7) |
| Age, mean (SD) | 15,010 | 5.2 (4.2) | 10,753 | 4.2 (3.6) | 2,118 | 3.4 (3.0) | 912 | 3.2 (2.7) |
| LOS, median | 15,010 | 0.7 | 10,753 | 0.7 | 0.7 | 0.8 | ||
| Sex, % | ||||||||
| Female | 6,105 | 40.7% | 4,129 | 38.4% | 799 | 37.7% | 321 | 35.2% |
| Male | 8,904 | 59.3% | 6,623 | 61.6% | 1,319 | 62.3% | 590 | 64.7% |
| Race, % | ||||||||
| Black or AA | 10,885 | 72.5% | 8,931 | 83.1% | 1,922 | 90.8% | 852 | 93.4% |
| White | 3,072 | 20.5% | 1,325 | 12.3% | 116 | 5.5% | 33 | 3.6% |
| Hispanic | 175 | 1.2% | 59 | 0.6% | 8 | 0.4% | 0 | 0.0% |
| Other | 878 | 5.9% | 438 | 4.1% | 72 | 3.4% | 27 | 3.0% |
| Ethnicity, % | ||||||||
| Hispanic | 480 | 3.2% | 296 | 2.8% | 53 | 2.5% | 22 | 2.4% |
| Non-Hispanic | 11,118 | 74.1% | 9,093 | 84.6% | 1,954 | 92.3% | 872 | 95.6% |
| Other | 3,412 | 22.7% | 1,364 | 12.7% | 111 | 5.2% | 18 | 2.0% |
| Insurance type | ||||||||
| Medicaid | 1,515 | 10.1% | 895 | 8.3% | 139 | 6.6% | 52 | 5.7% |
| TennCare | 8,598 | 57.3% | 7,373 | 68.6% | 1,677 | 79.2% | 743 | 81.5% |
| Commercial or private | 4,235 | 28.2% | 2,113 | 19.7% | 243 | 11.5% | 87 | 9.5% |
| Charity/self-pay | 602 | 4.0% | 319 | 3.0% | 48 | 2.3% | 27 | 3.0% |
| Other | 60 | 0.4% | 53 | 0.5% | 11 | 0.5% | 3 | 0.3% |
| Encounter type | ||||||||
| Emergency | 11,184 | 74.5% | 8,024 | 74.6% | 1,519 | 71.7% | 656 | 71.9% |
| Inpatient | 1,961 | 13.1% | 1,585 | 14.7% | 371 | 17.5% | 179 | 19.6% |
| Observation | 1,349 | 9.0% | 947 | 8.8% | 200 | 9.4% | 71 | 7.8% |
| Outpatient | 372 | 2.5% | 181 | 1.7% | 28 | 1.3% | 6 | 0.7% |
| Other | 144 | 1.0% | 16 | 0.2% | 0 | 0.0% | 0 | 0.0% |
| Admit source | ||||||||
| Home/self-referral | 10,551 | 70.3% | 7,175 | 66.7% | 1,394 | 65.8% | 591 | 64.8% |
| Emergency room | 2,987 | 19.9% | 2,691 | 25.0% | 585 | 27.6% | 237 | 26.0% |
| Physician referral/clinic | 764 | 5.1% | 294 | 2.7% | 31 | 1.5% | 6 | 0.7% |
| Transfers within the system | 58 | 0.4% | 39 | 0.4% | 6 | 0.3% | 3 | 0.3% |
| Transfers from other systems | 91 | 0.6% | 44 | 0.4% | 3 | 0.1% | 2 | 0.2% |
| Non-healthcare facility | 33 | 0.2% | 16 | 0.2% | 4 | 0.2% | 3 | 0.3% |
| Other | 526 | 3.5% | 494 | 4.6% | 95 | 4.5% | 70 | 7.7% |
| Diagnosis type | ||||||||
| Primary asthma | 7,654 | 51.0% | 6,589 | 61.3% | 1,444 | 68.2% | 654 | 71.7% |
| Secondary asthma | 7,322 | 48.8% | 4,138 | 38.5% | 669 | 31.6% | 258 | 28.3% |
| Both primary and | 34 | 0.2% | 26 | 0.2% | 5 | 0.2% | 0 | 0.0% |
| secondary asthma | ||||||||
Figure 2.
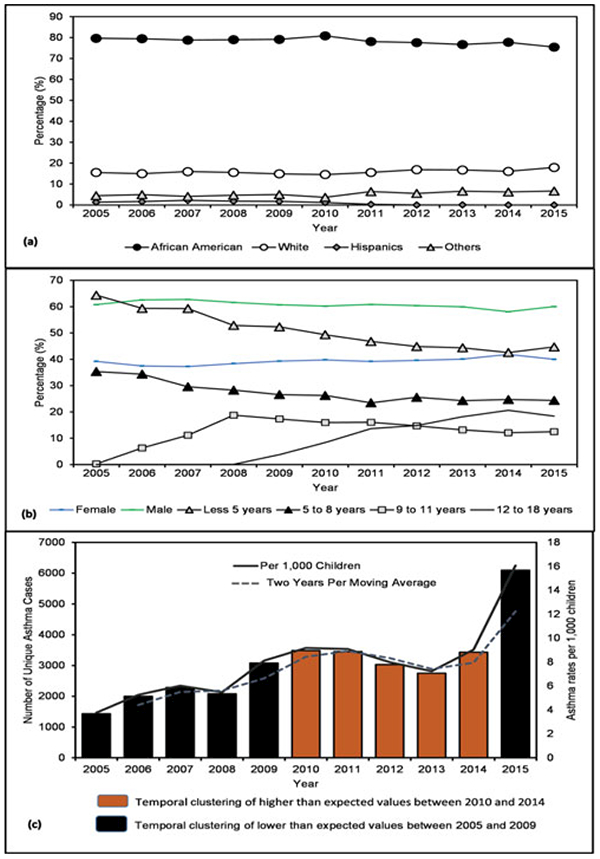
Distribution of asthma by race and age, 2005–2015. (a) Race, (b) sex and age at the time of hospital visit, and (c) asthma temporal trends and clustering using SaTScan (bars) and moving average (line).
The overall asthma ED and hospitalization rate for the MMA region was 75.9 per 1,000 children [95% confidence interval (CI) 61.1–94.2]; stratified separately, ED rate stood at 56.9 per 1,000 (CI: 56.2–57.6) while hospitalization rate was 10.8 per 1,000 (CI: 10.5–11.1). Raceadjusted rates for AAs were 113 per 1,000 children (CI: 95–134) (ED rates 102.1 and hospitalization rates 13.3), white 29 per 1,000 children (CI: 20–42) (ED rates 18.4 and hospitalization rates 6.1), and Hispanic 9 per 1,000 children (CI: 5–17) (ED rates 9.0 and hospitalization rates 3.3). Sex-specific rates for male and female were 95.2 per 1,000 and 64.9 per 1,000, respectively (ED rates: 71.2 male, 48.9 female; hospitalization rates: 12.8 male, 9 female). Age-specific rates for children less than five years were 157 per 1,000 (ED rates 115.1 and hospitalization rates 23.9), five to eight years 99 per 1,000 (ED rates 75.8 and hospitalization rates 13.0), nine to eleven years 64 per 1,000 (ED rates 50.9 and hospitalization rates 6.7), and 12–18 years 23 per 1,000 (ED rates 16.3 and hospitalization rates 2.5).
The mean and median LOSs were 1.1 ± 2.7 SD and 0.7 days, respectively. Prolonged hospitalization and severity were analyzed using a measure of LOS of 3 days or more. About 4.5% (1,292/28,793) of study sample had a LOS of 3 or more days. Of these, 67% were AA and 25% were white. Of note, the frequency of AA children with prolonged LOS was 2.7 times higher than their white counterparts. A further analysis of this subgroup shows that 57.3% were males; and 60% were less than 5 years at the time of visit, 21.52% 5–8 years, 12.22% 9–11 years, and 6.26% 12–18 years.
From 2005 to 2015, the total estimated cost for asthma-specific healthcare events and resource utilization for this study population was about $19 million. The direct cost for this population made up to two-thirds of the total cost. The direct cost was about $7 million for patients with one encounter, $5 million for patients with two to five encounters, $0.5 million for patients with six to ten encounters, and $90,000 for patients with ten or more encounters. Direct costs for these encounters made up to 61% of the total cost.
Comparison of areas with higher than expected rates of asthma ED and hospitalization identified using a spatiotemporal model
An analysis of hotspots identified using higher than expected rates of childhood asthma ED and hospitalization rates was conducted by spatially querying patients from low- and high-risk areas. Bivariate and multivariate logistic regression models were used to compare the two groups and account for potential confounders (Tables 3 and 4). Our results show that on average patients living in a low-risk area tended to be much older than those in a high-risk area (5.0 vs. 4.3, p < 0.001) (Table 3). Patients in the high-risk areas are younger than those in the low-risk areas. The LOS was statistically higher in low-risk area compared to high-risk area (mean 0.71 versus 0.67 days, p = 0.012) suggesting patients living in high-risk area had more ED visits than inpatient hospitalizations. The proportion of male patients was statistically higher than female patients in both low- and high-risk areas (p = 0.0047).
Table 3.
Characteristics of asthma patients (2005–2015) based on spatiotemporal patterns of high-risk and low-risk areas in the MMA region.
| Low (n = 11,175) |
High (n = 12,830) |
|||
|---|---|---|---|---|
| Variable | n | % or mean or median | n | % or mean or median |
| Age, median (SD) | 11175 | 4.0 (4.0) | 12830 | 3.0 (3.7) |
| Age, mean (SD)* | 11175 | 5.0 (4.0) | 12830 | 4.3 (3.7) |
| LOS, median | 11175 | 0.7 | 12830 | 0.7 |
| Sex, % | ||||
| Female | 4314 | 38.6 | 5205 | 40.6 |
| Male | 6859 | 61.4 | 7625 | 59.4 |
| Race, % | ||||
| Black or AA | 8167 | 73.1 | 11556 | 90.1 |
| White | 2201 | 19.7 | 681 | 5.3 |
| Hispanic | 118 | 1.1 | 90 | 0.7 |
| Other | 689 | 6.2 | 503 | 3.9 |
| Ethnicity, % | ||||
| Hispanic | 390 | 3.5 | 351 | 2.7 |
| Non-Hispanic | 8848 | 79.2 | 10550 | 82.2 |
| Other | 1937 | 17.3 | 1929 | 15.0 |
| Frequency of visits, % | ||||
| 1 visit | 6175 | 55.3 | 6053 | 47.2 |
| 2–5 visits | 3985 | 35.7 | 5153 | 40.2 |
| 6–10 visits | 719 | 6.4 | 1131 | 8.8 |
| 10+ visits | 296 | 2.7 | 493 | 3.8 |
| Insurance | ||||
| Medicaid | 594 | 5.3 | 896 | 7.0 |
| TennCare | 6504 | 58.2 | 10044 | 78.3 |
| Commercial or private | 3599 | 32.2 | 1471 | 11.5 |
| Charity/self-pay | 428 | 3.8 | 362 | 2.8 |
| Other | 50 | 0.5 | 57 | 0.4 |
| Encounter type | ||||
| Emergency | 8111 | 72.6 | 10056 | 78.4 |
| Inpatient | 1694 | 15.2 | 1541 | 12.0 |
| Observation | 1032 | 9.2 | 1044 | 8.1 |
| Outpatient | 255 | 2.3 | 146 | 1.1 |
| Other | 83 | 0.7 | 43 | 0.3 |
| Admit source | ||||
| Home/self-referral | 7570 | 67.7 | 8975 | 70.0 |
| Emergency room | 2504 | 22.4 | 2927 | 22.8 |
| Physician referral/clinic | 555 | 5.0 | 256 | 2.0 |
| Transfers within the system | 60 | 0.5 | 27 | 0.2 |
| Transfers from other systems | 58 | 0.5 | 34 | 0.3 |
| Non-healthcare facility | 22 | 0.2 | 16 | 0.1 |
| Other | 406 | 3.6 | 595 | 4.6 |
| Diagnosis type | ||||
| Primary asthma | 6294 | 56.3 | 7433 | 58.0 |
| Secondary asthma | 4856 | 43.5 | 5369 | 41.9 |
| Both primary and secondary asthma | 25 | 0.2 | 28 | 0.2 |
Note.
p < 0.05.
Table 4.
Multivariable evaluation of predictors of residence for high- vs. low-risk areas of asthma ED visits and hospitalizations in the MMA region over an 11-year study period, 2005–2015.
| Variables | aOR (95% CI) |
|---|---|
| Age (years) | |
| Less than 5 | 1.00 |
| 5–8 | 0.94(0.88–0.99)* |
| 9–11 | 0.97 (0.88–1.06) |
| 12–18 | 0.82 (0.73–0.92)* |
| Race | |
| White | 1.00 |
| Black or AA | 3.03 (2.75–3.34)* |
| Hispanic | 1.62 (1.21–2.17)* |
| Other | 1.66 (1.43–1.93)* |
| Frequency of visits | |
| 1 visit | 1.00 |
| 2–5 visits | 1.11 (1.05–1.18)* |
| 6–10 visits | 1.18 (1.07–1.31)* |
| 10+ visits | 1.21 (1.04–1.41)* |
| Encounter type | |
| Outpatient | 1.00 |
| Emergency | 0.79 (0.57–1.09) |
| Inpatient | 0.67 (0.48–0.93)* |
| Observation | 0.71 (0.51–0.99)* |
| Other | 1.02 (0.65–1.60) |
| Admit source | |
| Transfers within the system | 1.00 |
| Non-healthcare facilities | 1.60 (0.68–3.74) |
| Emergency room | 2.08 (1.27–3.40)* |
| Home/self-referral | 2.03 (1.24–3.32)* |
| Physician referral | 1.02 (0.59–1.77) |
| Transfers from other systems | 1.34 (0.69–2.61) |
| Other | 2.39 (1.44–3.98)* |
| Health insurance | |
| TennCare | Reference |
| Charity/self-pay | 0.63 (0.55–0.73)* |
| Commercial or private | 0.35 (0.33–0.38) |
| Medicaid | 1.24(1.10–1.38)* |
| Other | 0.79 (0.53–1.17) |
Note. aOR = Adjusted odds ratio.
Statistically significant at p < 0.05.
AA patients living in high- and low-risk areas accounted for the highest proportion of ED visits and inpatient hospitalizations. TennCare was the top most used public health insurance in both low- and high-risk areas; however, a higher proportion of TennCare use was more evident among the high-risk area group compared to the low-risk area group (78.3% vs. 8.2%). In addition, patients living in the low-risk area were most likely to have private insurance in comparison to those living in high-risk area (32.2% vs. 11.5%).
For encounter type, patients from both low- and high-risk areas had the highest frequency of ED visits (72.6% and 78.4%, respectively), followed by inpatient encounters (15.2% and 12.01%), observation (9.2% and 8.1%), outpatient (2.2% and 1.1%), and other (0.74% and 0.34%). Patients from high-risk area had significantly lower odds of having inpatient or observation encounter type in comparison to those from the low-risk area. A further analysis of encounter type by race for low- and high-risk areas revealed that AA patients had the highest visits of all categories, emergency (91.1%), inpatient (85.1%), observation (89.6%), outpatient (78.1%), and other (79.1%). Both areas have similar admit sources, mostly from home/selfreferral (67.7% for low-risk area and 70% for high-risk area). The frequency of primary diagnosis of asthma was also similar in both low- and high-risk areas (56.3% and 57.9%), as well as for secondary diagnosis of asthma (43.5% and 41.9%, respectively).
The analysis for asthma-specific healthcare events and resource utilization for high-risk area had a direct estimated cost of about $4 million while the cost for low-risk area was about $5 million. There was an indirect cost of 36% of the total cost for the two areas.
A stepwise multivariate logistic regression analysis to predict residence in high- vs. low-risk areas showed no effects from sex (p = 0.0626); however, the effect of race was persistent among the minority population compared to white population: AA vs. white (OR = 3.03, 95% CI: 2.75–3.34); Hispanic vs. white (OR = 1.62, 95% CI: 1.21–2.17); and other vs. white (OR = 1.66, 95% CI: 1.43–1.93) (Table 4). Overall, the logistic regression model showed race, insurance [Medicaid (OR = 1.24, 95% CI: 1.10–1.38)], and admit source (emergency, home/self-referral) were significant risk factors for childhood asthma in this MMA region (p < 0.005).
Spatiotemporal patterns and hotspots of asthma utilization and hospitalization rates
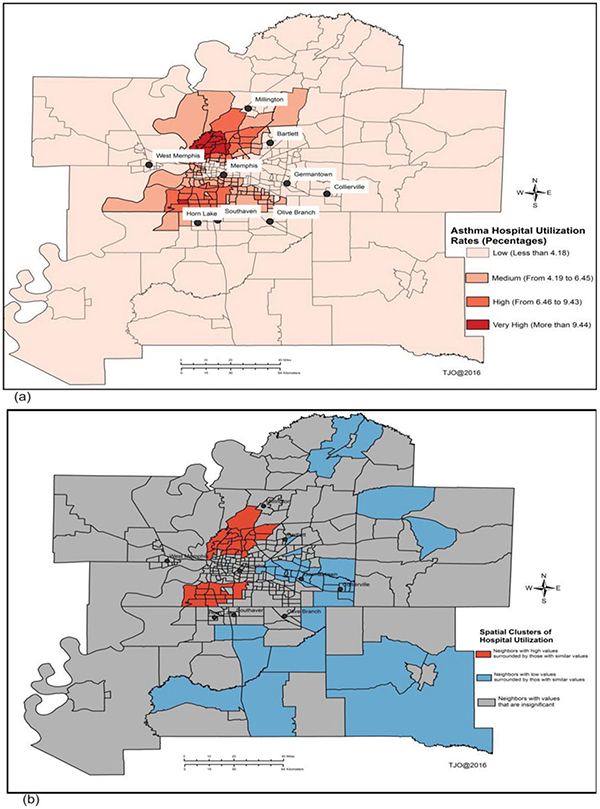
Figures 2–5 show temporal trends and spatial patterns of asthma utilization and inpatient hospitalization in the MMA region. Temporal trends in asthma ED and hospitalization rates show an upward trajectory from 4 per 1,000 children in 2005 (ED 2.8 and hospitalization 0.9) to 16 per 1,000 children in 2015 (ED 12.6 and hospitalization 1.7) (Figure 2). There was a significant temporal gradient in hospitalization visits from 2009 to 2013. The spatial and spatiotemporal clusters “hotspots” of childhood asthma derived using Local Moran’s I and Kulldorff’s retrospective space-time methods are presented in Figures 3b, 4b, and 5. Shelby County had the highest rates with ED visit rate 67.5 per 1,000 and hospitalization rate 10.0 per 1,000 children followed by Crittenden County with ED visit rate 57.8 per 1,000 and hospitalization rate 14.2 per 1,000; and then Desoto County with ED visit rate 26.7 per 1,000 and hospitalization rate 7.7 per 1,000. West Memphis situated in the Crittenden County had one of the highest asthma hospitalization rates. In the south and north of Memphis city, Shelby County, the rates were 106 per 1,000 children and 113 per 1,000 children, respectively. In Figure 3a, “high” to “very high” asthma ED and hospitalization rates ranged from 13 to more than 17% and were situated south and north of Memphis city. Areas surrounding Moscow, Williston, West Memphis, Marion, Millington, and Tur-rell had a range from 9 to 13%. While “low” asthma ED and hospitalization rates of less than 9% were evident in most of the MMA region, especially in places like Senatobia, Hernando, Horn Lake, Germantown, Piperton, Lakeland, Gallaway, Gilt Edge, and Covington. A similar spatial pattern was evident in overall utilization rates as shown in Figure 4a with “very high” and “high” utilization rates noted in north and south of Memphis. Overall, spatial clusters of asthma ED and hospitalization were more pronounced after adjusting for pediatric population (Figures 3b and 4b) compared to unadjusted estimates (Figures 3a and 4a).
Figure 5.
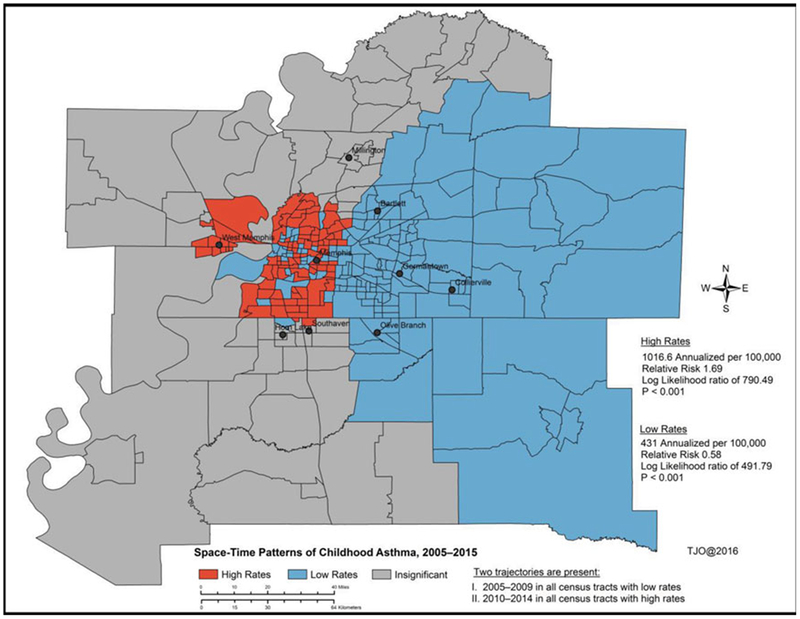
Spatiotemporal clusters “hotspots” of childhood of asthma ED and hospitalization rates between 2005 and 2015 using Kulldorff’s retrospective space-time discrete Poisson model.
Figure 3.
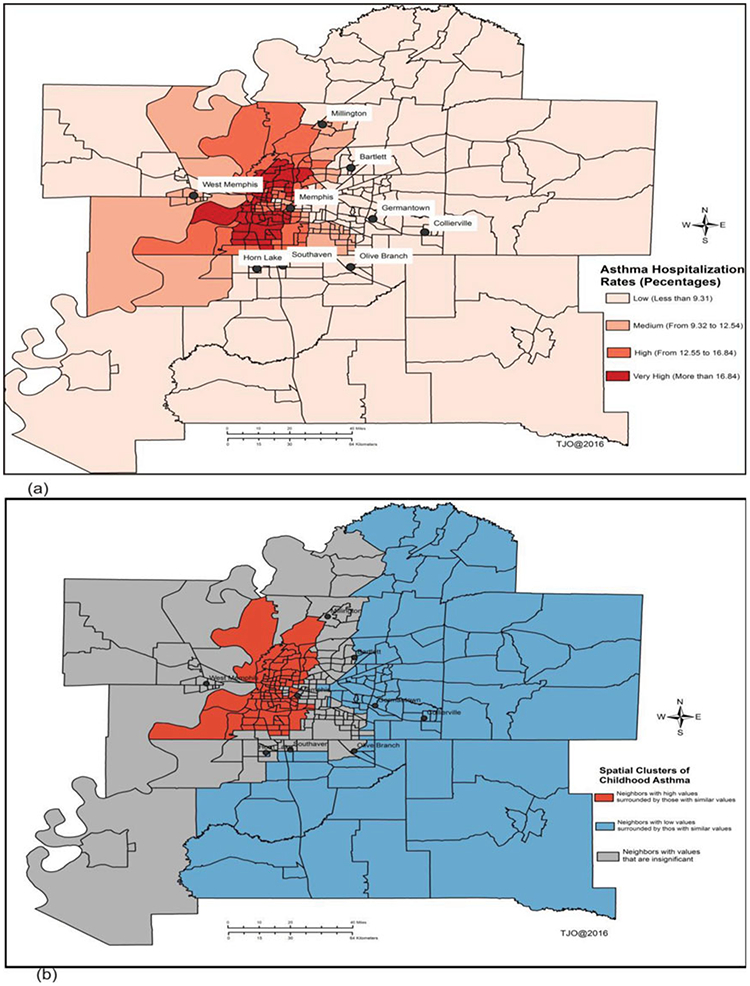
Spatial patterns of asthma ED and hospitalization rates adjusted by total population of children (18 years or younger). (a) Spatial distribution of asthma-adjusted hospitalization rates by children population, and (b) spatial clusters “Hotspots” of childhood asthma using Local Moran’s I method.
Figure 4.
Spatial patterns of asthma utilization rates using frequency of patient visits. (a) Spatial distribution of asthma-adjusted utilization rates by children population, and (b) spatial clusters “hotspots” of childhood asthma using Local Moran’s I method.
Figure 5 shows spatiotemporal clusters and statistical results of childhood asthma with age and race as covariates over an 11-year period. Thirty percent of the census tracts in the spatiotemporal model had annualized high rates of asthma ED and hospitalization of 1016.6 per 100,000 children (relative risk 1.69, log likelihood 790.49, p < 0.0001) while 51 percent of them had annualized low rates of asthma ED and hospitalization of 431 per 100,000 children (relative risk 0.58, log likelihood 491.79, p < 0.0001). The ED and hospitalization rates in the remaining 20 percent of the census tracts were found to be insignificant. The main areas of concern were identified in the south, west, portions of downtown, and north of Memphis city after adjusting for key covariates. Two statistically significant trajectories of asthma ED and hospitalization outcomes were identified during the spatiotemporal modeling process (Figure 2). The first one was observed between 2005 and 2009 in all the census tracts with low rates; and the second one was observed between 2010 and 2014 in all census tracts with high rates.
Discussion
There are four key findings from this study: first, evidence of distinctive spatiotemporal patterns of asthma ED visits and inpatient hospitalizations among children residing in the MMA region, and the disease burden is more heightened in the south, west, some portions of downtown, and north of Memphis city compared with other areas. Second, there is evidence of strong racial disparities and diversity in asthma hospitalization and utilization rates, specifically in asthma encounters, ED hospital visits and admission, and severity (defined by LOS data). Third, census tract-level predictive measures of childhood asthma independent of age and race offer new insights into spatiotemporal patterns. Fourth, age, race, frequency of visits, encounter type, insurance, and admit source were significant risk factors for childhood asthma in this study region. The findings in this study are consistent with previous studies [23–42].
There were statistically significant spatiotemporal patterns of asthma ED and hospitalization cases independent of race and age among children residing in the MMA region. Simply put, the spatiotemporal distribution of ED and hospitalization rates was non-homogenous in this region. Also, two statistically significant trajectories were present in the final spatiotemporal model; first one was between 2005 and 2009 in all census tracts with low rates and the second one was between 2010 and 2014 in all census tracts with high rates. These findings confirm that geography was a key explanatory variable in the distribution patterns of childhood asthma in the MMA region. Specifically, we observed a large asthma burden among children living in residential areas located in south, west, parts of downtown, and north of Memphis. Even though MMA in general is an underserved area with disparities related to multiple burdens of chronic disease conditions, the prevalence of chronic childhood asthma is much more concentrated particularly in the north and south of MMA, in part because of a high concentration of industrial facilities and on-road mobile emission sources.
The total estimated cost for asthma-specific healthcare events and resource utilization for the entire study population was slightly over $19 million; of which a bigger portion was spent on the areas burdened with asthma disease. An in-depth comparison between risk factors in areas with higher than expected childhood asthma rates and with those areas of lower than expected rates provided further evidence of asthma burden. Areas with higher than expected asthma rates have been predominately populated by AA communities of low SES and low level of education. They experience an unhealthy living environment in terms of high crime rates, overcrowding and poor housing conditions, and other stressful environmental conditions. These include the existence of combustion-related air pollutants in ambient air from industrial sources, and emissions from heavy-duty diesel trucks, buses and other vehicles, and Superfund sites [44]. Given the fact that previous studies have shown there are significant geographic differences in the distribution patterns of asthma [20,25–29,32–39], we can use the new knowledge from this study together with current asthma-environmental exposure literature to further evaluate the identified high-risk asthma communities. This knowledge lays groundwork for future studies to study environmental exposure influences on asthma development.
Our findings of racial differences in asthma healthcare utilization follow state and nationwide trends, which was observed in several large studies [38–41]. Interestingly, the highest prevalence rates for whites and AAs in studies [4,9,11,40,41] were noted among the 5–17 age group, but our data showed the highest healthcare utilization in children aged less than five years. There is a similar preponderance of AA patients with higher asthma ED visits and asthma hospitalizations, as well as more severe asthma cases as shown with increased LOS. This may be a function of evidence of poorly controlled asthma in AA children, which then translates into more frequent ED visits, need for hospital stay, and increased duration of stay. Alternatively, frequent ED visits in this population may serve as a marker of need for better education regarding asthma. This creates a need for more targeted asthma programs for this population.
The known risk factors for children include living in an urban area, race, and SES. Though we do not address all the known risk factors in this study, indoor and outdoor environmental triggers play a role in increasing asthma risk. Race has been shown to be a confounder for asthma risk among the inhabitants living in impoverished inner-city areas, who are disproportionately AAs [38–42]. Demographically, we found a high number of the AA children living in identified hotspots. Our study shows a diverse and persistent race effect in the adjusted rates. The possible explanations for diversity in asthma ED and hospitalization cases include living/school distance from major routes of transportation, industrial areas, and/or poor housing quality [31–39]. Hotspots in this study may be attributable to any of these risk factors. High-risk case patients were spatiotemporally clustered in close proximity to air-polluting/exposure sites. Potential exposures in the MMA region include Superfund sites, diesel-releasing sources on the busily traveled major roadways, indoor allergens, and other U.S. Environmental Protection Agency (EPA)-designated toxic locations [44]. Most of the exposure sites are situated in the south and north of Memphis where rates exceeded 106 per 1,000 children. Socioeconomic disadvantages may also contribute to the observed spatial diversity—health disparities result in higher asthma prevalence [38–43].
There are a few limitations to this study that must be recognized because no spatiotemporal model is prefect. First, childhood asthma measures were derived from a single hospital system, so we may not have captured all the cases from other hospitals or healthcare facilities in the MMA region. However, the MLH system serves 42% of region’s health market share [45]. Second, there are concerns related to temporal misalignment, asthma severity, and underestimation of asthma-specific healthcare costs. For example, a much detailed study among children with multiple encounters is needed (i.e. the high-risk asthma groups with at least 5 or more visits in a year). Third, large census tracts may hide the differences within areas; and a small numbers problem in the numerator and denominator may exist for a few observational units. In the future, as more accurate and complete asthma discharge data for the MMA region become readily available, these data will be used to refine our spatiotemporal models.
Conclusions and implications
The causes of childhood asthma-related morbidities and mortalities are numerous and include a broad array of factors from across multiple genetic and environmental domains. However, our findings show a significant temporal gradient in ED utilization and hospitalization visits from 2009 to 2013; and an upward trajectory from 4 per 1,000 children in 2005 to 16 per 1,000 children in 2015. The spatiotemporal distribution of ED and hospitalization rates is non-homogenous in the MMA region. Age, race, frequency of visits, encounter type, insurance, and admit source were significant risk factors for childhood asthma in this region. It is noteworthy that we observed higher odds exists for a patient living in a high-risk area than a patient living in low-risk area, especially for the minority population compared to white population. The census tract-level predictive measures of childhood asthma independent of age and race offer new insights into spatiotemporal patterns. These findings provide a strong basis for developing geographically tailored population health interventions and strategies at the neighborhood level for young children with chronic respiratory conditions.
Future directions
This study identified high- and low-risk areas for ED and hospitalizations for asthma in relation to geographical location. The knowledge obtained from this study allows for the deployment of available respiratory health services to areas of greatest need and for the development of educational interventions to target identified high-risk areas. Future research is needed to identify the environmental risk factors responsible for the elevated ED and hospitalizations for asthma in order to prevent and/or reduce exposures.
Acknowledgements
The authors are very grateful to staff and faculty of their respective departments and institutions.
Funding
Funding support for this work from the National Science Foundation and University of Tennessee Health Science Center (#0855221) is also deeply appreciated.
Footnotes
Declaration of interest
The authors report no conflicts of interest. The authors alone are responsible for the content and writing of the paper.
Color versions of one or more of the figures in the article can be found online at www.tandfonline.com/ijas.
References
- 1.Akinbami LJ, Sullivan SD, Campbell JD, Grundmeier RW, Hartert TV, Lee TA, et al. Asthma outcomes: healthcare utilization and costs. J Allergy Clin Immunol 2012;129(3 Suppl):S49–S64. [DOI] [PMC free article] [PubMed] [Google Scholar]
- 2.Szefler SJ, Chmiel JF, Fitzpatrick AM, Giacoia G, Green TP, Jackson DJ, et al. Asthma across the ages: knowledge gaps in childhood asthma. J Allergy Clin Immunol 2014;133(1):3–13. [DOI] [PMC free article] [PubMed] [Google Scholar]
- 3.American Lung Association. Trends in asthma morbidity and mortality. Epidemiology and statistics unit research and health education division, September 2012. Available from http://www.lung.org/assets/documents/research/asthma-trend-report.pdf.
- 4.Centers for Disease Control and Prevention. National Health Interview Survey (NHIS) data: 2011 lifetime and current asthma. Atlanta, GA: US Department of Health and Human Services, CDC; 2012. Available from http://www.cdc.gov/asthma/nhis/2011/data.htm. [Google Scholar]
- 5.Neuman MI, Alpern ER, Hall M, Kharbanda AB, Samir SS, Freedman SB, et al. Characteristics of recurrent utilization in pediatric emergency departments. Pediatrics 2014;134(4):e1025–e1031. doi: 10.1542/peds.2014-1362 [DOI] [PubMed] [Google Scholar]
- 6.Akinbami LJ, Moorman JE, Bailey C, Zahran HS, King M, Johnson CA, et al. Trends in asthma prevalence, health care use, and mortality in the United States, 2001–2010 NCHS data brief, no 94. Hyattsville, MD: National Center for Health Statistics; 2012. [PubMed] [Google Scholar]
- 7.Kimes D, Levine E, Timmins S, Weiss SR, Bollinger ME, Blaisdel C. Temporal dynamics of emergency department and hospital admissions of pediatric asthmatics. Environ Res 2004;94:7–17. [DOI] [PubMed] [Google Scholar]
- 8.Centers for Disease Control and Prevention. National Center for Health Statistics. Unpublished data from annual National Hospital Discharge Survey data files, 2000 and 2010. Available from https://www.cdc.gov/nchs/nhds/.
- 9.Murphy SL, Xu JQ, Kochanek KD. Deaths: preliminary data for 2010 National vital statistics reports; vol 60 no 4 Hyattsville, MD: National Center for Health Statistics; 2012. http://www.cdc.gov/asthma/most_recent_data.htm. [Google Scholar]
- 10.Smith DH, Malone DC, Lawson KA, Okamoto LJ, Battista C, Saunders WB. A national estimate of the economic costs of asthma. Am J Respir Crit Care Med 1997;156:787–793. [DOI] [PubMed] [Google Scholar]
- 11.Akinbami LJ, Moorman JE, Liu X. Asthma prevalence, health care use, and mortality: United States, 2005–2009. National Health Statistics Reports Number 32; 2011. Available from https://www.cdc.gov/nchs/data/nhsr/nhsr032.pdf. [PubMed]
- 12.Jones L, Bauer A, Li Y, Croom F. The burden of asthma in Tennessee: 2001–2010. Nashville, TN: Tennessee Department of Health; 2012; Available from https://tn.gov/assets/entities/health/attachments/Burd-enofAsthma2001-2010.pdf. [Google Scholar]
- 13.Tennessee Department of Health, Office of Policy, Planning and Assessment. Childhood asthma in Tennessee, 1997–2007. Nashville, TN; 2009. [Google Scholar]
- 14.Kakoti G, Dewan H. Childhood asthma in Tennessee, 2003–2012. Nashville, TN: Division of Policy, Planning & Assessment, Tennessee Department of Health; 2015. [Google Scholar]
- 15.Asthma and Allergy Foundation of America 2015. Asthma Capitals Press Release. Available from http://www.aafa.org/media/Asthma-Capitals-2015-Press-Release.pdf.
- 16.Asthma and Allergy Foundation of America 2009. Asthma Capitals Press Release. Available from http://www.azasthma.org/Common/Files/2009ACPublicList.PDF.
- 17.Tennessee Department of Health, Division of Planning and Assessment. Hospital Discharge Data System. Nashville, TN; 2013. [Google Scholar]
- 18.Mississippi State Department of Health (MSDH), Office of Health Data and Research. The burden of asthma in Mississippi: 2009 Asthma Surveillance Summary Report. Available from http://msdh.ms.gov/msdhsite/_static/resources/3347.pdf.
- 19.Arkansas Department of Health. The burden of asthma in Arkansas, 2010. Available from http://www.healthy.arkan-sas.gov/programsServices/healthStatistics/Brfss/Documents/publications/Asthma/AsthmaBurdenReport2010.pdf.
- 20.Crighton EJ, Jing F, Gershon A, Guan J, To T. A spatial analysis of asthma prevalence in Ontario. Can J Public Health 2012;103(5):384–389. [DOI] [PMC free article] [PubMed] [Google Scholar]
- 21.Roberts EM, English PB, Wong M, Wolff C, Valdez S, Van den Eeden SK, et al. Progress in pediatric asthma surveillance II: geospatial patterns of asthma in Alameda County, California. Prevent Chronic Dis 2006;3(3):A92 Available from: URL: http://www.cdc.gov/pcd/issues/2006/jul/05_0187.htm. [PMC free article] [PubMed] [Google Scholar]
- 22.Garcia E, Serban N, Swann J, Fitzpatrick A. The effect of geographic access on severe health outcomes for pediatric asthma. J Allergy Clin Immunol 2015;136(3):610–618. [DOI] [PubMed] [Google Scholar]
- 23.Crighton EJ, Ragetlie R, Luo J, To T, Gershon A. 2015. A spatial analysis of COPD prevalence, incidence, mortality and health service use in Ontario. Health Rep 2015;26(3):10–18. [PubMed] [Google Scholar]
- 24.Aschan-Leygonie C, Baudet-Michel S, Mathian H, Sanders L. Respiratory health inequalities between cities: a geographical approach. Environ Risques Sante 2013;12(2):118–128. [Google Scholar]
- 25.Chien L, Alamgir H. Geographic disparities of asthma prevalence in south-western United States of America. Geospat Health 2014;9(1):97–108. [DOI] [PubMed] [Google Scholar]
- 26.Girardi P, Marcon A, Rava M, Pironi V, Ricci P, de Marco R. 2012. Spatial analysis of binary health indicators with local smoothing techniques The Viadana study. Sci Total Environ 2012;414:380–386. [DOI] [PubMed] [Google Scholar]
- 27.Erlih S, Erzen I. Assessment of geographical patterns of chronic respiratory diseases in children of Koper municipality. Zdravstveno Varstvo 2010;49(1):19–27. [Google Scholar]
- 28.Williams DR, Sternthal M, Wright RJ. Social determinants: taking the social context of asthma seriously. Pediatrics 2009;123:S174–S184. [DOI] [PMC free article] [PubMed] [Google Scholar]
- 29.Yiannakoulias N, Schopflocher DP, Svenson LW. Using administrative data to understand the geography of case ascertainment. Chronic Dis Can 2009;30(1):20–28. [PubMed] [Google Scholar]
- 30.Martin D, Wright JA. Disease prevalence in the English population: a comparison of primary care registers and prevalence models. Soc Sci Med 2009;68(2):266–274. [DOI] [PubMed] [Google Scholar]
- 31.Shankardass K, McConnell RS, Milam J, Berhane K, Tatalovich Z, Wilson JP, et al. The association between contextual socioeconomic factors and prevalent asthma in a cohort of Southern California school children. Soc Sci Med 2007;65(8):1792–1806. [DOI] [PMC free article] [PubMed] [Google Scholar]
- 32.Oyana TJ, Rivers PA. Geographic variations of childhood asthma hospitalization and outpatient visits and proximity to ambient pollution sources at a U.S.-Canada border crossing. Int J Health Geogr 2005;4(1):14. [DOI] [PMC free article] [PubMed] [Google Scholar]
- 33.Lwebuga-Mukasa JS, Oyana TJ, Johnson C. Local ecological factors, ultrafine particulate concentrations, and asthma prevalence rates in Buffalo neighborhoods, New York. J Asthma 2005;42(5):337–348. [DOI] [PubMed] [Google Scholar]
- 34.Lwebuga-Mukasa JS, Oyana TJ, Thenappan A, Ayirookuzhi SJ. Association between volume and healthcare utilization for asthma among residents at a U.S.–Canada border crossing point. J Asthma 2004;41(3):289–304. [DOI] [PubMed] [Google Scholar]
- 35.Oyana TJ, Lwebuga-Mukasa JS. Spatial relationships among asthma prevalence, healthcare utilization, and pollution sources in Buffalo neighborhoods, New York State. J Environ Health 2004;66(8):25–38. [PubMed] [Google Scholar]
- 36.Oyana TJ, Rogerson P, Lwebuga-Mukasa JS. Geographic clustering of adult asthma hospitalization and residential exposure to pollution sites in Buffalo neighborhoods at a U.S.–Canada Border Crossing Point. Am J Public Health 2004;94(7):1250–1257. [DOI] [PMC free article] [PubMed] [Google Scholar]
- 37.Lwebuga-Mukasa JS, Oyana TJ, Wydro P. Risk factors influencing asthma prevalence and chronic respiratory illnesses among residents of different neighborhoods in Buffalo, New York. J Epidemiol Commun Health 2004;58:951–957. [DOI] [PMC free article] [PubMed] [Google Scholar]
- 38.Pearlman DN, Zierler S, Meersman S, Kim HK, Viner-Brown SI, Caron C. Race disparities in childhood asthma: does where you live matter? J Natl Med Assoc 2006;98(2):239–247. [PMC free article] [PubMed] [Google Scholar]
- 39.Sarpong EM, Miller GE. Racial and ethnic differences in childhood asthma treatment in the United States. Health Serv Res 2013;48(6 Pt 1):2014–2036. doi: 10.1111/1475-6773.12077 [DOI] [PMC free article] [PubMed] [Google Scholar]
- 40.McDaniel M, Paxson C, Waldfogel J. Racial disparities in childhood asthma in the United States: evidence from the National Health Interview Survey, 1997–2003. Pediatrics 2006;117(5):e868–e877. doi: 10.1542/peds.2005-1721 [DOI] [PubMed] [Google Scholar]
- 41.Boudreaux ED, Emond SD, Clark S, Camargo CA. Race/ethnicity and asthma among children presenting to the Emergency Department: differences in disease severity and management. Pediatrics 2003;111(5):e615–e621. [DOI] [PubMed] [Google Scholar]
- 42.Andrew CA, Auinger P, Byrd RS, Weitzman M. Risk factors for pediatric asthma. Am J Respir Crit Care Med 2000;162(3):873–877. [DOI] [PubMed] [Google Scholar]
- 43.Wi CI, St Sauver JL, Jacobson DJ, Pendegraft RS, Lahr BD, Ryu E, et al. Ethnicity, socioeconomic status, and health disparities in a mixed rural-urban US Community-Olmsted County, Minnesota. Mayo Clin Proc 2016;91(5):612–622. doi: 10.1016/j.mayocp.2016.02.011 [DOI] [PMC free article] [PubMed] [Google Scholar]
- 44.Jia C, Foran J. Air toxic concentrations, source identification, and health risks: an air pollution hot spot in southwest Memphis, TN. Atmos Environ 2013;81:112–116. [Google Scholar]
- 45.The Commercial Appeal, Memphis. Local hospitals face industry challenges. http://www.commercialappeal.com/business/local-hospitals-face-industry-challenges-ep-583889337-323613821.html [Last Accessed on May 12, 2016].
- 46.Kulldorff M, Huang L, Konty K. A scan statistic for continuous data based on the normal probability model. Int J Health Geogr 2009;8:58 Epub 2009/10/22. doi: 10.1186/1476-072X-8-58 [DOI] [PMC free article] [PubMed] [Google Scholar]
- 47.Kulldorff M. A spatial scan statistic. Commun Stat-Theory Methods 1997;26(6):1481–1496. doi: 10.1080/03610929708831995 [DOI] [Google Scholar]
- 48.Kulldorff M, Huang L, Pickle L, Duczmal L. An elliptic spatial scan statistic. StatMed 2006;25(22):3929–3943. doi: 10.1002/Sim.2490 [DOI] [PubMed] [Google Scholar]
- 49.Dai D, Oyana TJ. Spatial variations in the incidence of breast cancer and potential risks associated with soil dioxin contamination in Midland, Saginaw, and Bay Counties, Michigan, USA. Environ Health 2008;7:49. doi: 10.1186/1476-069x-7-49 [DOI] [PMC free article] [PubMed] [Google Scholar]