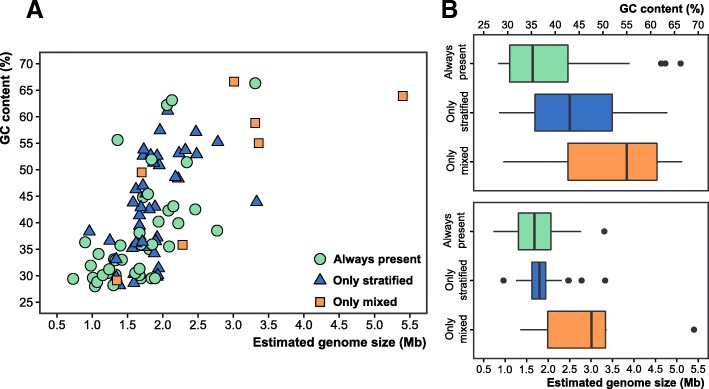
Fig. 3.
a Two-dimensional plot comparing GC content and genome size (estimated by CheckM, see the “Methods” section) for all the reconstructed genomes that appear in Fig. 2. b Box plots of GC content (top) and genome size (bottom). Genomes are classified and colored depending on whether they appear always in the water column (green), only during stratification (blue), or only in winter during the mixing period (orange)

