

Abstract
Temporal lobe epilepsy (TLE) is characterized by debilitating, recurring seizures and an increased risk for cognitive deficits. Mossy cells (MCs) are key neurons in the hippocampal excitatory circuit, and the partial loss of MCs is a major hallmark of TLE. We investigated how MCs contribute to spontaneous ictal activity and to spatial contextual memory in a mouse model of TLE with hippocampal sclerosis, using a combination of optogenetic, electrophysiological, and behavioral approaches. In chronically epileptic mice, real-time optogenetic modulation of MCs during spontaneous hippocampal seizures controlled the progression of activity from an electrographic to convulsive seizure. Decreased MC activity is sufficient to impede encoding of spatial context, recapitulating observed cognitive deficits in chronically epileptic mice.
Temporal lobe epilepsy (TLE) is characterized by spontaneous seizures and an increased risk for cognitive impairments; it is the most common form of epilepsy in adults. Anti-epileptic drugs are ineffective in one-third of patients (1), indicating the need for a more complete understanding of the mechanisms underlying seizure activity and comorbid cognitive deficits. Mossy cells (MCs) are a glutamatergic cell population in the hilus of the dentate gyrus (DG) of the hippocampus, and their partial loss is a major hallmark of TLE (2). However, the implications of MC loss on seizure dynamics and TLE comorbidities remain poorly understood (3). MCs drive both network excitation through their direct granule cell (GC) connections and network inhibition via their synapses onto inter-neurons (INs), but it remains unclear which of these projections dominate, particularly during seizures (4, 5). We used electrophysiological recordings, closed-loop optogenetics, and behavioral tests to investigate the functional role of MCs in seizure dynamics and cognition.
To modulate MC activity, we expressed the inhibitory archaerhodopsin (ArchT) or the excitatory channelrhodopsin (ChR2) selectively in MCs in mice. For ArchT expression, we topologically targeted MCs using the wheat germ agglutinin (WGA)–Cre system (Fig. 1, A to C, and fig. S1) (6). For MC excitation, we injected a virus for ChR2 expression into the hilus of Crlr-Cre mice (Fig. 1, E and F) (7). For both strategies, opsin expression was highly specific for MCs (Fig. 1H) (4). We verified that the opsins responded appropriately to light (Fig. 1, D and G) and that MC functional properties were similar in mice with or without opsin expression (table S1).
Fig. 1. Selective optogenetic control of DG MCs.
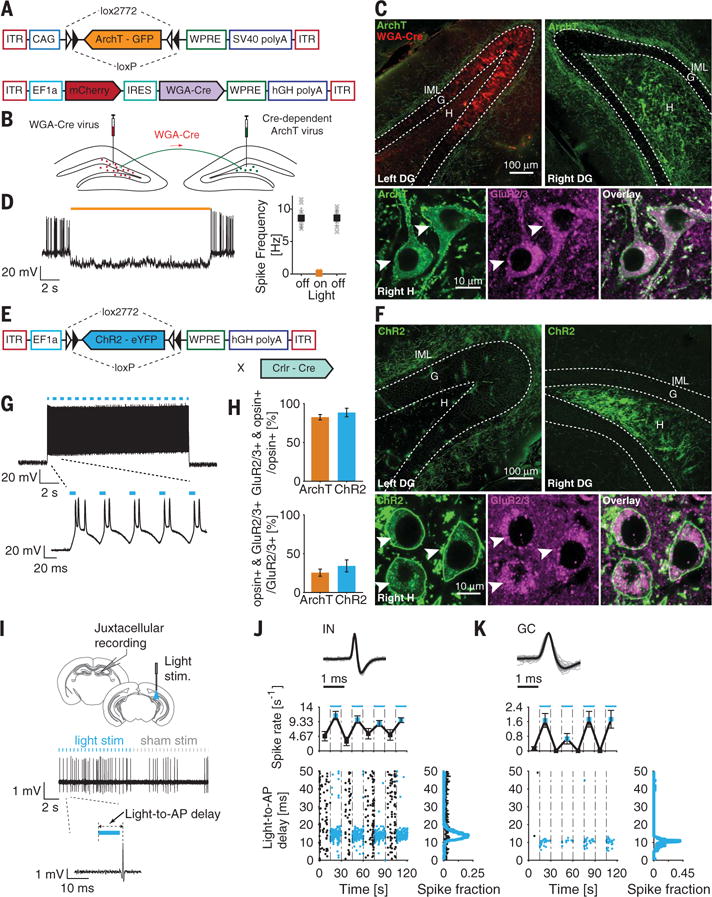
(A) ArchT expression system. (B) Topological targeting of MCs with a WGA-Cre fusion protein expressed in the left DG (red) that is transsynaptically and retrogradely trafficked by neurons with projections at the injection site. WGA-Cre activates ArchT expression in the right DG MCs (green). (C) (Top) Confocal images of WGA-Cre and ArchT expression. (Bottom) High-magnification images of the right hilus. ArchT-expressing MCs are identified via green fluorescent protein expression and GluR2/3+ immunostaining (arrowheads). (D) Illumination (15 s of 589-nm light) blocks current-induced spiking in ArchT-expressing MCs, quantified on the right (N = 10 recordings; n = 3 mice). (E) ChR2 expression system. (F) (Top) Confocal images of ChR2 expression. (Bottom) High-magnification images of the right hilus. ChR2-expressing MCs are identified via eYFP expression and GluR2/3+ immunostaining (arrowheads). (G) Illumination (473 nm, 15 s of a 20-Hz train of 10-ms pulses) induces ChR2-expressing MC firing (N = 5 recordings; n = 3 mice). (H) (Top) Opsin expression specificity (N = 103|24 slices; n = 3|5 mice for ArchT+|ChR2+). ArchT+ neurons were labeled using the WGA-Cre system, and ChR2+ neurons were labeled using the Crlr-Cre transgenic mouse system. (Bottom) Extent of opsin expression (N = 20|18 slices; n = 3|3 mice for ArchT+|ChR2+). (I to K) In vivo juxtacellular recordings of DG cells in MC ChR2-expressing mice. (I) (Top) Experimental schematic. (Bottom) Single-unit activity of an IN. [(J) and (K)] Neuronal activity of an IN (J) and a GC (K) in response to MC stimulation. (Top) Normalized spike (gray lines) and unit average (black line) waveforms. (Middle) Firing rate during alternating light-off (black) and light-on (blue) epochs. (Bottom) Scatter plot (left) and distribution plot (right) of the delay between the AP and the onset of the laser (blue) or sham pulse (black). All data are presented as mean ± SEM. G, granule cell layer; H, hilus; IML, inner molecular layer; AP, action potential.
To characterize the effect of MC optogenetic manipulation on DG activity, we performed in vivo juxtacellular recordings of individual DG neurons (Fig. 1I). MC activation modulated IN and GC firing (Fig. 1, J and K; figs. S2 to S7; and table S2), consistent with known MC network connectivity (3). We also found that MC photo-stimulation in the ventral hippocampus elicited a response in INs and GCs recorded in the dorsal hippocampus, confirming the ability of MCs to modulate network activity distally (figs. S2 and S3) (3).
We first tested how MC activity affects spontaneous electrographic, nonconvulsive seizures in a well-established model of TLE with kainic acid (KA) injected unilaterally into the left dorsal hippocampus (8, 9). We used a closed-loop seizure detection and intervention method in chronically epileptic mice (10) to deliver a 15-s light pulse at the onset of 50% of detected seizures (Fig. 2, A and B). Which seizures received light was decided randomly, and the remaining 50% of seizures received no light (sham pulse), allowing seizures with and without optogenetic perturbation to be directly compared within each animal. For MC inhibition, we delivered light to both hemispheres to target MC somata and their projections (fig. S8), confirming beforehand that illumination of ArchT-expressing MC axon terminals reduces the amplitude of synaptically evoked excitatory postsynaptic currents in GCs (fig. S9). MC inhibition and light delivery to opsin-negative controls had no effect on electrographic seizure dynamics (Fig. 2, C and D; fig. S10; and table S3). We next examined whether optogenetic MC excitation alters electrographic seizures. To excite MCs, we delivered light to the hemisphere contralateral to the KA injection site. We found that MC activation in the dorsal hippocampus, which is directly contralateral to the KA injection site, but not MC excitation in the ventral hippocampus, reduced electrographic seizure duration (Fig. 2, E and F). This location-dependent effect is consistent with the spatial distribution of dorsal MC contralateral projections, which are denser at the septotemporal level of the parent MC soma (3), such that dorsal stimulation can better target cells with projections directly onto the hippocampal lamella containing the focal seizure site. Although MC stimulation in the dorsal DG is capable of controlling electrographic seizures, the effect is much weaker than with inhibition of GCs (fig. S11A and table S3), the only other excitatory cell population in the DG (11).
Fig. 2. Modulation of MC activity on electrographic seizure dynamics.
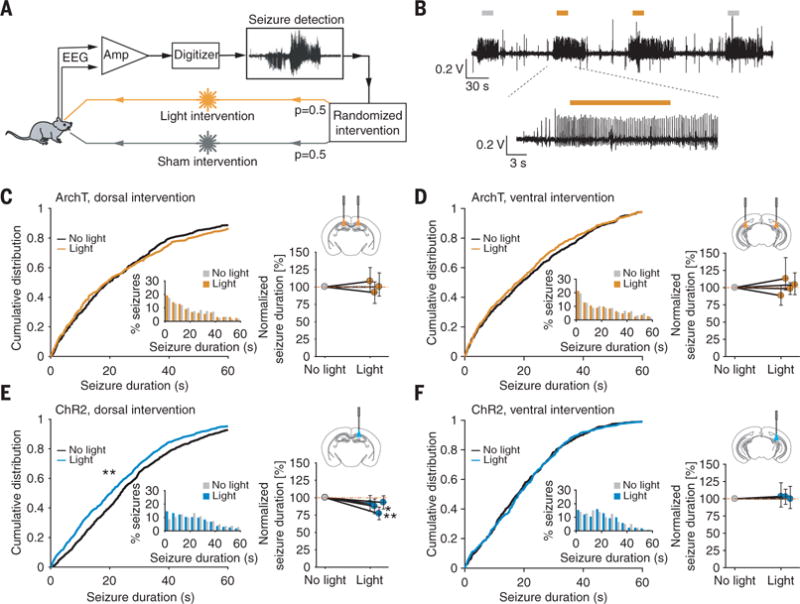
(A) Closed-loop approach for in vivo real-time detection and optogenetic intervention of spontaneous seizures in epileptic mice. (B) Electrographic seizures, where no light (gray bar) or light (orange bar) is delivered upon seizure detection. (C to F) Light delivery to the dorsal or ventral DG of ArchT-expressing mice [(C) and (D)] and to the dorsal or ventral DG of ChR2-expressing mice [(E) and (F)]. (Left) Cumulative distribution and probability density (inset) of the seizure duration after the start of light or no-light delivery (N = 917|1194|2161|903 seizures, n = 3|4|4|3 animals for ArchT dorsal|ArchT ventral|ChR2 dorsal| ChR2 ventral). (Right) Normalized difference in seizure duration ± 95% confidence interval (CI) (*P < 0.05; **P < 0.01; Mann-Whitney U test).
A characteristic feature of MCs is their extensive projections connecting multiple lamellae and both hippocampi (12). This property could endow MCs with the capability to influence seizure generalization. A prediction is that MC perturbation during electrographic seizures may be sufficient to alter the progression into more severe, widespread seizures (fig. S12) exhibiting behavioral manifestations [e.g., rearing or tonic-clonic activity, Racine scale 4 to 5 (13)].
We tested this hypothesis by focusing on the seizures that began as electrographic seizures, then evolved into convulsive seizures, and quantified the proportion of such seizures that occurred after MC inhibition (Fig. 3). Because these seizures are much rarer than the electrographic-only seizures (8), animals were recorded for ~1 to 6 months (fig. S13) to accumulate a number of electrographic-to-convulsive seizures sufficient for statistical analysis. MC inhibition during the electrographic stage significantly increased the probability of seizure generalization into overt behavioral seizures (Fig. 3, C and D). Behavioral seizures were similar in duration with or without light (Fig. 3E), indicating that MC inhibition does not alter ictal activity once it has generalized. Rather, MCs affect solely the transition between electrographic and behavioral seizures. These effects were not due to a sampling bias or light artifact, as seizure frequency was not changed when we inhibited MCs after the end of the convulsive seizures (fig. S14) or when we delivered light in opsin-negative controls (Fig. 3, C and D). The effects were not influenced by the circadian rhythm as MC modulation similarly affected seizure frequency during the daytime and nighttime (fig. S13).
Fig. 3. MC optogenetic modulation during spontaneous seizures controls the progression of electrographic seizures into convulsive seizures.
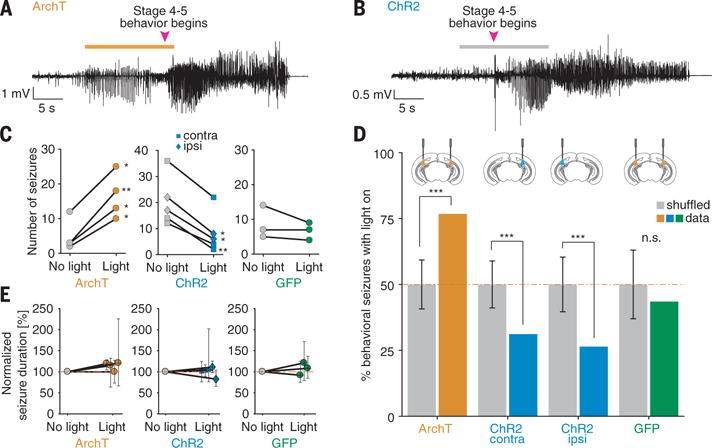
(A and B) Electroencephalogram recordings of electrographic-to-convulsive seizures in (A) an ArchT- and (B) a ChR2-expressing mouse with light (orange bar) or no light (gray bar) delivery after seizure detection. (C) MC photoinhibition increases (left), MC photostimulation reduces (middle), and light delivery to opsin-negative controls does not affect (right) the occurrence of convulsive seizures. *P < 0.05; **P < 0.01; two-tailed binomial test. (D) Control of seizure progression by MC modulation. Data are shown as the fraction of convulsive seizures occurring after light delivery (colored bars) compared with the fraction one would observe under the null hypothesis that light delivery has no effect (gray bars; expected fraction ± 95% CI). n.s., P > 0.05; **P < 0.01; ***P < 0.001; two-tailed binomial test. (E) MC activity modulation does not affect convulsive seizure duration. Data shown as normalized difference in seizure duration ± 95% CI (P > 0.05; Mann-Whitney U test). Contra, opsin expression contralateral to the KA injection site; ipsi, opsin expression ipsilateral to the KA injection site.
To determine whether convulsive seizures could be prevented by increasing MC activity, we next stimulated ChR2-expressing MCs at the onset of electrographic seizures. Exciting MCs prevented electrographic seizures from generalizing into behavioral seizures (Fig. 3, C and D). Because DG microcircuit alterations are different in the hemispheres ipsilateral and contralateral to the KA injection site (8, 9), we also targeted MCs ipsilateral to the KA injection site. We found that MC excitation in the ipsilateral hemisphere also prevented seizure generalization (Fig. 3, C and D), despite the greater degree of hippocampal sclerosis ipsilaterally, where we observed a 77% MC loss compared with a 55% MC loss contralaterally, consistent with previous studies (9) (fig. S15).
We next reasoned that to control convulsive seizures, MCs likely modulate activity downstream of the DG. Because the DG extrinsic projections arise from GCs (3), and GCs are MC postsynaptic targets (14), we examined whether direct GC modulation could control generalized seizures. We found that GC inhibition had no effect on convulsive seizure occurrence (fig. S11, B and C). Conversely, GC excitation robustly induced behavioral seizures (11). Together, our data demonstrate that MCs and GCs, the two excitatory populations in the DG, had antithetical effects on seizure dynamics and that surviving MCs have an anticonvulsive potential even after severe MC loss.
To investigate the consequences of MC loss on cognition, we examined learning and memory processes in chronically epileptic mice and in non-epileptic mice, where we inhibited MCs. We used two well-validated assays of spatial and object memory: the object location memory (OLM) and object recognition memory (ORM) tasks (15). Chronically epileptic mice had significant deficits in OLM compared with nonepileptic controls and were unable to distinguish the moved object from the unmoved object, as reflected in the low discrimination index (DI) (Fig. 4A and table S4). In contrast, ORM was not impaired in epileptic mice, and their DI was similar to that of nonepileptic mice (Fig. 4B). The OLM deficits are consistent with previous studies showing that repeated generalized seizures lead to decreased accuracy in spatial discrimination performance (16). The poor performance of epileptic mice was not due to disinterest, because both groups explored the objects at similar levels during training (fig. S16), or to increased anxiety, as assessed using the elevated plus maze test (EPM) (fig. S17).
Fig. 4. Chronically epileptic mice have impaired OLM but not ORM, and MC inhibition impairs learning but not retrieval of OLM.
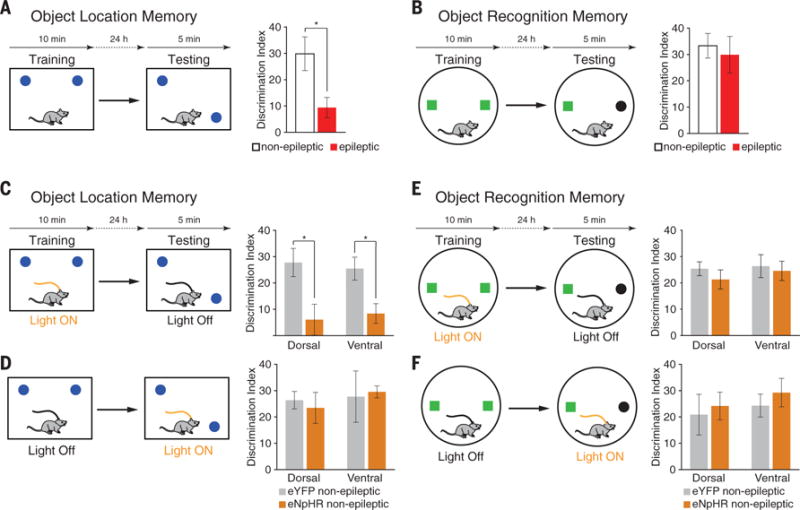
(A) OLM test schematic and timeline. Epileptic mice (n = 17) exhibit significantly impaired OLM, compared with nonepileptic controls (n = 13). (B) ORM test schematic and timeline. Nonepileptic (n = 10) and epileptic (n = 14) mice show no significant difference in ORM. (C) MC photoinhibition during learning interferes with OLM (dorsal: n = 9|10; ventral: n = 8|5 for eYFP|eNpHR). (D) MC photoinhibition during testing does not interfere with OLM (dorsal: n = 9|8; ventral: n = 6|7 for eYFP|eNpHR). (E and F) MC photoinhibition during ORM learning does not impair task performance (dorsal: n = 10|9; ventral: n = 9|10 for eYFP|eNpHR). (F) MC photoinhibition during ORM testing does not affect task performance (dorsal: n = 10|10; ventral: n = 7|9 for eYFP|eNpHR). Data are presented as mean ± SEM. *P < 0.05; two-tailed Welch’s t test.
To determine whether MC loss alone is sufficient to impair spatial cognitive abilities, we silenced MCs in nonepileptic mice during specific stages of OLM and ORM. This approach allowed us to examine how decreased MC activity affects cognition independently of other network reorganizations observed in epilepsy (17). Because ArchT has excitatory effects when illuminated for long periods (18), we switched to halorhodopsin (eNpHR) (fig. S18) for longer MC photoinhibition.
When MCs were inhibited in eNpHR mice solely during the learning phase of the OLM task, we observed a significant reduction in later performance during testing compared with enhanced yellow fluorescent protein (eYFP) controls (Fig. 4C and fig. S19). We ruled out the possibility that this impairment was related to an effect on anxiety by assessing mouse exploration in the EPM (fig. S17). The impairment was also not due to a lack of motivation for object exploration nor to an object side preference during training (fig. S20). Therefore, MC activity is necessary during spatial memory encoding. In contrast, silencing MCs during the testing phase of the OLM task did not impair performance, indicating that MC activity is not required during spatial memory retrieval (Fig. 4D). Finally, we assessed whether MCs are involved in nonspatial ORM. MC inhibition during learning or testing of ORM did not interfere with ORM task performance (Fig. 4, E and F). Together, these data show that MC inhibition in healthy mice during learning reduces their OLM task performance to a level similar to that observed in epileptic mice (Fig. 4, A and C). MC loss by itself, even partial, is sufficient to degrade cognitive abilities independently of other network changes in epilepsy (17).
In summary, selective MC inhibition allows for electrographic seizure generalization and precludes spatial memory encoding. These findings indicate that the MC loss often observed in TLE patients (2) is likely to be directly implicated in both seizures and comorbid cognitive deficits. Earlier studies have led to conflicting models for the role of MCs in hippocampal network dynamics. Widespread chronic MC deletion led to transient GC disinhibition (7), and stimulation of commissural fibers, including MC axons, inhibited GCs (19, 20), indicating that MCs may exert a primarily inhibitory effect on the network. Others reported a decrease in DG activity in slices after partial MC ablation (4) or an increase in perforant path– induced afterdischarges with MC optogenetic excitation (21), suggesting that MCs exert a net excitatory effect. Our study addresses how surviving MCs affect the dynamics of spontaneously occurring electrographic and convulsive seizures in TLE, a critical question from a clinical perspective. By leveraging closed-loop optogenetics, we established unambiguously that surviving MCs have a net inhibitory role on the hippocampal network and play a protective role in preventing spontaneous seizure progression.
The progression of electrographic seizures initially restricted to the hippocampus into convulsive seizures is characterized by a spread of hyperactivity to other brain regions (fig. S12). Because MCs project exclusively within the DG, and the main DG efferent projections are GC axons, it is likely that the MC anticonvulsive role involves the regulation of GC activity. We found, however, that neither GC stimulation nor inhibition could prevent convulsive seizure occurrence. Our data thus imply that the control of convulsive seizures requires coordinated modulation of spatially distributed downstream MC targets. MCs have widespread projections that contact more than 30,000 GCs and INs (3, 14). This property enables MCs to coordinate the activity of spatially distributed microcircuits and may be key in blocking runaway excitation. In contrast, GCs have strong, but lamellar, projections, restricted to a few hundred micrometers along the longitudinal axis. These dense projections likely underlie the ability of GC inhibition to shorten electrographic seizures (11) but may be too locally restricted to prevent seizure generalization.
Our learning and memory results are consistent with the emerging model that MCs have an important role in spatial memory encoding. MCs have multiple place fields and exhibit stronger place-field remapping than GCs in response to changes in environmental cues (22–24). We demonstrated that MCs are critical in encoding, but not in retrieval, of spatially relevant information. Because GCs have been implicated in learning contextually relevant information (25, 26), it is possible that MCs control information encoding by regulating GC excitability in separate lamellae through their widespread, divergent projections (7, 27). Our work suggests that strategies to limit MC loss or to directly excite surviving MCs may provide powerful treatment options for seizure control.
Supplementary Material
Acknowledgments
We thank K. Nakazawa and S. Jinde for their generous gift of the Crlr-Cre mice. We thank members of the Soltesz laboratory for useful discussions. We thank M. Oijala, J. Liang, A. Wong, J. Nguyen, J. Vargane, R. Zhu, C. Lozoya, L. Saw, and A. Olson for technical support. A.D.B. was supported by NIH National Institute of Neurological Disorders and Stroke F31NS086429 and the University of California Irvine Medical Scientist Training Program. I.S. was supported by NIH grants NS074702 and NS094668. This work was made possible, in part, by the Stanford Neuroscience Microscopy Service, supported by NIH NS069375.
Footnotes
We declare no conflicts of interest.
SUPPLEMENTARY MATERIALS
www.sciencemag.org/content/359/6377/787/suppl/DC1
All data are available in the supplementary materials. Custom Matlab scripts can be downloaded from the GitHub repository at https://gitlab.com/climouse/mossycells_paper_analysis.
Materials and Methods
References (28-31)
REFERENCES AND NOTES
- 1.Kwan P, Sander JW. J Neurol Neurosurg Psychiatry. 2004;75:1376–1381. doi: 10.1136/jnnp.2004.045690. [DOI] [PMC free article] [PubMed] [Google Scholar]
- 2.Blümcke I, et al. Epilepsia. 2000;41(suppl 6):S174–S180. doi: 10.1111/j.1528-1157.2000.tb01577.x. [DOI] [PubMed] [Google Scholar]
- 3.Scharfman HE. Nat Rev Neurosci. 2016;17:562–575. doi: 10.1038/nrn.2016.87. [DOI] [PMC free article] [PubMed] [Google Scholar]
- 4.Ratzliff A, Howard AL, Santhakumar V, Osapay I, Soltesz I. J Neurosci. 2004;24:2259–2269. doi: 10.1523/JNEUROSCI.5191-03.2004. [DOI] [PMC free article] [PubMed] [Google Scholar]
- 5.Sloviter RS, et al. J Comp Neurol. 2003;459:44–76. doi: 10.1002/cne.10630. [DOI] [PubMed] [Google Scholar]
- 6.Gradinaru V, et al. Cell. 2010;141:154–165. doi: 10.1016/j.cell.2010.02.037. [DOI] [PMC free article] [PubMed] [Google Scholar]
- 7.Jinde S, et al. Neuron. 2012;76:1189–1200. doi: 10.1016/j.neuron.2012.10.036. [DOI] [PMC free article] [PubMed] [Google Scholar]
- 8.Bragin A, Engel J, Jr, Wilson CL, Vizentin E, Mathern GW. Epilepsia. 1999;40:1210–1221. doi: 10.1111/j.1528-1157.1999.tb00849.x. [DOI] [PubMed] [Google Scholar]
- 9.Volz F, et al. Epilepsia. 2011;52:1579–1589. doi: 10.1111/j.1528-1167.2011.03086.x. [DOI] [PubMed] [Google Scholar]
- 10.Krook-Magnuson E, Armstrong C, Oijala M, Soltesz I. Nat Commun. 2013;4:1376. doi: 10.1038/ncomms2376. [DOI] [PMC free article] [PubMed] [Google Scholar]
- 11.Krook-Magnuson E, et al. J Physiol. 2015;593:2379–2388. doi: 10.1113/JP270056. [DOI] [PMC free article] [PubMed] [Google Scholar]
- 12.Buckmaster PS, Wenzel HJ, Kunkel DD, Schwartzkroin PA. J Comp Neurol. 1996;366:270–292. doi: 10.1002/(sici)1096-9861(19960304)366:2<270::aid-cne7>3.0.co;2-2. [DOI] [PubMed] [Google Scholar]
- 13.Racine RJ. Electroencephalogr Clin Neurophysiol. 1972;32:281–294. doi: 10.1016/0013-4694(72)90177-0. [DOI] [PubMed] [Google Scholar]
- 14.Dyhrfjeld-Johnsen J, et al. J Neurophysiol. 2007;97:1566–1587. doi: 10.1152/jn.00950.2006. [DOI] [PubMed] [Google Scholar]
- 15.Vogel-Ciernia A, et al. Nat Neurosci. 2013;16:552–561. doi: 10.1038/nn.3359. [DOI] [PMC free article] [PubMed] [Google Scholar]
- 16.Lin H, Holmes GL, Kubie JL, Muller RU. Hippocampus. 2009;19:817–827. doi: 10.1002/hipo.20565. [DOI] [PMC free article] [PubMed] [Google Scholar]
- 17.Houser CR. Brain Res. 1990;535:195–204. doi: 10.1016/0006-8993(90)91601-c. [DOI] [PubMed] [Google Scholar]
- 18.Mahn M, Prigge M, Ron S, Levy R, Yizhar O. Nat Neurosci. 2016;19:554–556. doi: 10.1038/nn.4266. [DOI] [PMC free article] [PubMed] [Google Scholar]
- 19.Buzsáki G, Eidelberg E. Brain Res. 1981;230:346–350. doi: 10.1016/0006-8993(81)90413-3. [DOI] [PubMed] [Google Scholar]
- 20.Hsu TT, Lee CT, Tai MH, Lien CC. Cereb Cortex. 2016;26:2715–2727. doi: 10.1093/cercor/bhv127. [DOI] [PubMed] [Google Scholar]
- 21.Sugaya Y, et al. Cell Reports. 2016;16:1405–1415. doi: 10.1016/j.celrep.2016.06.083. [DOI] [PubMed] [Google Scholar]
- 22.Senzai Y, Buzsáki G. Neuron. 2017;93:691–704.e5. doi: 10.1016/j.neuron.2016.12.011. [DOI] [PMC free article] [PubMed] [Google Scholar]
- 23.GoodSmith D, et al. Neuron. 2017;93:677–690.e5. doi: 10.1016/j.neuron.2016.12.026. [DOI] [PMC free article] [PubMed] [Google Scholar]
- 24.Danielson NB, et al. Neuron. 2017;93:552–559.e4. doi: 10.1016/j.neuron.2016.12.019. [DOI] [PMC free article] [PubMed] [Google Scholar]
- 25.Kheirbek MA, et al. Neuron. 2013;77:955–968. doi: 10.1016/j.neuron.2012.12.038. [DOI] [PMC free article] [PubMed] [Google Scholar]
- 26.Zhuo JM, et al. eLife. 2016;5:e22429. doi: 10.7554/eLife.22429. [DOI] [PMC free article] [PubMed] [Google Scholar]
- 27.Hyde RA, Strowbridge BW. Nat Neurosci. 2012;15:1430–1438. doi: 10.1038/nn.3208. [DOI] [PMC free article] [PubMed] [Google Scholar]
Associated Data
This section collects any data citations, data availability statements, or supplementary materials included in this article.