Abstract
The Electron Microscopy Data Bank (EMDB; http://emdb-empiar.org) is a global openly-accessible archive of biomolecular and cellular 3D reconstructions derived from electron microscopy (EM) data. EMBL-EBI develops web-based resources to facilitate the reuse of EMDB data. Here we provide protocols for how these resources can be used for searching EMDB, visualising EMDB structures, statistically analysing EMDB content and checking the validity of EMDB structures. Protocols for searching include quick link categories from the main page, links to latest entries released during the weekly cycle, filtered browsing of the entire archive and a form-based search. For visualisation, the ‘Volume Slicer’ enables slices of EMDB entries to be visualised interactively and in three orthogonal directions. The EMstats web service (https://emdb-empiar.org/emstats) provides up-to-date interactive statistical charts analysing EMDB. All EMDB entries have ‘visual analysis’ pages that provide basic validation information for the entry.
Keywords: Cryo-electron microscopy, electron tomography, single particle image processing, EMDB, structure, search, validation
Introduction
The Electron Microscopy Data Bank (EMDB; http://emdb-empiar.org) is a global openly-accessible archive of biomolecular and cellular 3D reconstructions derived from electron microscopy (EM) data (Ardan Patwardhan, 2017; A. Patwardhan & Lawson, 2016). It was established in 2002 at the European Bioinformatics Institute (EMBL-EBI; (Tagari, Newman, Chagoyen, Carazo, & Henrick, 2002)). EMDB contains structures determined by different sub-methodologies of EM including single-particle averaging, electron crystallography and electron tomography (ET). EMDB holdings range from high-resolution structures, where side-chain densities are resolved, to low-resolution reconstructions of cellular samples in which the distributions of macromolecules and macromolecular assemblies can be studied. EMDB is a unique international resource with overwhelming support from the EM community and the re-use of EMDB data represents a substantial multiplier on the initial research investment. EMBL-EBI develops web-based resources to facilitate the reuse of EMDB data. Here we demonstrate how these resources can be used for searching EMDB, visualising EMDB structures, statistically analysing EMDB content and checking the validity of EMDB structures. All web resources presented here require only a compatible browser and no additional software needs to be downloaded explicitly.
Protocols 1-4 are different options for searching EMDB (Gutmanas et al., 2014). Protocol 1 is the simplest to use for the casual user in that a user need only select a ‘quick link’ category to perform a search. Protocol 2 enables users to keep abreast of the latest developments by browsing through the entries released in the latest weekly release cycle. Protocol 3 enables users to browse the entire archive and progressively narrow down the results with the use of search filters and is suitable for both expert and non-expert users. Protocol 4 presents a form-based search with a range of administrative (e.g., authors and dates), sample and instrumentation search options and is more suitable for specialist users.
Protocol 5 demonstrates the use of the ‘volume slicer’ to interactively view individual orthogonal slices through an EMDB 3D reconstruction (Salavert-Torres et al., 2016). The interactive zooming capability of the volume slicer allows the user to both obtain a big-picture overview of the structure as well as to zoom in to examine it in minute detail.
The use of the EMstats web service is shown in Protocol 6 (Gutmanas et al., 2014). EMstats presents dynamic interactive charts based on the current state of the archive. These charts are useful for basic data mining purposes, for instance to view trends in instrument usage or improving resolution among EMDB entries.
Protocol 7 shows the use of the ‘visual analysis’ pages to perform a basic assessment of EMDB entries (Lagerstedt et al., 2013). The visual analysis pages present both image representations of the structures as well as various pre-calculated analytical charts.
Protocol 1: Quick Access Search
Introduction
This protocol describes how to search for common categories of entries in EMDB.
Necessary resources
Hardware
Any standard computer, tablet or smartphone with a reasonably fast connection to the Internet.
Software
We recommend the use of up-to-date versions of the most common browsers such as Chrome, Firefox and Safari.
Steps
Navigate to the EMDB home page www.emdb-empiar.org.
Select (left mouse click) one of the images under “Quick Access”, e.g., ‘Virus’ (Figure 1). The search results page is loaded, consisting of a top panel of filters that can be used to refine the search (Figure 2). The search results are shown below the filters.
-
Use filters to narrow down search, e.g. select ‘Single-particle’ and ‘Subtomogram averaging’ under ‘EM method’, ‘Homo sapiens’ and ‘Mus musculus’ under ‘Organism’, and ‘< 4A’ under ‘Resolution’, then press the ‘Update search results’ button to update the results. The filters can be scrolled horizontally to reveal more filters.
Footnote: More than one filter option can be selected from any one filter category. There are two numbers next to each filter option. The number on the left represents the number of entries with that filter option that satisfy the current selection of filter options and the number on the right represents the number of entries with that filter option that satisfy the original search, i.e., before any filter options were selected.
-
Examine the search results which are shown below the filter panel. There are different options to sort the search results including by release date and by resolution. Summary information about each EMDB entry satisfying the search criteria is shown with buttons and links to further information and resources.
Footnote: The “Entry summary” button and the EMDB accession code (e.g., EMD-3784) link out to the entry page which provides more detailed information about the entry. The “Visual analysis of the map” button links out to a page that provides basic sanity checking and validation information about the entry (see Basic Protocol 7). The “Volume slicer” button links out to viewer that allows the user to interactively view and move through the orthogonal slices of the 3D volume representing the EMDB entry (see Basic Protocol 5).
Figure 1.
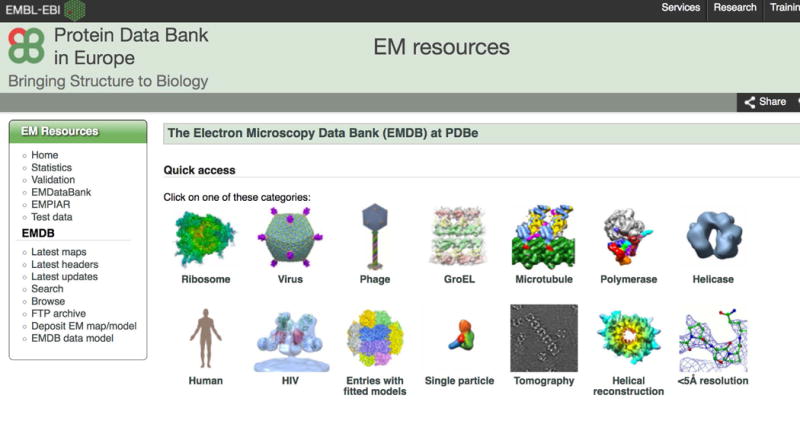
The “Quick access” images can be used to rapidly browse some of the major categories of entries in EMDB.
Figure 2.
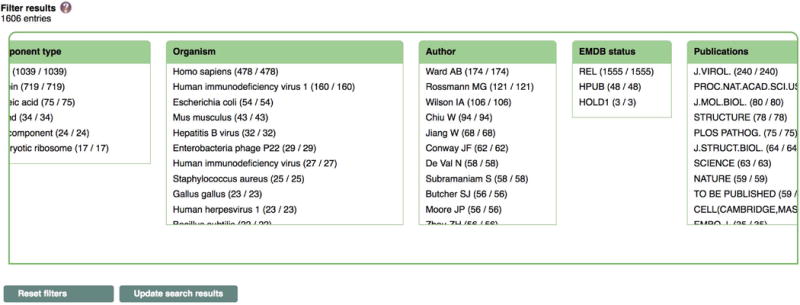
Search filters can be used to narrow down the search. The panel can be scrolled left to right to reveal more filters.
Protocol 2: Latest entries
Introduction
EMDB has a weekly release cycle and new entries are released every Wednesday at 00:00 UTC. This protocol describes how to view the entries released during the latest update. This functionality is particularly useful for domain experts who want to keep abreast of the latest results in the field.
Necessary resources
Hardware
Any standard computer, tablet or smartphone with a reasonably fast connection to the Internet.
Software
We recommend the use of up-to-date versions of the most common browsers such as Chrome, Firefox and Safari.
Steps
Navigate to the EMDB home page www.emdb-empiar.org.
-
Select “Latest maps” from the left menu to view the latest map releases (full EMDB entry releases), “Latest headers” to view the latest header releases (release of EMDB entry meta data but not the 3D volume) and “Latest update” to view entries that have been updated. Note that for header releases no image is shown, and for some entries (those deposited as a part of a map/model deposition where the model information was supressed) the meta-data is supressed (showing the dummy text ‘Suppressed’ to hide the actual information).
Footnote: The entries are shown on a search results page similar to the one described in Basic Protocol 1 and the functionality of the page is described in Basic Protocol 1 steps 3 and 4.
Protocol 3: Browse EMDB
Introduction
This protocol describes how to browse the entire EMDB archive. This provides a casual entry point to searching the archive which is useful to experts and non-experts alike.
Necessary resources
Hardware
Any standard computer, tablet or smartphone with a reasonably fast connection to the Internet.
Software
We recommend the use of up-to-date versions of the most common browsers such as Chrome, Firefox and Safari.
Steps
Navigate to www.emdb-empiar.org/embrowse or select “Browse” from the left menu on the EMDB home page www.emdb-empiar.org.
The entries are shown on a search results page similar to the one described in Basic Protocol 1 and the functionality of the page is described in Basic Protocol 1 steps 3 and 4. As an example, to find human ribosome structures by Joachim Frank (one of the 2017 Nobel Prize winners in Chemistry), select “Eukaryotic ribosome” from “Component type”, “Homo sapiens” from “Organism” and “Frank J” from “Author”, then press “Update search results”.
Protocol 4: Form-based search
Introduction
This protocol describes how to precisely specify search parameters using a form. In general, it is useful when the options provided by the browse facility (Basic Protocol 3) are found to be insufficient but requires more knowledge about relevant options and is therefore more useful to domain users than casual users.
Necessary resources
Hardware
Any standard computer, tablet or smartphone with a reasonably fast connection to the Internet.
Software
We recommend the use of up-to-date versions of the most common browsers such as Chrome, Firefox and Safari.
Steps
Navigate to www.emdb-empiar.org/emsearch or select “Search” from the left menu on the EMDB home page www.emdb-empiar.org. You will be taken to a search form page with a wide range of search options (Figure 3).
-
The “All text” input searches all EMDB fields that have been loaded into the search database and is therefore the easiest option to use. To open collapsed menus click on the “+” symbol on the right-hand side to reveal options and sub-menus. Press Enter on the keyboard or click on the “Submit” button to open a new tab (or browser window) and show the search results.
Footnote: The input text follows standard Lucene/Solr syntax (https://lucene.apache.org/core/4_4_0/queryparser/org/apache/lucene/queryparser/classic/package-summary.html). Use logical operators “AND”, “OR” and “NOT” to combine terms, e.g., ribosome AND human. Use the wildcard character “*” to match any number of characters, e.g., “ribo*” will match “ribosome” as well as “ribozyme”, and “?” will match zero or one character. Ranges can also be specified using the syntax [ min_value TO max_value], e.g., “[ 1001 TO 1010 ]” for EMDB codes returns the entries in that range of accession codes.
The entries are shown on a search results page similar to the one described in Basic Protocol 1 and the functionality of the page is described in Basic Protocol 1 steps 3 and 4.
Figure 3.
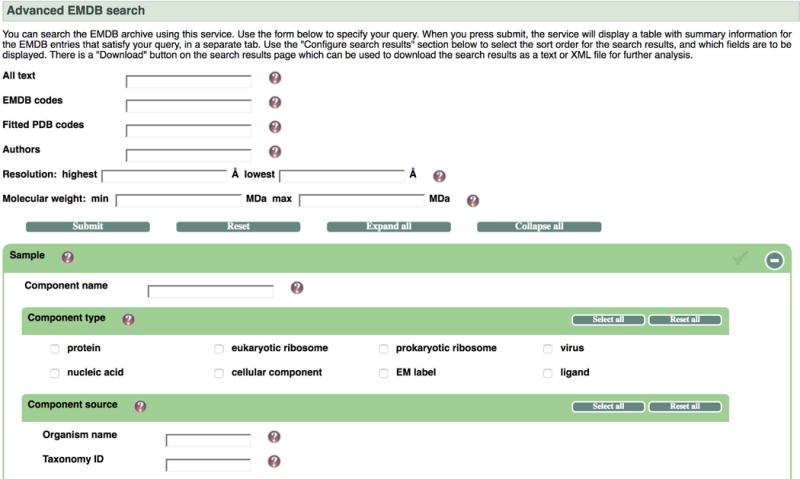
A form based search is available with a wide range of options to narrow down the search from the outset.
Protocol 5: Viewing image slices from EMDB 3D reconstructions
Introduction
3D EMDB reconstructions are large (typically in the 10’s of megabytes to 10’s of gigabytes range) and require specialized software to view on a desktop. The Volume Slicer enables the user to view image slices from these reconstructions in a web browser without having to download the entire 3D reconstruction or install specialised software. Casual users are not a likely target audience for the Volume Slicer despite its simple functionality due to the grey-scale and often noisy nature of the 3D reconstruction, and the lack of image annotation. Instead a more likely scenario is that of a domain expert viewing images in a published article and wanting to look at the 3D reconstruction in more detail.
Necessary resources
Hardware
Any standard computer or tablet with a reasonably fast connection to the Internet. The current design of the Volume Slicer does not render well on a phone.
Software
We recommend the use of up-to-date versions of the most common browsers such as Chrome, Firefox and Safari.
Steps
Navigate to an EMDB entry page, e.g., www.emdb-empiar.org/emd-2363 and select “Volume slicer” from the “Quick links” menu on the right side of the page or perform a search according to Basic Protocols 1-4 and press the “Volume slicer” button for any of the search results (Figure 4).
The default view in the main central panel is of the central slice through the 3D reconstruction in the ‘z’ direction. Use the 3D cube above the main central panel as an overview of the current slice with respect to the 3D reconstruction and use the sliders along the axes to change the slice being shown. Zoom into the image in the central panel using the slider to its right. On the left side there are three thumb-nail images in orthogonal directions; change the active plane viewed in the central panel by clicking inside these images and changing the positioning of the orange square/lines. Use the radio-button on their right to select which orthogonal direction is active in the central panel.
Figure 4.
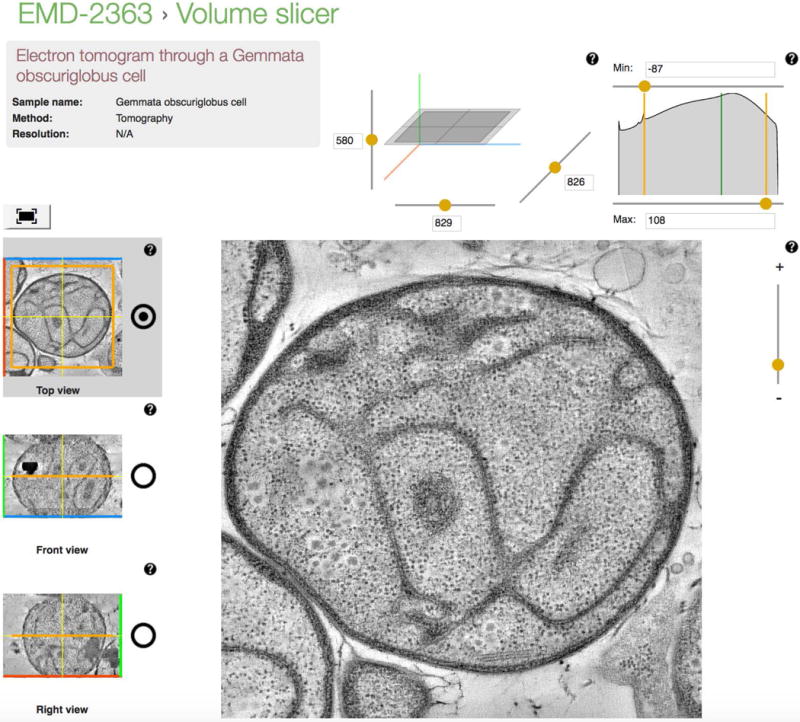
The Volume Slicer can be used to view orthogonal slices through a 3D reconstruction from EMDB.
Protocol 6: Interactive statistical charts on trends in EMDB
Introduction
The EMstats web-service provides pre-calculated statistical charts on various aspects of EMDB such as resolution trends, instrument usage and ftp downloads. These charts are often used to inform about trends affecting the field as a whole and are useful for a wide range of users.
Necessary resources
Hardware
Any standard computer, tablet or phone with a reasonably fast connection to the Internet.
Software
We recommend the use of up-to-date versions of the most common browsers such as Chrome, Firefox and Safari.
Steps
Navigate to emdb-empiar.org/emstats.
Select a link from the list of charts provided. For example to look at the number of entries released over the years, select “Map releases” (Figure 5). This will show a page with two charts – the map release trend and the trend of the cumulative number of maps released.
Hovering over a point will reveal the number of associated entries. An image of the chart or a csv file that can be used for further analysis or styling can be downloaded from the menu in the top right corner of every chart. Dragging a selection over the chart will zoom the chart and this can be reset using the “Reset zoom” button.
Select a point on the chart in order to search for the related entries. These are shown below the chart and have the same functionality described in Basic Protocol 1 3-4.
Figure 5.
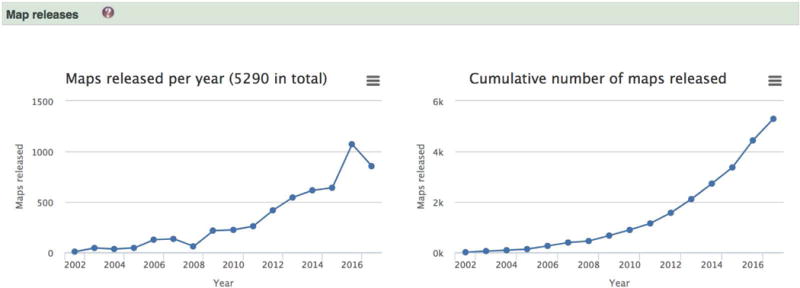
EMstats (emdb-empiar/emstats) is a web resource for up-to-date interactive charts based on the current state of EMDB. The chart on the left shows the number of entries released each year and the one on the right shows the cumulative number of entries.
Protocol 7: Visual Analysis pages
Introduction
The Visual Analysis pages provide basic sanity checking and validation information for each EMDB entry.
Necessary resources
Hardware
Any standard computer, tablet or phone with a reasonably fast connection to the Internet.
Software
We recommend the use of up-to-date versions of the most common browsers such as Chrome, Firefox and Safari.
Steps
- Navigate to an EMDB entry page, e.g., emdb-empiar.org/emd-6757. Select “Visual analysis” from the “Quick links” menu. The Visual analysis page for the entry has the following components:
- summary box with key information such as the recommended contour level, and voxel size.
- three panels of orthogonal images – projection images, central slices and surface views (at the recommended contour level) (Figure 6).
- analytical charts – map density distribution, volume estimate as a function of contour level, the Fourier Shell Correlation curve (if one is provided) and rotationally averaged power spectrum (RAPS; shown only if the 3D volume is cubic) (Figure 7).
- an analysis of the map versus model fit (if a model has been built or fitted to the map and deposited to PDB).
- images from auxiliary data.
Double click on any image to bring up a higher resolution image.
Figure 6.
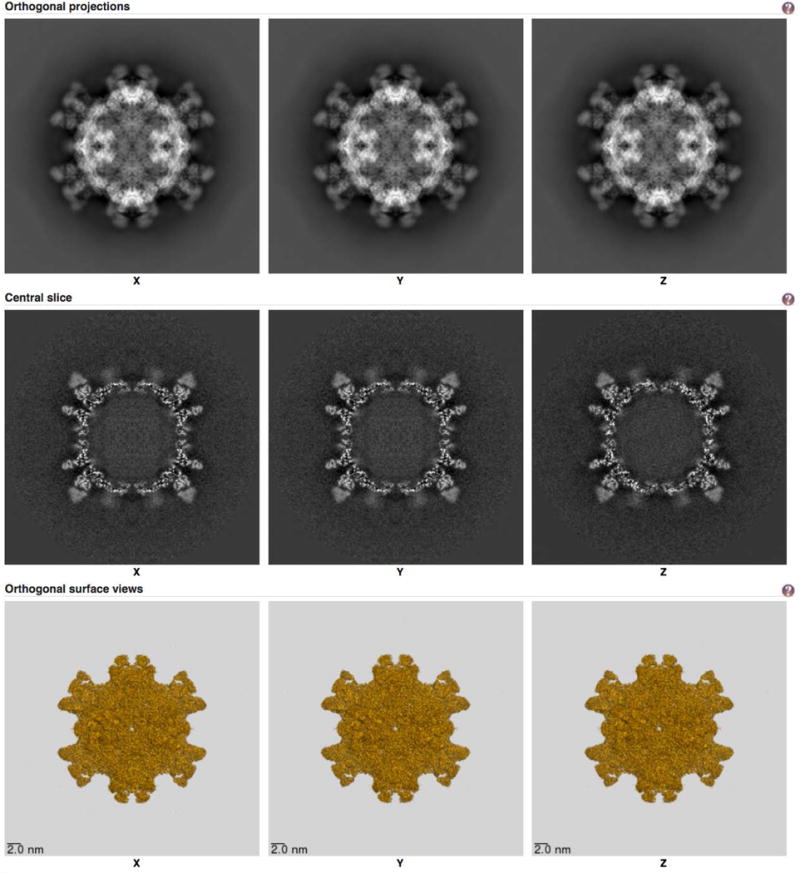
Image panels from the Visual analysis page for emdb-empiar.org/emd-6757. These images are useful for a quick check of the visual quality of the structure and to examine the masking applied and the contour level used for the surface rendering.
Figure 7.
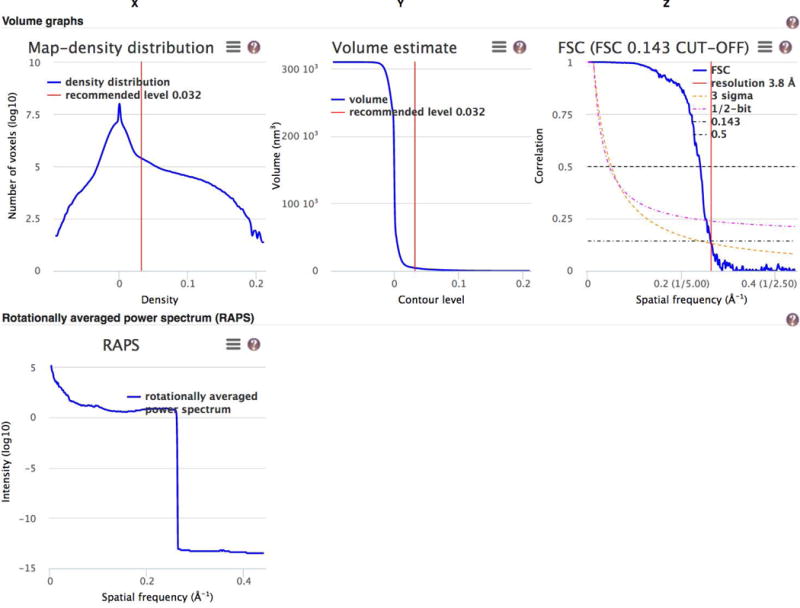
Analytical charts from the Visual analysis page for emdb-empiar.org/emd-6757. From left to right and top to bottom these charts show the map density distribution, the volume enclosed by the surface of the 3D reconstruction as the contour level is varied, the Fourier Shell Correlation (FSC) curve, and the rotationally averaged power spectrum.
Guidelines to Understanding Results
Users of EMDB should be mindful of the fact that deposition of meta-data is based on a depositor manually filling out forms and much of the curation of this meta-data is done manually by a team of annotators. Therefore, errors do persist in the archive despite efforts to remediate issues post deposition. In addition, ambiguity in the definition of meta-data items can sometimes lead to confusion among depositors and variations in parameters being deposited. In “Critical Parameters” below we highlight some of the main issues and in general we would recommend users to be aware of these issues when using the EMDB web resources.
Searching EMDB
The search results page displays summary information about the relevant entries – the user needs to navigate to the entry page, visual analysis or volume slicer to gain further information on a specific entry. In order to view all the meta-data available for a specific entry the user needs to view the EMDB XML header file. This file can be viewed or downloaded from the “Quick links” menu on the entry page or from the EMDB ftp area: ftp://ftp.ebi.ac.uk/pub/databases/emdb/.
Although searches return EMDB entries, the fundamental entity stored by the search engine is a sample component with a repeated (denormalised) representation of the non-sample component information. This is due to the fact that there can be many sample components for a given entry. Therefore, some caution needs to be taken with negated searches. For example, a search for “Sample->Sample source->Organism name” of “NOT homo sapiens” will still yield results of humans if any one of the other sample components was not human.
Visual Analysis
The projection images and central slices are useful for examining the masking applied on the 3D volume. Any masking applied also manifests itself as a peak in the map density distribution plot, often around zero density. The central slice images are useful to examine the quality of the reconstruction in detail. Further analysis can be done in the Slice viewer.
The surface views are calculated at the recommended contour level and should resemble the structure of the molecule. A high background noise level in the 3D volume or an incorrectly specified contour level are common reasons why the surface views may look very noisy and disjointed.
The rotationally averaged power spectrum is useful for examining Fourier space manipulations that may have been performed on the 3D reconstruction. The spectrum typically falls off with increasing spatial frequency. A relatively flat curve indicates some form of B-factor correction being applied to the 3D reconstruction. A sharp fall-off (e.g. at ~3.8Å in the case of emdb-empiar.org/emd-6757 (Figure 7)) usually indicates a truncation or masking applied in Fourier space on the spectrum.
The “Atom inclusion by residue at contour level” plot is particularly useful for obtaining an at-a-glance view of the parts of the model that may or may not fit the map density, for example see the Visual analysis page for emdb-empiar.org/emd-7048 (Figure 8). Green here indicates that all the atoms of a residues are within the map density and red indicates none. There is a linear ramp of colours from green to red indicating partial inclusion. Hovering over the chart will bring up a box with information about the residue being inspected. For example, in this case residues L1 to L187 do not seem to lie within the map density and would be worth examining in more detail.
Figure 8.
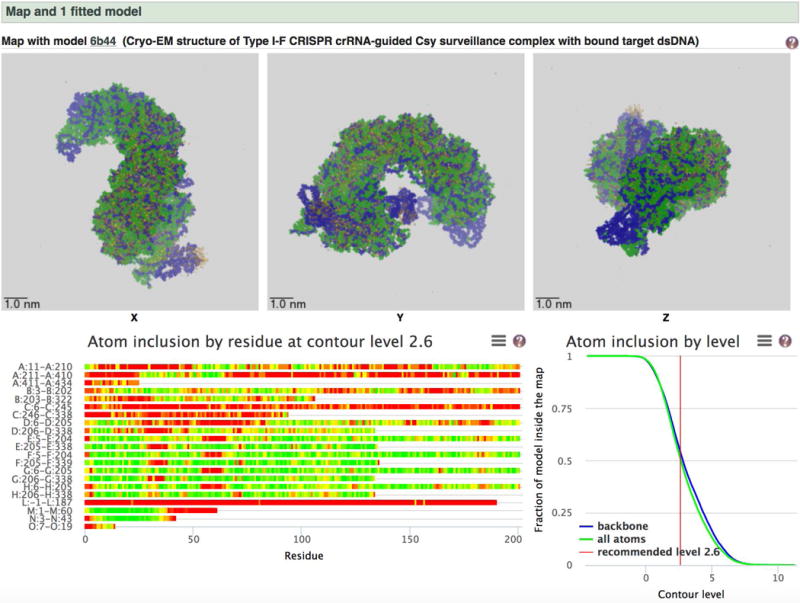
Map versus model analysis from the Visual analysis page for emdb-empiar.org/emd-7048.
Commentary
Background Information
The current EMDB header follows the EMDB version 1.9 schema. A richer data-model (version 2.0) is currently also distributed with recent entries and a further update is planned in the near future. Once the new version becomes the official standard for EMDB, we will update all our web resources to use the new header files thus exposing much richer meta-data in our searches as well as other web-resources. The Visual Analysis pages are based mainly on the analysis of the final 3D reconstruction deposited with the entry. This reconstruction has usually been processed, e.g., masked and filtered, in ways that limit its usefulness for analysing and validation of the structure. Based on calls from the EM community we now allow the deposit of independently reconstructed half-maps which we will exploit to present further analysis on the Visual Analysis pages.
An interactive 3D viewer is available (Lagerstedt et al., 2013) for all entries but unfortunately it is implemented as a Java applet and therefore no longer usable in many of the popular web browsers. We are therefore developing an alternative WebGL based viewer. We are also developing a web-based “Volume Browser” which will allow integrated problem based views of structural data from EMDB and other structural databases such as PDB (wwPDB.org) and EMPIAR (empiar.org) spanning scales from cells to molecules. The Volume Browser builds on the Volume Slicer but presents information from many entries rather than only one and will therefore be easier to use for a non-expert biological user.
Critical Parameters and Troubleshooting
| Parameter | Description | Troubleshooting |
|---|---|---|
| Contour level | The contour level is the density level below which densities are assumed to belong to the background (not the specimen). The contour level decides what the surface views will look like. It impacts the calculation of the molecular volume (and weight) and also the map model overlay analysis. | For known structures, if the structure has been masked then the surface views shown on the Visual Analysis page should resemble the known structures. Discrepancies may be due to an incorrect contour level and should be investigated further. |
| Reported resolution | The highest resolution at which the details of the structure may be interpreted. There is no one agreed metric by which this value is measured, but the resolution method is also collected as a meta-data item. | Incorrect resolution estimates can impact on the interpretation and analysis of the structure. If an FSC curve has been provided it is useful to check whether the resolution matches the resolution reported. The features of the structure can also be checked using the Volume Slicer and the images on the Visual Analysis pages. |
Significance Statement.
As an open public archive, the 3D cryo-electron microscopy structures in EMDB can be downloaded by users around the world and re-processed, analysed and visualised using their own resources. However, it is usually only domain experts who have the knowledge to select and exploit the required tools for these functions. Here we present protocols for searching, visualisation and validation using web-resources that do not require the explicit download of data or the installation of specific software (they work in any modern browser) and can therefore be used more easily by non-experts. However, memory and performance limitations of browser applications mean that the web resources should be regarded as a useful complement rather than as a replacement for desktop applications.
Acknowledgments
We thank Ingvar Lagerstedt, Jose Salavert Torres, Eduardo Sanz Garcia for their contributions in developing the resources described. We thank Cathy Lawson and Gerard Kleywegt for suggestions and feedback that have helped improve these resources. Work on EMDB is and has been supported by the US National Institutes of Health National Institute of General Medical Sciences (grant R01 GM079429), the UK Medical Research Council with co-funding from the UK Biotechnology and Biological Sciences Research Council (MRC/BBSRC; grant MR/L007835), the BBSRC (grant BB/M018423/1), the Wellcome Trust (grants 088944 and 104948), the European Commission Framework 7 Programme (grant 284209), and EMBL-EBI.
Literature Cited
- Gutmanas A, Alhroub Y, Battle GM, Berrisford JM, Bochet E, Conroy MJ, Kleywegt GJ. PDBe: Protein Data Bank in Europe. Nucleic Acids Res. 2014;42:D285–291. doi: 10.1093/nar/gkt1180. (Database issue) [DOI] [PMC free article] [PubMed] [Google Scholar]
- Lagerstedt I, Moore WJ, Patwardhan A, Sanz-Garcia E, Best C, Swedlow JR, Kleywegt GJ. Web-based visualisation and analysis of 3D electron-microscopy data from EMDB and PDB. J Struct Biol. 2013;184(2):173–181. doi: 10.1016/j.jsb.2013.09.021. [DOI] [PMC free article] [PubMed] [Google Scholar]
- Patwardhan A. Trends in the Electron Microscopy Data Bank (EMDB) Acta Crystallographica Section D. 2017;73(6) doi: 10.1107/S2059798317004181. [DOI] [PMC free article] [PubMed] [Google Scholar]
- Patwardhan A, Lawson CL. Databases and Archiving for CryoEM. Methods Enzymol. 2016;579:393–412. doi: 10.1016/bs.mie.2016.04.015. [DOI] [PMC free article] [PubMed] [Google Scholar]
- Salavert-Torres J, Iudin A, Lagerstedt I, Sanz-Garcia E, Kleywegt GJ, Patwardhan A. Web-based volume slicer for 3D electron-microscopy data from EMDB. J Struct Biol. 2016;194(2):164–170. doi: 10.1016/j.jsb.2016.02.012. [DOI] [PMC free article] [PubMed] [Google Scholar]
- Tagari M, Newman R, Chagoyen M, Carazo JM, Henrick K. New electron microscopy database and deposition system. Trends in Biochemical Sciences. 2002;27(11):589. doi: 10.1016/s0968-0004(02)02176-x. [DOI] [PubMed] [Google Scholar]


