Abstract
Objective
Compare word recognition scores for adults undergoing cochlear implant evaluations (CIE) measured using earphones and hearing aids
Study design
Retrospective review of data obtained during adult CIEs.
Setting
Tertiary cochlear implant center
Patients
208 ears in 183 subjects with greater than 10% word recognition scores measured with earphones.
Interventions/Main outcomes measured
Pre-operative pure-tone thresholds and word recognition scores measured with earphones and hearing aids.
Results
A review of audiological data obtained from 2012-2017 during adult CIEs was conducted. Overall, a weak positive correlation (r=0.33, 95% confidence interval 0.17-0.40, p<0.001) was observed between word recognition scores measured with earphones and hearing aids. Earphone to aided differences (EAD)1 ranged from −38% to +72% (mean 14.3±19.9%). Consistent with EADs, 108 ears (51.9%) had earphone scores that were significantly higher than aided word recognition scores (+EAD), as determined by 95% confidence intervals; for 14 ears (6.7%), earphone scores were significantly lower than aided scores (-EAD). Moreover, of the patients with earphone word recognition scores ≥50%, 82.6% were CI candidates based on aided AzBio+10 dB SNR scores.
Conclusion
These results demonstrate the limited diagnostic value of word recognition scores measured under earphones for patients undergoing CIE. Nevertheless, aided word recognition is rarely measured prior to CIEs, which limits the information available to determine CI candidacy and referral for CIEs. Earlier and routine measurement of aided word recognition may help guide clinical decision making by determining the extent to which patients are achieving maximum benefit with their hearing aids or should consider cochlear implantation.
Keywords: cochlear implant, hearing aids, sensorineural hearing loss
INTRODUCTION
The standard clinical audiologic assessment includes pure-tone air and bone conduction thresholds and speech audiometry measured monaurally through earphones in a sound-treated room with speech presented at high levels in quiet. Although aided speech recognition measures can provide important supplementary information about the real-world communication abilities of hearing-aid users, this assessment is not routinely performed. Clinicians often assume that earphone (headphone or insert) speech recognition scores can accurately predict aided speech recognition ability and, therefore, use it as a surrogate measure and to determine CI candidacy.2 In reality, however, this assumption is not supported by available evidence, as there is a weak correlation between these two measures.1,3,4
In current clinical practice, aided speech recognition is rarely, if ever, tested prior to cochlear implant evaluations (CIEs). McRackan et al. (2016), previously reported results from a multi-center FDA trial with hearing-aid users in which more than half of the subjects had >±10% point discrepancy between earphone and aided word recognition scores and one-fifth had earphone scores that were ≥20% points higher than aided scores.1 This “earphone-to-aided difference” (or EAD), was defined as the earphone word recognition score minus the aided word recognition score. Positive EAD (+EAD) was recognized as a marker for patients with poorer hearing and poorer aided word recognition, but relatively high earphone word recognition scores (likely due to higher speech presentation levels). Patients with a −EAD had word recognition scores measured with earphones that were equal to or lower than aided scores.1
Given that cochlear implant (CI) candidacy is based primarily on aided speech recognition ability (≤60% best-aided condition; ≤50% ear to be implanted),5 measuring outcomes that accurately reflect a patient’s real-world communication abilities with hearing aids is important for appropriate clinical decision making for those with moderate to profound sensorineural hearing loss. Currently, only approximately 6-10% of the 2 million Americans who qualify for implantation based on current FDA criteria have received CIs.6–8 Many clinicians wait until patients’ speech recognition scores measured under earphones decrease precipitously before scheduling a CIE.9 This practice may contribute to the gap separating criteria fulfillment and candidate identification. As CI indications continue to expand, the importance of narrowing this gap increases.
While EAD has been evaluated in hearing-aid users to determine its predictive value, this metric has not been assessed in patients with more severe hearing loss who may be candidates for CIs. Thus, the primary goal of this study was to determine the extent to which speech recognition scores measured with earphones accurately predict speech recognition scores with hearing aids measured in the sound field for adults undergoing CIEs. These results will demonstrate how well speech recognition scores measured with earphones serve as a surrogate for aided speech recognition scores, which are the primary criteria for CI candidacy. A secondary goal was to identify audiologic and patient-related characteristics that may be associated with EAD.
MATERIALS AND METHODS
The study sample included post-lingually deafened adults undergoing CIEs at a single tertiary care university hospital. The Institutional Review Board at (university name to be added later) approved the study, which included a retrospective chart review from January 2012 to December 2017. Patients with record of a complete CIE not performed for the revision of a prior implant were included in the study. Due to floor effects for speech recognition scores, ears with earphone word recognition scores <10% were excluded from analysis. Each individual ear’s data were treated as an independent value for the purposes of this study.
Age, sex, race, ethnicity, insurance coverage, hearing-aid use, and duration of hearing loss were reviewed for patients fulfilling criteria for inclusion. Table 1 lists all audiological tests performed. Pure-tone thresholds (measured at 250, 500, 1000, 2000, 4000, and 6000 Hz), pure-tone average (PTA) (average of 0.5, 1, and 2 kHz thresholds), speech recognition threshold (SRT), and consonant-nucleus-consonant word recognition (CNC) scores10 in quiet were collected for the earphone condition—representing the standard clinical hearing assessment. Earphone CNC scores for each ear were obtained at uncomfortable loudness level (UCL, determine with speech signals) minus 5 dB for all patients. Pure-tone thresholds, PTA, SRT, CNC, AzBio sentences in quiet, and AzBio sentences presented in noise (multitalker speech babble) at +10 dB SNR (AzBio +10) scores were collected for the aided condition.11 Aided speech recognition testing was performed with speech presented at 60 dB SPL in the sound field in a sound treated room. Hearing-aid users were tested with their personal hearing aids, while patients who did not use hearing aids were provided stock hearing aids for testing. All hearing aids (personal and stock) were programmed to meet NAL-RL targets and verified using Real ear measurements in order to optimize aided hearing for each subject prior to testing.
TABLE 1.
Audiologic testing measures performed
| Measure | Condition | |
|---|---|---|
| Earphone | Aided | |
| Pure-tone thresholds | X | X |
| Speech recognition thresholds | X | X |
| CNC scores | X | X |
| AzBio quiet scores | X | |
| AzBio +10 dB SNR scores | X | |
CNC, consonant-nucleus-consonant word recognition; AzBio, sentence recognition in quiet; AzBio +10, sentence recognition in noise (+10 dB signal-to-noise ratio).
Statistical Analysis
Descriptive statistics were calculated for all demographic and audiologic variables. Statistical analyses of data were performed using Chi-square test or Fisher’s test for nominal variables and independent sample t-tests for continuous variables. Pearson correlations were utilized to quantify the relationship between earphone and aided speech recognition scores. Correlation coefficients <0.19 were considered very weak, 0.20-0.39 weak, 0.40-0.59 moderate, 0.60-0.79 strong, >0.80 very strong.12
RESULTS
During the study period, 208 of 600 patients undergoing a CIE met inclusion and exclusion criteria. For the purpose of reporting results, “patients” will refer to the number of implanted ears, acknowledging that 25 of the 208 patients received sequential bilateral CIs and therefore received two CIE’s on separate dates. Table 2 describes the demographics of the study sample. The mean duration of hearing loss before receiving a CIE was 24.1±16.5 years, and 78.9% of patients were hearing-aid users prior to implantation. In comparing +EAD and −EAD patients, +EAD patients were older on average (Table 2). No other demographic differences were identified between the groups.
TABLE 2.
Patient demographics for the entire cohort and the two EAD groups
| Variable | All | -EAD | +EAD | p-value |
|---|---|---|---|---|
| Number | 208 | 52 | 156 | |
| Age (mean±SD range) | 68.3±13.1 (24-94) | 64.1±14.0 (27-94) | 69.7±12.5 (24-94) | 0.01* |
| Sex | ||||
| Male | 121 (58.2%) | 31 (59.6%) | 90 (57.7%) | 0.81 |
| Female | 87 (41.8%) | 21 (40.4%) | 66 (42.3%) | |
| Race | ||||
| White | 179 (86.1%) | 42 (80.8%) | 137 (87.8%) | 0.32 |
| African American | 28 (13.5%) | 10 (19.2%) | 18 (11.5%) | |
| Asian | 0 (0%) | 0 (0%) | 1 (0.6%) | |
| Hearing-aid use | ||||
| Yes | 164 (78.8%) | 38 (73.1%) | 126 (80.8%) | 0.24 |
| No | 44 (21.2) | 14 (26.9%) | 30 (19.2%) | |
| Duration of hearing loss | 24.1±16.5 | 21.8±14.8 | 24.9±17.1 | 0.24 |
EAD indicates “earphone to aided difference.”
The mean EAD for the study population was +14.3% with 61.7% (n=127) of patients having a +EAD ≥10%. EAD distribution for the study sample is displayed in Figure 1. Table 3 displays the earphone and aided audiologic results for the two groups. Statistically significant differences were observed between +EAD and −EAD groups at several frequencies, with the +EAD cohort having higher pure-tone thresholds in the lower frequencies measured under earphones and at all frequencies measured in the sound field with hearing aids (Figure 2). Patients with +EADs also had higher earphone and aided PTAs and SRTs than patients with −EADs. CNC scores measured under earphone were higher for +EAD patients than for −EAD patients despite similar presentation levels (Table 4). In contrast, aided scores for CNC words, AzBio sentences in quiet, and AzBio +10 dB SNR for −EAD patients were significantly higher than scores for +EAD patients.
FIG. 1.
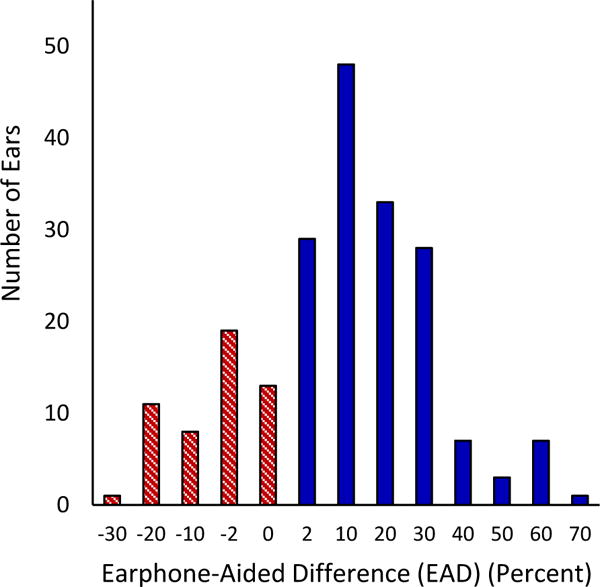
Number of participants for a given increment of +EAD and −EAD (in percent). Each histogram bar includes a range from its numerical value to the next positive value for +EAD and to the next negative value for −EAD. For example, the bar labeled “2” includes EAD values from 2% to 8% and the bar labeled “-10” includes EAD values from −10% to −18%. EAD indicates “earphone to aided difference.”
TABLE 3.
Pre-operative pure-tone thresholds for the entire cohort and the two EAD groups
| Condition | Frequency (Hz) | All (dB HL) | -EAD (dB HL) | +EAD (dB HL) | p-value |
|---|---|---|---|---|---|
| Earphone (mean ±SD) |
250 | 59.1±21.9 | 50.7±22.3 | 61.9±21.1 | <0.00* |
| 500 | 64.2±19.2 | 56.9±19.9 | 66.6±18.3 | <0.00* | |
| 1000 | 73.5±14.2 | 70.6±10.7 | 74.5±15.1 | 0.04* | |
| 2000 | 83.0±18.9 | 82.5±19.8 | 83.1±18.7 | 0.83 | |
| 4000 | 91.7±22.1 | 88.4±23.5 | 92.8±21.6 | 0.21 | |
| 6000 | 97.6±22.1 | 93.6±22.9 | 98.9±21.8 | 0.14 | |
| Aided (mean ±SD) |
250 | 38.1±15.4 | 31.0±12.1 | 40.5±15.6 | <0.00* |
| 500 | 35.0±11.8 | 31.3±9.0 | 36.2±12.3 | 0.01* | |
| 1000 | 36.2±12.0 | 32.9±8.9 | 37.3±12.7 | 0.02* | |
| 2000 | 42.8±16.1 | 38.8±15.4 | 44.1±16.2 | 0.04* | |
| 4000 | 58.9±24.4 | 52.5±24.0 | 61.1±24.2 | 0.03* | |
| 6000 | 65.8±24.7 | 57.4±23.2 | 68.5±24.6 | 0.01* | |
| 250 | 38.1±15.4 | 31.0±12.1 | 40.5±15.6 | <0.00* |
EAD indicates “earphone to aided difference.”
FIG. 2.
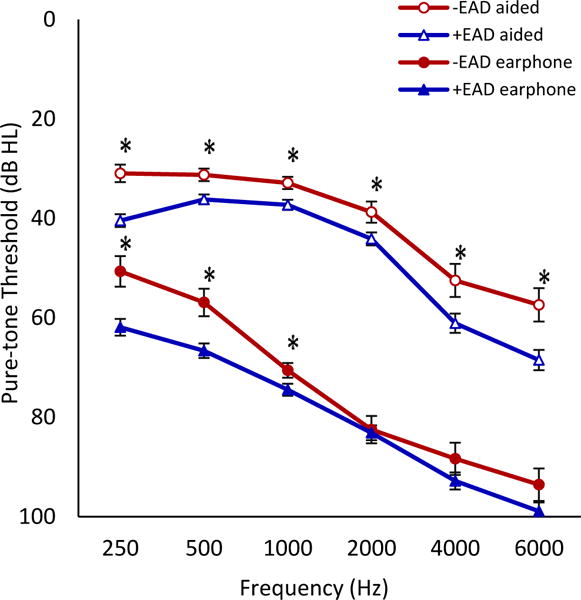
Mean earphone and aided pure-tone thresholds for +EAD and −EAD groups with error bars indicating ±1 standard error at each frequency. Statistically significant differences in earphone pure-tone thresholds were found at 250, 500, and 1000 Hz. Aided thresholds significantly differed at all frequencies measured (asterisks, all p<0.05).
TABLE 4.
Pre-operative speech recognition scores for the entire cohort and the two EAD groups
| Condition | Variable | All | -EAD | +EAD | p-value |
|---|---|---|---|---|---|
| Earphone (mean ±SD) |
PTA (dB HL) | 73.6±12.8 | 70.0±10.5 | 74.8±13.3 | 0.01* |
| SRT (dB HL) | 65.6±15.1 | 59.6±12.2 | 67.6±15.4 | <0.00* | |
| CNC (%) | 32.0±18.4 | 22.0±11.7 | 35.4±19.0 | <0.00* | |
| CNC level (dB SPL) | 93.3±9.8 | 92.0±8.7 | 93.7±10.1 | 0.28 | |
| Aided (mean ±SD) |
PTA (dB HL) | 38.0±10.4 | 34.3±8.4 | 39.2±10.7 | <0.00* |
| SRT (dB HL) | 37.4±9.7 | 33.2±5.9 | 38.9±10.3 | <0.00* | |
| CNC (%) | 17.8±15.8 | 33.9±13.6 | 13.1±13.5 | <0.00* | |
| AzBio (%) | 25.0±21.0 | 37.5±21.3 | 21.9±19.78 | <0.00* | |
| AzBio +10 (%) | 22.8±20.8 | 29.8±19.5 | 19.1±20.6 | 0.03* |
EAD indicates “earphone to aided difference”; PTA, pure-tone average; SRT, speech recognition threshold; CNC, consonant-nucleus-consonant word recognition; CNC level, presentation level for CNC word recognition; AzBio, sentence recognition in quiet; AzBio +10, sentence recognition in noise (+10 dB signal-to-noise ratio).
To test the widely accepted assumption that scores measured with earphones are accurate predictors of speech recognition with hearing aids, earphone word recognition (CNC) scores were plotted against aided word and sentence recognition scores (Figures 3–5). These comparisons test the assumption that word recognition scores measured under earphones can act as a surrogate in assessing real-world communication abilities with hearing aids and, therefore, can be used to determine a patient’s need for hearing aids or CIs. Weak positive correlations were observed between earphone CNC and aided CNC scores (Figure 3, r=0.33) and earphone CNC and aided AzBio +10 scores (Figure 5, r=0.35). A moderate positive correlation was found between earphone CNC scores and aided AzBio quiet scores (Figure 4, r=0.40).
FIG. 3.
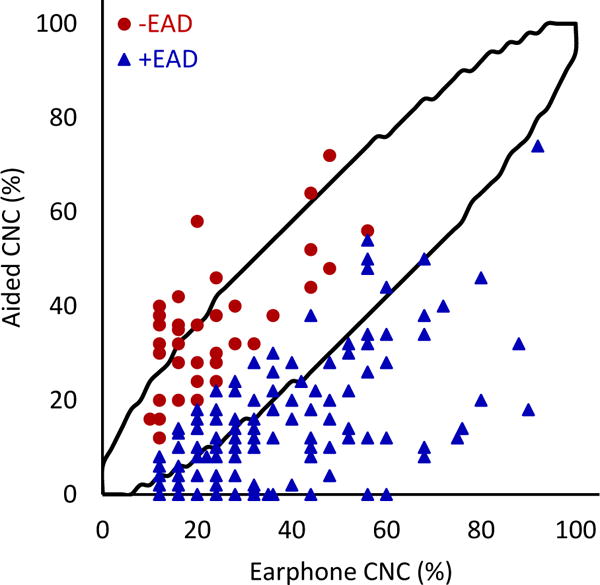
Earphone word recognition scores plotted against aided scores. Black lines indicate 95% confidence interval. The correlation between earphone and aided word recognition scores was statistically significant (r=0.33; 95% CI 0.172-0.395; p=<0.001; N=208).
FIG. 5.
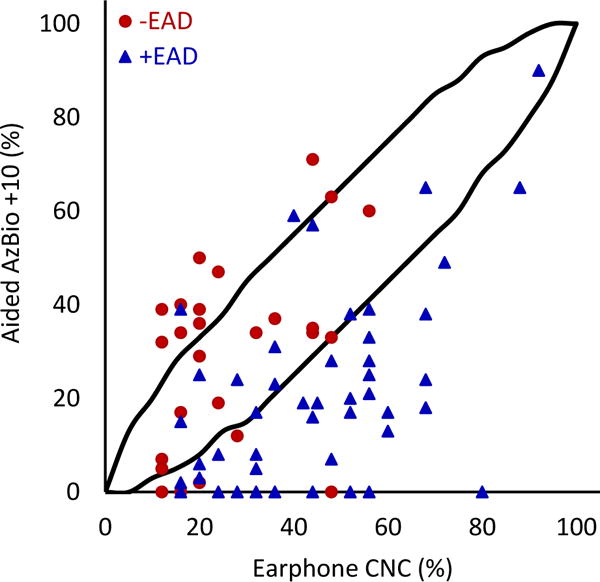
Earphone word recognition scores plotted against aided AzBio sentence scores in noise. Lines indicate 95% confidence interval. The correlation between earphone word recognition and aided sentence scores in noise was statistically significant (r=0.349; 95% CI 0.150-0.595; p=0.001; N=82).
FIG. 4.
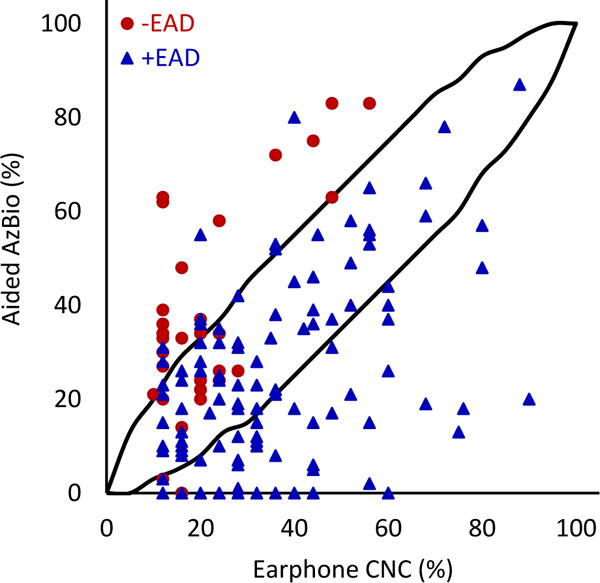
Earphone word recognition scores plotted against aided AzBio sentence scores in quiet. Black lines indicate 95% confidence interval. The correlation between earphone word recognition and aided sentence scores in quiet was statistically significant (r=0.400; 95% CI 0.299-0.625; p=<0.001; N=166).
When comparing earphone and aided CNC scores (Figure 3), 51.9% (n=108) of patients fell below the 95% confidence interval (meaning their earphone scores were significantly higher than their aided scores, or +EAD). Only 6.7% (n=14) of patients were above the 95% confidence interval (meaning their aided scores were significantly higher than their earphone scores, or −EAD). Similar patterns were observed with CNC-AzBio comparisons. For earphone CNC scores and aided AzBio quiet scores (Figure 5), 41.5% (N=78) fell below and 13.3% (n=25) fell above the 95% confidence interval. Comparing CNC scores and AzBio +10 (Figure 4), 56.1% (n=46) of patients fell below and 13.4% (n=11) fell above the 95% confidence interval. +EAD patients comprised 97.4% (n=76) and 89.1% (n=41) of patients lower than the 95% confidence interval for AzBio quiet and noise, respectively. The weak correlations between earphone and aided speech recognition scores, together with large percentages of patients showing significantly poorer aided speech recognition scores than earphone scores, support the early and routine measurement of aided speech recognition for appropriate clinical decision making about the use of hearing aids and potential CI candidacy.
Patients with earphone word recognition scores ≥50% have not traditionally undergone aided speech recognition testing because they are not routinely recommended for CIEs9 and are assumed to be good candidates for hearing aids.2 To test the 50% score criterion, we determined aided scores for the 37 patients (17.8%) in our study sample whose earphone CNC scores were ≥50%. For these patients, aided scores were on average 35.8% poorer than earphone CNC scores (+35.8% EAD), suggesting that the ≥50% criterion for earphone scores is not appropriately identifying patients with relatively poor aided speech recognition, that is, those patients who may be CI candidates. Similarly, for 60.7% and 82.6% of this cohort, aided AzBio scores were poorer than 50% in quiet and noise, respectively, making these patients appropriate CI candidates despite earphone scores ≥50%. When comparing patients with earphone CNC scores above and below 50%, no significant differences were found for PTA, SRT, and CNC presentation levels measured under earphones, and aided scores for AzBio +10 (Table 4). Therefore, without the ability to accurately predict aided scores from earphone scores or from other audiometric measures, direct measures of aided speech recognition are necessary to identify those patients who are potential CI candidates.
DISCUSSION
Identifying adult CI candidates has become more challenging in recent years due to changing CI indications. Thirty years ago, adult CI candidates were primarily patients who were profoundly deaf with little to no measurable speech recognition (aided or earphone) and, therefore, were easy to identify based on standard audiological assessments. However, as CI technology and indications have evolved, patients are being implanted with more and more residual hearing and better speech recognition,13,14 making it more challenging to appropriately recommend patients for CIEs.15 Difficulty in identifying CI candidates has likely played a significant role in the estimated 6-10% CI utilization rate in the United States.7
The widespread assumption that speech recognition measured under earphones (such as earphone scores ≥50%) accurately predicts good benefit with hearing aids2 may play a role in the low CI utilization rates. Such earphone-based word recognition criteria without direct assessment of aided speech recognition may also delay the time between identifying a patient as a potential CI candidate and recommending a CIE. The results of the current study provide evidence that does not support this assumption and a 50% score criterion, including weak to moderate positive correlations between earphone and aided speech recognition scores, which is consistent with previously published data.1,4,16 In a majority of patients, earphone CNC scores overestimated patients’ aided speech recognition ability. Aided CNC, AzBio quiet, and AzBio noise scores for a majority of patients were significantly poorer than their earphone CNC scores. Moreover, 61.1% of patients were found to have ≥10% higher CNC scores measured under earphones than with hearing aids (EAD ≥10%). These data reveal that a large number of patients are potential CI candidates based on direct measures of aided speech recognition, and are inaccurately assumed from earphone scores to achieve sufficient benefit with hearing aids.
Gubbels et al. recently published their series of patients undergoing CIEs and found highly specific unaided PTA and earphone word recognition scores that resulted in patients being CI candidates.9 These results are useful for efficient referral, so practitioners may ensure that the majority of patients who are recommended for CIEs are appropriate candidates for cochlear implantation. However, the focus on specificity over sensitivity means that a large number of patients who may meet CI criteria may not be recommended for CIEs. To directly investigate this question, we reviewed results for a subset of patients with earphone CNC scores ≥50% who may not have traditionally been recommended for CIEs. On average, aided scores for this subset of patients were 35.8% poorer than earphone CNC scores (+35.8% EAD). Further, 82.6% of these patients would be considered CI candidates based on aided sentence recognition in noise. Therefore, speech recognition scores measured under earphones may overestimate hearing-aid benefit, are not accurate predictors of CI candidacy, and may delay these patients from appropriate CIE referrals.
The current study provides additional evidence to support the evaluation of aided speech recognition as an early and routine component of audiologic assessments.1,4,16 The customary clinical practice of assuming a patient’s earphone speech recognition ability accurately predicts their hearing-aid benefit is not supported by evidence from the current study. The lack of correspondence between earphone and aided speech recognition scores has previously been shown for patients with mild to moderate hearing loss using hearing aids1,4 and similar findings are now shown for patients with more severe hearing loss who may be CI candidates. By directly assessing aided speech recognition, clinicians and patients can gain a better understanding of the patient’s real-world communication abilities with hearing aids and determine if changes are needed. This can lead to improved hearing-aid satisfaction if successful programming changes are made or increased CI utilization if patients are found to be appropriate CI candidates. The current practice can cause a delay in the time when a patient is recommended for a CIE, which can increase the duration of hearing loss prior to implantation—a known poor prognostic factor for CI outcomes.17,18
Similar to earlier work, we found higher PTAs, SRTs, and earphone word recognition scores in the +EAD group.1 In the prior study, speech presentation levels for earphone word recognition were set at a fixed level above SRT leading to higher presentation levels for the +EAD than the −EAD group. Given their higher SRTs, it was hypothesized that the +EAD group had higher earphone word recognition scores due to the higher speech presentation levels, which explained the large differences in the earphone and aided scores. In contrast, the current study used UCL −5 dB for all patients,19 which resulted in similar and much higher speech presentation levels between +EAD and −EAD groups, and better average CNC scores for +EAD than −EAD groups. More research is needed to determine the sources of the differences between earphone and aided speech recognition for older adults with moderate to severe hearing loss. In the current study, advanced age and higher low frequency pure-tone thresholds were associated with +EAD, but these findings would be difficult to apply to the clinical setting as there are no clear cutoffs for age or pure-tone thresholds that accurately predict differences in earphone and aided speech recognition (EAD). Ultimately, the early and routine assessment of aided speech recognition would provide important information for clinical decision making and may lead to treatment changes that can improve patient outcomes.
The main limitation of this study is that it included only patients undergoing CIEs, which does not represent a random sample of adults with hearing loss. Patients undergoing CIEs may be less satisfied with their hearing-aid benefit and are looking for an alternative. This sampling bias could also increase the number of individuals with poorer aided speech recognition (+EAD). Nevertheless, the large sample of patients in this study represents our actual clinic inventory and their pre-operative communication abilities measured under earphones and with hearing aids.
CONCLUSIONS
In evaluating the standard audiologic test battery in patients undergoing CIEs, we observed weak to moderate positive correlations between earphone and aided speech recognition scores. These results provide evidence that do not support the widespread clinical assumption that patient’s earphone speech recognition scores measured under earphones provides an accurate estimate of their aided speech recognition scores. Patients whose speech recognition scores measured under earphones that were higher than the commonly recognized criterion for CIE recommendation (e.g., 50%) may indeed be CI candidates based on significantly poorer aided speech recognition. This discrepancy may play a significant role in the delay patients experience in being referred for a CIE and the overall low CI utilization rate. These results also provide additional evidence for the early and routine assessment of aided speech recognition as part of the standard audiologic test battery to better understand patients’ real-world communication abilities with hearing aids.
TABLE 5.
Pre-operative characteristics for patients whose CNC word recognition scores are above and below 50%
| Condition | Variable | CNC ≥ 50% | CNC <50% | p-value |
|---|---|---|---|---|
| Earphone (mean ±SD) |
EAD | 35.76±19.52 | 9.62±16.70 | <0.00* |
| PTA | 71.08±14.40 | 74.10±12.34 | 0.19 | |
| SRT | 66.35±15.44 | 65.44±15.03 | 0.74 | |
| CNC | 63.38±11.43 | 25.23±11.11 | <0.00* | |
| CNC dB | 92.98±13.00 | 93.39±9.02 | 0.78 | |
| Aided (mean ±SD) |
PTA | 35.63±7.05 | 38.48±10.95 | 0.05* |
| SRT | 36.11±6.67 | 37.65±10.25 | 0.26 | |
| CNC | 27.62±17.68 | 15.61±14.56 | <0.00* | |
| AzBio | 41.04±24.07 | 21.76±18.79 | <0.00* | |
| AzBio +10 | 29.61±23.57 | 20.08±19.11 | 0.06 |
EAD indicates “earphone to aided difference”; PTA, pure-tone average; SRT, speech recognition threshold; CNC, consonant-nucleus-consonant word recognition; CNC dB, presentation level for CNC word recognition; AzBio, sentence recognition in quiet; AzBio +10, sentence recognition in noise.
Acknowledgments
This publication was supported by a K12 award through the South Carolina Clinical & Translational Research (SCTR) Institute, with an academic home at the Medical University of South Carolina, NIH/NCATS Grant Number UL1TR001450, NIH funding from NIH/NIDCD R01 DC000184 and NIH/NIDCD P50 DC000422, and a grant from the Doris Duke Foundation.
Footnotes
Conflict of Interest Disclosures:
Dr. Holcomb is on the medical advisory board for and has received personal fees from Advanced Bionics and Cochlear Americas and has received grants from Med El Corporation. No other disclosures are reported.
The authors have no financial disclosures to make.
References
- 1.McRackan TR, Ahlstrom JB, Clinkscales WB, Meyer TA, Dubno JR. Clinical Implications of Word Recognition Differences in Earphone and Aided Conditions. Otol Neurotol. 2016;37(10):1475–1481. doi: 10.1097/MAO.0000000000001205. [DOI] [PMC free article] [PubMed] [Google Scholar]
- 2.Committee on Hearing and Equilibrium guidelines for the evaluation of hearing preservation in acoustic neuroma (vestibular schwannoma) American Academy of Otolaryngology-Head and Neck Surgery Foundation, INC. Otolaryngol Head Neck Surg. 1995;113(3):179–180. doi: 10.1016/S0194-5998(95)70101-X. [DOI] [PubMed] [Google Scholar]
- 3.Chang CYJ, Spearman M, Spearman B, McCraney A, Glasscock ME., 3rd Comparison of an Electromagnetic Middle Ear Implant and Hearing Aid Word Recognition Performance to Word Recognition Performance Obtained Under Earphones. Otol Neurotol. 2017;38(9):1308–1314. doi: 10.1097/MAO.0000000000001554. [DOI] [PubMed] [Google Scholar]
- 4.McRackan TR, Clinkscales WB, Ahlstrom JB, Nguyen SA, Dubno JR. Factors associated with benefit of active middle ear implants compared to conventional hearing aids. Laryngoscope. 2018 doi: 10.1002/lary.27109. [DOI] [PMC free article] [PubMed] [Google Scholar]
- 5.Balkany T, Hodges A, Menapace C, et al. Nucleus Freedom North American clinical trial. Otolaryngol Head Neck Surg. 2007;136(5):757–762. doi: 10.1016/j.otohns.2007.01.006. [DOI] [PubMed] [Google Scholar]
- 6.Blanchfield BB, Feldman JJ, Dunbar JL, Gardner EN. The severely to profoundly hearing-impaired population in the United States: prevalence estimates and demographics. J Am Acad Audiol. 2001;12(4):183–189. [PubMed] [Google Scholar]
- 7.Sorkin DL. Cochlear implantation in the world’s largest medical device market: utilization and awareness of cochlear implants in the United States. Cochlear Implants Int. 2013;14(Suppl 1):S4–12. doi: 10.1179/1467010013Z.00000000076. [DOI] [PMC free article] [PubMed] [Google Scholar]
- 8.Mahboubi H, Lin HW, Bhattacharyya N. Prevalence, Characteristics, and Treatment Patterns of Hearing Difficulty in the United States. JAMA Otolaryngol Head Neck Surg. 2017 doi: 10.1001/jamaoto.2017.2223. [DOI] [PMC free article] [PubMed] [Google Scholar]
- 9.Gubbels SP, Gartrell BC, Ploch JL, Hanson KD. Can routine office-based audiometry predict cochlear implant evaluation results? Laryngoscope. 2017;127(1):216–222. doi: 10.1002/lary.26066. [DOI] [PubMed] [Google Scholar]
- 10.Causey GD, Hood LJ, Hermanson CL, Bowling LS. The Maryland CNC Test: normative studies. Audiology. 1984;23(6):552–568. doi: 10.3109/00206098409081538. [DOI] [PubMed] [Google Scholar]
- 11.Spahr AJ, Dorman MF, Litvak LM, et al. Development and validation of the AzBio sentence lists. Ear Hear. 2012;33(1):112–117. doi: 10.1097/AUD.0b013e31822c2549. [DOI] [PMC free article] [PubMed] [Google Scholar]
- 12.Evans JD. Straightforward statistics for the behavioral sciences. Pacific Grove: Brooks/Cole Pub. Co.; 1996. [Google Scholar]
- 13.Gantz BJ, Dunn C, Oleson J, Hansen M, Parkinson A, Turner C. Multicenter clinical trial of the Nucleus Hybrid S8 cochlear implant: Final outcomes. Laryngoscope. 2016;126(4):962–973. doi: 10.1002/lary.25572. [DOI] [PMC free article] [PubMed] [Google Scholar]
- 14.Jurawitz MC, Büchner A, Harpel T, et al. Hearing preservation outcomes with different cochlear implant electrodes: Nucleus® Hybrid™-L24 and Nucleus Freedom™ CI422. Audiol Neurootol. 2014;19(5):293–309. doi: 10.1159/000360601. [DOI] [PubMed] [Google Scholar]
- 15.Carlson ML, Sladen DP, Gurgel RK, Tombers NM, Lohse CM, Driscoll CL. Survey of the American Neurotology Society on Cochlear Implantation: Part 1, Candidacy Assessment and Expanding Indications. Otol Neurotol. 2018;39(1):e12–e19. doi: 10.1097/MAO.0000000000001632. [DOI] [PubMed] [Google Scholar]
- 16.Hoppe U, Hast A, Hocke T. Audiometry-Based Screening Procedure for Cochlear Implant Candidacy. Otol Neurotol. 2015;36(6):1001–1005. doi: 10.1097/MAO.0000000000000730. [DOI] [PubMed] [Google Scholar]
- 17.Blamey P, Artieres F, Baskent D, et al. Factors affecting auditory performance of postlinguistically deaf adults using cochlear implants: an update with 2251 patients. Audiol Neurootol. 2013;18(1):36–47. doi: 10.1159/000343189. [DOI] [PubMed] [Google Scholar]
- 18.Holden LK, Firszt JB, Reeder RM, Uchanski RM, Dwyer NY, Holden TA. Factors Affecting Outcomes in Cochlear Implant Recipients Implanted With a Perimodiolar Electrode Array Located in Scala Tympani. Otol Neurotol. 2016;37(10):1662–1668. doi: 10.1097/MAO.0000000000001241. [DOI] [PMC free article] [PubMed] [Google Scholar]
- 19.Guthrie LA, Mackersie CL. A comparison of presentation levels to maximize word recognition scores. J Am Acad Audiol. 2009;20(6):381–390. doi: 10.3766/jaaa.20.6.6. [DOI] [PMC free article] [PubMed] [Google Scholar]


