

Abstract
Neutralization of bacterial toxins has become a compelling approach to treating bacterial infections as it may pose less selective pressure for the development of bacterial resistance. Currently the majority of toxin neutralization platforms act by targeting the molecular structure of the toxin, which requires toxin identification and customized design for different diseases. Therefore, their development has been challenged by the enormous number and complexity of bacterial toxins. Herein, we formulate biomimetic toxin nanosponges by coating membranes of human red blood cells (hRBCs) onto polymeric nanoparticles, which act as a toxin decoy to absorb and neutralize a broad-spectrum of hemolytic toxins regardless of their molecular structure. When tested with model pore-forming toxins, including melittin, α-hemolysin of methicillin-resistant Staphylococcus aureus, listeriolysin O of Listeria monocytogenes, and streptolysin O of Group A Streptococcus, the hRBC nanosponges are able to completely inhibit toxin-induced hemolysis in a concentration-dependent manner. In addition, the nanosponge-detained toxins show no cytotoxicity when tested on human umbilical vein endothelial cells and no lethality when injected into mice, which together indicate effective toxin neutralization. Overall, the results demonstrate the broad applicability and high effectiveness of the hRBC nansoponges as a novel antivirulence platform against hemolytic toxins from various strains of bacteria.
Keywords: nanosponge, detoxification, hemolytic toxin, bacterial infection, antivirulence
Table of content entry
Biomimetic toxin nanosponges made of human RBC membranes are prepared and tested against four distinct pore-forming toxins. The results demonstrate that the nanosponges can completely inhibit the virulence of the toxins in a concentration-dependent manner both in vitro and in vivo. Similar design and test can be readily applied to other cell membrane-coated nanosponges for broad antivirulence applications.
Introduction
Pore-forming toxins (PFTs) are the most abundant bacterial cytotoxic proteins.[1] They share a common function of perforating membranes of the host cells for bioactivity.[2] PFTs have sparked significant attention as evidence increasingly reveals their essential roles in bacterial pathogenesis, especially that of drug resistant pathogens.[2, 3] For example, α-hemolysin (Hlα) of methicillin-resistant Staphylococcus aureus (MRSA) can cause injuries and lesions in both skin necrosis and systemic infection.[4] In MRSA infection, it has been shown that host antibody response was correlated with Hlα secretion by the pathogen and the disease burden also correlated with Hlα expression and virulence.[5] As another example, hemolytic listeriolysin O (LLO) produced by Listeria monocytogenes, a facultative intracellular gram-positive bacterium, is able to mediate virulence by damaging the phagosome membrane and subsequently promoting bacterial intracellular survival and replication.[6, 7] In addition, streptolysin O (SLO) secreted by Group A Streptococcus (GAS) can facilitate phagolysosomal membrane poration and NADase translocation into the macrophage cytosol, which together promote GAS intracellular survival and drug resistance.[8, 9]
The critical roles played by PFTs have motivated the development of antivirulence therapies aimed at inhibiting toxin expression or activity.[10, 11] Without engaging direct disruption of bacterial cycles, such therapies are considered less likely to elicit resistance when compared with traditional antibiotics.[12] Inhibition of PFTs may also aid the host immune system to engage in bacterial killing.[13] Additionally, suppression of PFTs can be combined with antibiotics to generate synergistic antimicrobial activities.[14] Together, these advantages have led to the rapid development of various antivirulence platforms, including antisera, monoclonal antibodies, and small-molecule inhibitors, with some success in combating drug resistant bacterial infections.[15, 16] Although promising, these platforms target primarily the molecular structure of PFTs for capturing and neutralizing toxins, therefore requiring customized design for different toxins. Given the drastic diversity of PFTs, such structure-based approaches have been challenged by an overwhelming number of distinctive molecular structures and epitopic targets.
To address this limitation, a biomimetic nanoparticle design emerged recently by wrapping polymeric nanoparticle cores with plasma membrane derived from natural red blood cells (RBCs).[17, 18] These cell membrane-coated nanoparticles (denoted ‘nanosponges’) harnessed the functional similarity shared among PFTs that selectively bind and perforate cell membranes, regardless of their molecular structures and epitopic targets. They function by mimicking natural RBCs to bind with toxins and therefore divert them away from their intended cellular targets. Selective toxin adsorption is determined by the natural interaction and binding between the target toxins and the RBC membranes. Nanosponges have been demonstrated to neutralize effectively various PFTs. Toxin-detained nanosponges have also been applied as new nanotoxoid vaccines against bacterial infection.[19, 20] The function-based toxin inhibition by nanosponges has inspired additional innovative formulations for potential antivirulence treatment against bacterial infections. For example, nanosponges have been loaded into a hydrogel to form a hybrid material specifically for local treatment of MRSA infection.[21] Various delivery vehicles ranging from cross-linked gelatin nanoparticles to metallic nano/micro motors have been combined with RBC membrane coating to absorb bacterial exotoxins and relieve symptoms in infection.[22, 23] RBC membrane coating onto nanoparticles has also been accomplished by using a membrane vesicle-templated in situ gelation strategy.[24] Using this approach, RBC membrane-coated hydrogel nanoparticles not only effectively neutralized toxins from MRSA bacteria, but also enhanced bacterial uptake by immune cells as a direct result of the toxin neutralization.[25] Recently, when mixed with synthetic nanoparticles with positive surface charge, RBC nanosponges self-assembled into a colloidal gel with shear-thinning property for injection and in situ gelation.[26] The nanosponge colloidal gel was shown to neutralize SLO secreted by GAS in vitro and inhibit skin lesion development in mice.
Despite the rapid emergence of RBC nanosponges for antimicrobial applications, from a translational perspective, systematic characterization of PFT neutralization by using nanosponges, especially those made with membranes of human RBCs (denote ‘hRBCs’), remains missing. In this study, we first derived membranes from hRBCs and formulated nanosponges (denote ‘hNS’). We then selected four representative PFTs, including melittin, Hlα, LLO, and SLO, and examined the capacity of hNS in absorbing and neutralizing these toxins both in vitro and in vivo (Figure 1A). For quantitative characterization, we used in vitro hemolytic assay to first determine the hemolytic activity of each toxin and then quantified the toxin binding capacity of hNS against each type of PFTs. We further confirmed effective toxin binding and neutralization with hNS at both cellular and systemic levels: while free toxin elicited significant cytotoxicity in cultured cells and lethality in mice, hNS-absorbed toxins showed no toxic effects. Overall, this study provides systematic characterizations of hNS as a broad-spectrum detoxification platform against different types of PFTs.
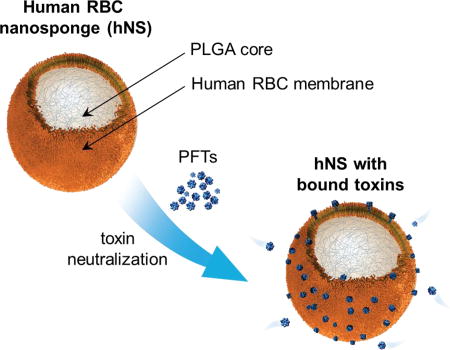
Figure 1. Preparation and characterization of human RBC nanosponges (hNS).

(A) Schematic structure of hNS and its mechanism of neutralizing PFTs. The hNS consists of a polymeric core coated with human RBC bilayer membranes, where PFTs insert and are subsequently inactivated. Detained PFTs are diverted away from their cellular targets, therefore preventing toxin-mediated damages. (B) Dynamic light scattering measurements of nanoparticle hydrodynamic size (diameter) and zeta potential (mV) (n = 3) before and after membrane coating. (C) Representative image of hNS examined with transmission electron microscopy. Samples were stained with uranyl acetate. Inset: a roomed-in view of a single hNS. Both scale bars represent 50 nm. (D) Stability of hNS in 1× PBS or 50% FBS determined by measuring nanoparticle size (diameter, nm) over a span of 5 days (n=3).
Results
The preparation of hNS can be divided into the following three steps: (i) RBC membrane derivation from packed hRBCs through a hypotonic treatment, (ii) polymeric core preparation through a nanoprecipitation method by adding poly(lactic-co-glycolic) acid (PLGA) in organic solvent to an aqueous phase, and (iii) coating hRBC vesicles onto PLGA cores via a sonication process.[26] Following the membrane coating process, the diameter of the nanoparticles increased from 97.9 ± 4.5 to 113.5 ± 3.3 nm, corresponding to the addition of a bilayered hRBC membrane onto the polymeric cores. The limited size increase also indicates close proximity between the membrane coating and the cores. Meanwhile, the surface zeta potential changed from −31.3 ± 0.7 to −27.0 ± 0.9 mV, likely due to charge screening by hRBC membranes (Figure 1B).[17, 27] The samples were then stained with uranyl acetate and visualized by transmission electron microscopy (TEM). As shown in Figure 1C, hNS revealed a spherical core–shell structure, in which the PLGA core was wrapped by a thin shell. In addition, when suspended in 1× PBS or 50% fetal bovine serum (FBS), hNS showed negligible increase of particle size over 5 days, indicating an excellent colloidal stability conferred by membrane coating (Figure 1D). Together, these results confirm the successful preparation of hNS via coating of hRBC membranes onto PLGA cores.
Following hNS formulation, we first investigated the neutralization of melittin with hNS. To examine the hemolytic activity of melittin on hRBCs, the concentration of melittin was varied and the hemolysis was determined through the absorbance of the released hemoglobin in the supernatant. As shown in Figure 2A, the percent hemolysis of melittin followed a sigmoidal curve as a function of the log of the toxin concentration. Based on this measurement, the 'hemolytic dosage' necessary to lyse 100% of the hRBCs (denoted ‘HD100’) was determined to be approximately 7.5 µg/mL. We chose this concentration of melittin to evaluate the neutralization capacity of hNS in two sets of experiments. In the first experiment, we preincubated melittin with different concentrations of hNS before mixing with hRBCs. As shown in Figure 2B, increasing the amount of hNS led to the decrease of toxin-induced hemolysis. The concentration of hNS that inhibited half of the hemolysis (denoted by ‘IC50’) was 3.87 ± 0.13 µg/mL. A maximum inhibition of the hemolysis was observed when the hNS concentration was increased to approximately 15 µg/mL (IC100). In the second experiment, we mixed hRBCs with hNS first and then added melittin. In this experimental setting, hNS competed with hRBCs to absorb toxins. In this competitive regimen, the concentration of hNS that inhibited half of the hemolysis (IC50) was 20.22 ± 0.87 µg/mL and hNS with a concentration of approximately 120 µg/mL (IC100) was needed to fully neutralize melittin.
Figure 2. In vitro and in vivo neutralization of melittin with hNS.

(A) Hemolytic activity of free melittin measured with direct hemolysis in vitro on 5% hRBC suspension. (B) Dose-dependent melittin neutralization with hNS against hRBC hemolysis. Neutralization was performed in both preincubation and competitive regimens. (C) Cytotoxicity of hNS-detained melittin (+hNS, red) on HUVECs in comparison with that of free melittin (−hNS, blue), together with the group of hNS alone (black). (D) Survival rates of mice over 7 days following an intravenous injection of free melittin (−hNS, blue), hNS-detained melittin (+hNS, red), and melittin followed by hNS (+hNS, competitive, black). The dosage of melittin was 70 mg/kg. (E) Surviving mice from (D) were sacrificed on day 7. H&E stained liver histology showed no tissue damage in the group injected with melittin-bound hNS in comparison to the group injected with 1× PBS. Each image is representative of three examined sections. Scale bars represent 0.5 mm. In (A–C), error bars represent standard deviations (n=3).
Neutralization of melittin with hNS was also confirmed by evaluating the cytotoxicity of the sequestered melittin in vitro. In the assay, melittin was sequestered by mixing with hNS at a ratio of 7.5:15 (HD100:IC100) and the hNS-sequestered melittin at various concentrations was added to human umbilical vein endothelial cells (HUVECs). The cells added with the same amount of free melittin served as a control. As shown in Figure 2C, increasing the amount of free melittin resulted in the decrease of cell viability. In the study, a concentration of 2.73 ± 0.11 µg/mL of melittin was found to cause 50% cell death (denoted ‘LD50’). In contrast, cells added with different concentrations of hNS-sequestered melittin or hNS alone without melittin showed no decrease of viability, demonstrating the effective neutralization against melittin-induced cytotoxicity. Melittin neutralization was further tested in vivo with systemic administration. Melittin is a key component known to induce hemolysis and myolysis and eventually results in death from renal failure and cardiac complications.[28, 29] In our experimental condition, a 100% mortality rate was observed in mice that received free melittin at a dose of 70 mg/kg (n=6, Figure 2D). In contrast, all mice injected intravenously with the same dosage of hNS-sequestered melittin (melittin:hNS = 7.5:15) or melittin followed by hNS survived. The mice were then sacrificed on day 7 after the injection of sequestered melittin and the liver tissue was harvested and analyzed by haemotoxylin and eosin (H&E) staining. It was shown that the treated mice had normal hepatocytes supplied by blood vessels and no inclusion of Kupffer cells in the sinusoids was observed, which were similar to those of the control group injected with PBS only (Figure 2E).
We next examined the neutralization of Hlα with hNS. To quantify the hemolytic activity of Hlα against hRBCs, serial dilutions of Hlα ranging from 0.25 to 32 µg/mL were added to hRBC suspension. The percent hemolysis of Hlα followed a similar sigmoidal curve as a function of the log of the toxin concentration (Figure 3A). Based on the hemolysis measurements, approximately 16 µg/mL Hlα caused complete lysis of hRBCs (HD100). At this toxin concentration, neutralization capacity of hNS was tested in both preincubation and competitive manners (Figure 3B). In the preincubation setting, hNS at concentrations ranging from 3.13 to 50.0 µg/mL were first mixed with Hlα and then the mixtures were added to hRBCs. Hlα-induced hemolysis was effectively inhibited, with an IC50 value of 11.7 ± 0.3 µg/mL and an IC100 value of about 25 µg/mL. In the competitive setting, hNS was first mixed with hRBCs followed by the addition of Hlα. The measured IC50 and IC100 values increased to 53.7 ± 5.0 µg/mL and approximately 200 µg/mL, respectively.
Figure 3. In vitro and in vivo neutralization of α-hemolysin (Hlα) with hNS.

(A) Hemolytic activity of free Hlα measured with direct hemolysis in vitro on 5% hRBC suspension. (B) Dose-dependent Hlα neutralization with hNS against hRBC hemolysis. Neutralization was performed in both preincubation and competitive regimens. (C) Cytotoxicity of hNS-detained Hlα (+hNS, red) on HUVECs in comparison with that of free Hlα (−hNS, blue), together with the group of hNS alone (black). (D) Survival rates of mice over 7 days following an intravenous injection of free Hlα (−hNS, blue), hNS-detained Hlα (+hNS, red), and Hlα followed by hNS (+hNS, competitive, black). The dosage of Hlα was 0.11 mg/kg. (E) Surviving mice from (D) were sacrificed on day 7. H&E stained liver histology showed no tissue damage in the group injected with Hlα-bound hNS in comparison to the group injected with 1× PBS. Each image is representative of three examined sections. Scale bars represent 0.5 mm. In (A–C), error bars represent standard deviations (n=3).]
Neutralization of Hlα with hNS was further confirmed by evaluating the cytotoxicity of hNS-sequestered Hlα in vitro. In the assay, Hlα was mixed with hNS at a ratio of 16:25 (HD100:IC100) and various amounts of sequestered Hlα were added to HUVECs. The cells added with the same amount of free Hlα served as a control. As shown in Figure 3C, cell viability decreased while the amount of free Hlα added to the cells increased. An LD50 value of 0.27 ± 0.01 µg/mL was measured. In contrast, no obvious decrease in viability was observed when cells were incubated with sequestered Hlα or hNS alone without Hlα, implying the effective neutralization against Hlα with hNS. When tested in vivo with systemic administration, mice injected intravenously with Hlα at a dosage of 0.11 mg/kg showed 100% mortality rate (n=6, Figure 3D). In contrast, all mice received the same amount of hNS-sequestered Hlα (Hlα:hNS=16:25, HD100:IC100) survived. In addition, when Hlα was first injected, followed by hNS injection, the survival rate was 83.3% at 4 h and 66.7% at 12 h. The survived mice injected with hNS-sequestered Hlα were sacrificed on day 7 after the injection. Histological analysis of liver sections showed similar appearance between mice treated with sequestered Hlα and PBS with no observable irregularities (Figure 3E).
Next, we followed the same procedure to study the neutralization of LLO with hNS. To quantify the hemolytic activity of LLO, serial dilutions of LLO with concentrations ranging from 0.016 to 1 µg/mL were added to hRBCs and percent hemolysis for each sample was quantified. As shown in Figure 4A, the HD50 value of LLO was found to be 0.20 ± 0.01 µg/mL and the HD100 value was about 0.63 µg/mL. With a fixed LLO toxin concentration at HD100, neutralization capability of hNS was evaluated in both preincubation and competitive manners (Figure 4B). In the preincubation setting where hNS and LLO were mixed prior to adding to the hRBCs, hNS at a concentration of 0.15 ± 0.01 µg/mL inhibited half of the LLO-induced hemolysis (IC50) and at a concentration of 0.78 µg/mL it completely inhibited the hemolysis (IC100). In the competitive setting where hRBCs and hNS were mixed prior to the addition of LLO, the IC50 and IC100 values were determined to be 8.01 ± 0.22 µg/mL and approximately 30 µg/mL, respectively.
Figure 4. In vitro and in vivo neutralization of Listeriolysin O (LLO) with hNS.

(A) Hemolytic activity of free LLO measured with direct hemolysis in vitro on 5% hRBC suspension. (B) Dose-dependent LLO neutralization with hNS against hRBC hemolysis. Neutralization was performed in both preincubation and competitive regimens. (C) Cytotoxicity of hNS-detained LLO (+hNS, red) on HUVECs in comparison with that of free LLO (−hNS, blue), together with the group of hNS alone (black). (D) Survival rates of mice over 7 days following an intravenous injection of free LLO (−hNS, blue), hNS-detained LLO (+hNS, red), and LLO followed by hNS (+hNS, competitive, black). The dosage of LLO was 0.08 mg/kg. (E) Surviving mice from (D) were sacrificed on day 7. H&E stained liver histology showed no tissue damage in the group injected with LLO-bound hNS in comparison to the group injected with 1× PBS. Each image is representative of three examined sections. Scale bars represent 0.5 mm. In (A–C), error bars represent standard deviations (n=3).
Following the in vitro neutralization study, we tested the cytotoxicity of hNS-sequestered LLO with HUVECs. In the study, LLO was mixed with hNS at a ratio of 0.63:0.78 (HD100:IC100) and added to the cells at various concentrations. In parallel, cells added with the same amount of free LLO or hNS alone were used as a control. As shown in Figure 4C, cell viability decreased with the increase of free LLO concentration. Based on viability measurements, an LD50 value of 0.80 ± 0.02 µg/mL was determined. In contrast, cells added with hNS-sequestered LLO or hNS alone showed no obvious change in their viability, suggesting effective neutralization of LLO with hNS. We then examined the toxicity of hNS-sequestered LLO in vivo. In the study, all mice, included those injected intravenously with LLO mixed with hNS at a ratio of 0.63:0.78 (HD100:IC100) or injected with LLO followed by injection of hNS, survived. On the contrary, mice received free LLO at a dosage of 0.8 mg/kg showed a mortality rate of 100% (n=6, Figure 4D). The survived mice were sacrificed on day 7 after the injection and liver sections showed no observable irregularities compared to control mice injected with PBS (Figure 4E).
Lastly, we tested the neutralization effect of hNS against SLO. In the study, serial dilutions of SLO with concentrations ranging from 0.063 to 2 µg/mL were added to hRBCs. The percent hemolysis of SLO again followed a sigmoidal profile as a function of the log of the toxin concentration (Figure 5A). From this experiment, the HD50 value of SLO was determined to be 0.26 ± 0.01 µg/mL and the HD100 value was 1 µg/mL. We then used SLO at HD100 to evaluate the neutralization capacity of hNS (Figure 5B). In preincubation manner, hNS concentration was varied from 0.03 to 0.94 µg/mL and percent inhibition showed clear concentration dependence. An IC50 value of 0.10 ± 0.01 µg/mL and IC100 value of 0.47 µg/mL were determined. In competitive manner, hNS concentration was varied from 0.25 to 32 µg/mL. The percent inhibition showed similar concentration dependence with an IC50 value of 3.41 ± 0.13 µg/mL and an estimated IC100 value of 50 µg/mL.
Figure 5. In vitro and in vivo neutralization of Streptolysin O (SLO) with hNS.

(A) Hemolytic activity of free SLO measured with direct hemolysis in vitro on 5% hRBC suspension. (B) Dose-dependent SLO neutralization with hNS against hRBC hemolysis. Neutralization was performed in both preincubation and competitive regimens. (C) Cytotoxicity of hNS-detained SLO (+hNS, red) on HUVECs in comparison with that of free SLO (−hNS, blue), together with the group of hNS alone. (D) Survival rates of mice over 7 days following an intravenous injection of free SLO (−hNS, blue), hNS-detained SLO (+hNS, red), and SLO followed by hNS (+hNS, competitive, black). The dosage of SLO was 0.8 mg/kg. (E) Surviving mice from (D) were sacrificed on day 7. H&E stained liver histology showed no tissue damage in the group injected with SLO-bound hNS in comparison to the group injected with 1× PBS. Each image is representative of three examined sections. Scale bars represent 0.5 mm. In (A–C), error bars represent standard deviations (n=3).
The cytotoxicity of hNS-sequestered SLO was also tested with HUVECs (Figure 5C). In the test range of 0.25 to 16 µg/mL, free SLO induced cell death in a concentration dependent manner with an estimated LD50 value of 2.21 ± 0.11 µg/mL. In contrast, cells added with hNS-sequestered SLO (SLO:hNS=HD100:IC100) or hNS of equivalent dosages showed no obvious change in their viability. To confirm the toxin neutralization in vivo, free SLO and hNS-squestered SLO were administered intravenously into mice (n=6, Figure 5D). Free SLO with a dosage of 0.08 µg/kg resulted in 100% mortality; however, when SLO was sequestered by hNS at a ratio of 1:0.47 (HD100:IC100) or injected immediately prior to hNS injection, SLO toxin didn’t cause any mouse death during the study. Similar to above studies, the survived mice were sacrificed on day 7 after SLO injection. Liver sections showed no observable irregularities compared to control mice injected with PBS (Figure 5E). These results together confirm that hNS can effectively neutralize the virulence of SLO.
Discussion
Through evolution, different types of PFTs have developed diverse pore architectures and distinct molecular mechanisms of membrane insertion for bioactivity. In this work, we selected four well-known PFTs, including melittin, Hlα, LLO, and SLO to represent the heterogeneity of PFT family. In addition to their apparent differences of molecular structures, their pore-forming mechanisms also vary significantly. For example, melittin forms a bent α-helical rod, which penetrates into membrane and subsequently induces a disordered region in lipid packing and thus disrupts membrane permeability.[30, 31] Staphylococcus aureus Hlα oligomerizes into a circular, water-soluble, heptameric prepore, followed by a second conformational change that leads to membrane penetration and formation of a trans-membrane pore.[32, 33] In contrast, SLO binds to cholesterol-containing target membranes and assembles into supramolecular curved rod structures, which in turn form rings and arcs that penetrate into the apolar domain of the bilayer.[34] As another cholesterol-dependent cytolysin, LLO shares many similarities to SLO during pore formation, but distinguishes itself with prominent pH and temperature sensitivity.[35, 36] Such structural heterogeneity and mechanistic diversity have posed significant challenges to developing broad-spectrum detoxification strategy. The design of hNS overrides the structural and biological diversity by exploiting the functional similarity shared by all PFTs in binding and disrupting cell membranes. Overall, our results show that hNS is effective in neutralizing hemolytic activity, cytotoxicity, and systemic lethality against all selected PFTs.
In the study, we measured the IC100 value of hNS, which represented the minimum hNS concentration required to fully neutralize a specific toxin at its HD100 concentration. For instance, the HD100 values of the four tested PFTs, melittin, Hlα, LLO, and SLO, were 7.5 µg/mL, 16 µg/mL, 0.63 µg/mL, and 1.0 µg/mL, respectively. The hemolytic activities and the HD100 values were determined using 100 µL of 5% hRBC solution. In order to completely neutralize these toxins at their HD100 concentrations in a preincubation manner, the required hNS concentrations (IC100) were 15 µg/mL, 25 µg/mL, 0.78 µg/mL and 0.47 µg/mL, respectively, where the concentrations were measured based on protein content in the hNS formulations. The total number of hRBCs in 100 µL of 5% hRBC solution is about 3.6 × 10⁷ hRBCs, which translates to approximately 19.8 µg hRBC membrane proteins. Note that we have quantified that 1 × 10¹⁰ hRBCs have about 5.5 mg membrane proteins. These approximate calculations indicate that for melittin, hNS with 15 µg/mL hRBC membrane proteins (total volume ~ 160 µL) is capable of protecting hRBCs with 19.8 µg hRBC membrane proteins. That is, by converting 1 hRBC to the nanoscale hNS, it is able to protect effectively about 8 hRBCs from being lysed by melittin at its HD100 concentration. When similar calculations were applied to the other three PFTs, the results show that hNS made from membranes of 1 hRBC can protect 5 hRBCs for Hlα, 160 hRBCs for LLO, and 266 hRBCs for SLO, respectively. While these numbers and estimations are subjective to the particular experimental settings for hemolytic test, the overall tendency clearly demonstrate that by converting the microscale hRBCs into nanoscale hNS, the nanoscale design has apparent advantages for preferential toxin absorption. Such enhanced toxin absorption of nanoscale hNS as compared to that of the microscale hRBCs may be attributed to several factors.[18] First, by translocating cell membrane from microscale hRBC to nanoscale hNS, it drastically increases the total numbers of particles (i.e. one hRBC will provide enough membrane to prepare thousands of hNS). This translates to significantly increased frequency of collision between the membrane substrate and the toxin. Second, a much higher surface curvature of hNS compared to that of hRBC also increases surface tension, which may further enhance toxin-hNS affinity.[37]
Human RBCs show accelerated clearance when injected into mouse circulation system, owing largely to the immune incompatibility between the two species.[38] So far, detoxification with RBC membrane-coated nanosponges has been developed primarily with RBCs collected from syngeneic animal models. These studies demonstrate that mouse RBC membrane coating considerably reduced immune responses when tested in a mouse model.[17, 27] Specifically, mouse RBC membrane coating significantly prolonged nanoparticle circulation time and effectively reduced the accelerated blood clearance phenomenon in mice.[17, 39] In addition, toxin-bound nanosponges primarily accumulated in the liver without causing its tissue damage, suggesting a safe metabolic pathway of the sequestered toxins.[18] Existing results combined with the biomimetic nature of hNS imply that a similar benefit may occur for human RBC membrane coating to enhance immune compatibility when tested in human. By focusing on formulations with human sources, this study takes one step further to facilitate the development of hNS using hRBCs toward clinical translation to human. In this perspective, hRBCs can be collected from a blood bank. Immunocompatibility can be ensured through matching hNS with patients according to their blood types (A, B, AB, or O type) and Rh factor (Rh+ or Rh−) with a cross-match test, similar to the process used in a blood transfusion. Notably, hNS made of type O, Rh- RBCs (the universal donor blood type) is expected to be broadly applicable to human population with different blood types, which will significantly simplify the clinical translation of hNS with a singular formulation.
Conclusions
In this study, we formulated hRBC nanosponges and demonstrated their detoxification capability against a series of hemolytic pore-forming toxins. Consisting of a biocompatible and biodegradable polymeric core and a natural hRBC membrane shell, the resulting hRBC nanosponge bears a stable core-shell structure in both PBS solution and serum. When incubated with four different types of toxins with distinct hyemlysis mechanisms (melittin, α-hemolysin, listeriolysin O, and streptolysin O), the hRBC nansoponges are effective in completely neutralizing the toxins’ hemolytic activity in both preincubation and competitive settings. More impressively, the nanosponge-sequestered toxins lose toxicity to not only cells but also live animals. In contrast the free toxins rapidly cause cell apoptosis and animal death when applied in a similar manner as the sequestered counterparts. Given the sequestered toxins are faithfully detained within the RBC membranes on the nansoponges, they pose negligible toxicity to the liver before they are digested. Overall, this work provides systematic characterizations of hRBC nanosponges as a broad-spectrum detoxification system. Similar design and test can be readily applied to other cell membrane-coated nanosponge platforms for broadly applicable antimicrobial prophylactics and therapeutics.
Experimental Section
Materials
Packed human red blood cells (hRBCs) were purchased from ZenBio, Inc, from which cell membrane was derived according to a previously published protocol.[26] BCA assay kit was purchased from ThermoFisher to quantify membrane protein concentration. Dithiothreitol (DTT), acetone, melittin from honeybee venom, and α-hemolysin from Staphylococcus aureus were purchased from Sigma-Aldrich. Poly (lactic-co-glycolic) acid (PLGA, 50:50, 0.67 dL/g) was purchased from LACTEL Absorbable Polymers. Recombinant Listeriolysin-O (LLO) was purchased from Abcam. To obtain Streptolysin-O (SLO), the SLO gene was cloned into vector pET15b and transformed into BL21 DE3 Escherichia coli. Bacteria expressing SLO were cultured in 1 L of Lysogeny broth (LB) and incubated at 37°C with shaking. Expression was induced in cultures at 0.7 A600 with 0.5 mm isopropyl 1-thio-β-D-galactopyranoside (Bio-Vectra) and maintained at 30°C for 4 h. Bacterial pellets were disrupted by sonication, and soluble 6× histidine-tagged SLO was purified using nickel-nitrilotriacetic acid-agarose (Invitrogen). Fractions corresponding to the full-length SLO were pooled and further purification was achieved using Amicon Ultra centrifugal filters (Millipore Sigma). Protein was monitored by SDS-PAGE and quantitated by A280 and frozen in aliquots at −80 °C. Assays were performed in the presence of 10 mm DTT for reducing conditions.
Preparation and characterization of hNS
Nanosponges were prepared with a three-step process based on a previously published protocol.[26] In the first step, packed hRBCs were washed with ice cold 1× PBS and then suspended in hypotonic 0.25× PBS in an ice bath for 20 min for hemolysis. Lysed cells were centrifuged at 800 × g for 5 min, followed by hemoglobin removal. The hypotonic treatment was repeated three times and purified membranes were collected as pink pellets. In the second step, PLGA polymeric cores were prepared with a nanoprecipitation method, where 1 mL of PLGA (20 mg/mL in acetone) was added dropwise into 3 mL of water. The mixture was stirred for 2 h for the organic solvent to evaporate. Finally, in the third step of membrane coating, hRBC membrane was mixed with PLGA cores, followed by bath sonication for 10 min. After the sonication, nanosponge sizes were measured first with dynamic light scattering (DLS, Malvern ZS90 Zetasizer). Serum and PBS stabilities were examined by mixing 1 mg/mL of hNS in water with 2× PBS and 100% FBS, respectively, at a 1:1 volume ratio. Then hNS sizes were measured for a consecutive 5 days. A protein:PLGA ratio of 0.5:1 was used to formulate hNS. Membrane coating was further confirmed by visualizing nanoparticle morphology with transmission electron microscopy (TEM).
Quantification of toxin hemolytic activity
To quantify the hemolytic activity, serial dilutions of toxins (60 µL) in 1× PBS containing 10 mM DTT was added to 100 µL of 5 vol% purified hRBCs and the mixture was incubated at 37°C for 30 min. Following the incubation, cells were gently spun down and the concentration of released hemoglobin in the supernatant was quantified by measuring the absorbance at 540 nm. The degree of hRBC lysis was determined by comparing the absorbance with that of the hRBC samples disrupted with bath sonication, which served as the positive control of 100% release. In the study, hemolysis dosage 100% (HD100) was defined as the minimum toxin concentration that induced 100% hemolysis.
Toxin neutralization in vitro
In vitro toxin neutralization ability of hNS was examined in two regimens. In the first regimen, nanosponges with varying concentrations were added to toxins of HD100 and incubated for 30 min at 37°C (the total solution volume was 60 µL with 10 mM DTT). Then purified hRBCs (5 vol%, 100 µL) was added. The mixture was incubated for an additional 30 min at 37°C prior to hemolysis quantification. In the second regimen, nanosponges with varying concentrations were added to purified hRBCs first (5 vol%, 100 µL), followed by the addition of toxins (60 µL, HD100 with 10 mM DTT). The mixture was incubated at 37°C for 30 min, followed by hemolysis quantification. In either regimen, the minimum nanosponge concentration that completely inhibited toxin hemolytic activity was defined as inhibitory concentration 100% (IC100). RBC samples either without any treatment or subjected to bath sonication were used as negative and positive controls, respectively. All experiments were performed in triplicate.
Assessment of cytotoxicity of hNS-sequestered toxins
Human umbilical vein endothelial cells (HUVECs) were obtained from ATCC (American Type Culture Collection) and cultured in RMPI1640 supplemented with 10 vol% fetal bovine serum (FBS) and 2 vol% penicillin-streptomycin (PS). The cells were incubated at 37°C with 5% CO2 in a humidity-controlled cell incubator. Prior to the study, cells were seeded at a density of 1×10⁴ cells per well on 96-well plates and cultured overnight. In the study, toxins were sequestered by adding nanosponges (toxin:hNS=HD100:IC100) and then incubated at 37°C for 30 min. Then the sequestered toxins at different concentrations were added to HUVECs and the cells were cultured for 48 h. Cytotoxicity of free toxins and hNS alone were evaluated in parallel. The cell viability was then determined by using a 3-(4,5-dimethylthiazol-2-yl)-5-(3-carboxymethoxyphenyl)-2-(4-sulfophenyl)-2H-tetrazolium, inner salt (MTS) assay (Abcam) following the manufacturer’s instruction.
Toxin neutralization in vivo
All animal experiments followed protocols that were reviewed, approved and performed under the regulatory supervision of the University of California, San Diego’s institutional biosafety program and the Institutional Animal Care and Use Committee (IACUC). Free toxins of various dosages were first injected intravenously into ICR mice (n=6). Lethal dosage 100% (LD100) was determined by observing mouse survival for a period of 15 min. To study neutralization in vivo, each toxin was first mixed with hNS (toxin dosage=LD100, toxin:hNS=HD100:IC100), respectively, followed by intravenous injection of 250 µL into ICR mice (n=6 in each group). Alternatively, each toxin was first injected intravenously, immediately followed by injection of hNS, respectively (the interval between two injections was approximately 1 min). Mice received LD100 of toxins without hNS served as positive controls (n=6).
Hepatotoxicity of hNS-sequestered toxins
Surviving mice from the above in vivo toxin neutralization studies were monitored. On day 7 after the initial injections, mice were sacrificed. The liver was harvested and fixed in 10% formalin. The fixed was then stained with hematoxylin and eosin (H&E) for histological analyses.
Statistical Analysis
DLS and plate reader data represent averaged values (obtained from 3 replicates) with standard deviation shown as error bars. For microscopic images of the histological sections, the experiments were performed in triplicate and a representative image was shown. For survival studies, an independent Log-rank (Mantel-Cox) test was performed in GraphPad Prism 7 with confidence level P = 0.05 deemed significant.
Acknowledgments
Y.C. and M.C. contributed equally to this work. This work is supported by the Defense Threat Reduction Agency Joint Science and Technology Office for Chemical and Biological Defense under Grant Number HDTRA1-14-1-0064 and by the National Institutes of Health under Award Number R01EY025947.
Footnotes
Conflict of Interest
The authors declare no conflict of interest.
Contributor Information
Dr. Yijie Chen, Department of NanoEngineering and Moores Cancer Center, University of California, San Diego, La Jolla, CA 92093, U.S.A. The Second Affiliated Hospital and Yuying Children’s Hospital of Wenzhou Medical University, Wenzhou, 325027, Zhejiang, China
Mengchun Chen, Department of NanoEngineering and Moores Cancer Center, University of California, San Diego, La Jolla, CA 92093, U.S.A.; The Second Affiliated Hospital and Yuying Children’s Hospital of Wenzhou Medical University, Wenzhou, 325027, Zhejiang, China
Prof. Yue Zhang, Department of NanoEngineering and Moores Cancer Center, University of California, San Diego, La Jolla, CA 92093, U.S.A..
Joo Hee Lee, Department of NanoEngineering and Moores Cancer Center, University of California, San Diego, La Jolla, CA 92093, U.S.A..
Tamara Escajadillo, Department of Pediatrics and Skaggs School of Pharmacy and Pharmaceutical Sciences, University of California San Diego, La Jolla, California 92093, USA.
Dr. Hua Gong, Department of NanoEngineering and Moores Cancer Center, University of California, San Diego, La Jolla, CA 92093, U.S.A.
Ronnie H. Fang, Department of NanoEngineering and Moores Cancer Center, University of California, San Diego, La Jolla, CA 92093, U.S.A.
Dr. Weiwei Gao, Department of NanoEngineering and Moores Cancer Center, University of California, San Diego, La Jolla, CA 92093, U.S.A.
Prof. Victor Nizet, Department of Pediatrics and Skaggs School of Pharmacy and Pharmaceutical Sciences, University of California San Diego, La Jolla, California 92093, USA
Liangfang Zhang, Department of NanoEngineering and Moores Cancer Center, University of California, San Diego, La Jolla, CA 92093, U.S.A..
References
- 1.Dal Peraro M, van der Goot FG. Nat. Rev. Microbiol. 2016;14:77. doi: 10.1038/nrmicro.2015.3. [DOI] [PubMed] [Google Scholar]
- 2.Los FCO, Randis TM, Aroian RV, Ratner AJ. Microbiol. Mol. Biol. Rev. 2013;77:173. doi: 10.1128/MMBR.00052-12. [DOI] [PMC free article] [PubMed] [Google Scholar]
- 3.Chambers HF, Deleo FR. Nat. Rev. Microbiol. 2009;7:629. doi: 10.1038/nrmicro2200. [DOI] [PMC free article] [PubMed] [Google Scholar]
- 4.Wardenburg JB, Bae T, Otto M, Deleo FR, Schneewind O. Nat. Med. 2007;13:1405. doi: 10.1038/nm1207-1405. [DOI] [PubMed] [Google Scholar]
- 5.Berube BJ, Wardenburg JB. Toxins (Basel) 2013;5:1140. doi: 10.3390/toxins5061140. [DOI] [PMC free article] [PubMed] [Google Scholar]
- 6.Kayal S, Charbit A. FEMS Microbiol. Rev. 2006;30:514. doi: 10.1111/j.1574-6976.2006.00021.x. [DOI] [PubMed] [Google Scholar]
- 7.Schnupf P, Portnoy DA. Microb. Infect. 2007;9:1176. doi: 10.1016/j.micinf.2007.05.005. [DOI] [PubMed] [Google Scholar]
- 8.Timmer AM, Timmer JC, Pence MA, Hsu LC, Ghochani M, Frey TG, Karin M, Salvesen GS, Nizet V. J. Biol. Chem. 2009;284:862. doi: 10.1074/jbc.M804632200. [DOI] [PMC free article] [PubMed] [Google Scholar]
- 9.Uchiyama S, Dohrmann S, Timmer AM, Dixit N, Ghochani M, Bhandari T, Timmer JC, Sprague K, Bubeck-Wardenburg J, Simon SI, Nizet V. Front. Immunol. 2015;6:1. doi: 10.3389/fimmu.2015.00581. [DOI] [PMC free article] [PubMed] [Google Scholar]
- 10.Hung DT, Shakhnovich EA, Pierson E, Mekalanos JJ. Science. 2005;310:670. doi: 10.1126/science.1116739. [DOI] [PubMed] [Google Scholar]
- 11.Rasko DA, Moreira CG, Li DR, Reading NC, Ritchie JM, Waldor MK, Williams N, Taussig R, Wei SG, Roth M, Hughes DT, Huntley JF, Fina MW, Falck JR, Sperandio V. Science. 2008;321:1078. doi: 10.1126/science.1160354. [DOI] [PMC free article] [PubMed] [Google Scholar]
- 12.Cegelski L, Marshall GR, Eldridge GR, Hultgren SJ. Nat. Rev. Microbiol. 2008;6:17. doi: 10.1038/nrmicro1818. [DOI] [PMC free article] [PubMed] [Google Scholar]
- 13.Rasko DA, Sperandio V. Nat. Rev. Drug Discov. 2010;9:117. doi: 10.1038/nrd3013. [DOI] [PubMed] [Google Scholar]
- 14.Hilliard JJ, Datta V, Tkaczyk C, Hamilton M, Sadowska A, Jones-Nelson O, O'Day T, Weiss WJ, Szarka S, Nguyen V, Prokai L, Suzich J, Stover CK, Sellman BR. Antimicrob. Agents Chemother. 2015;59:299. doi: 10.1128/AAC.03918-14. [DOI] [PMC free article] [PubMed] [Google Scholar]
- 15.Barczak AK, Hung DT. Curr. Opin. Microbiol. 2009;12:490. doi: 10.1016/j.mib.2009.06.012. [DOI] [PMC free article] [PubMed] [Google Scholar]
- 16.Allen RC, Popat R, Diggle SP, Brown SP. Nat. Rev. Microbiol. 2014;12:300. doi: 10.1038/nrmicro3232. [DOI] [PubMed] [Google Scholar]
- 17.Hu CMJ, Zhang L, Aryal S, Cheung C, Fang RH, Zhang L. Proc. Natl. Acad. Sci. U. S. A. 2011;108:10980. doi: 10.1073/pnas.1106634108. [DOI] [PMC free article] [PubMed] [Google Scholar]
- 18.Hu CMJ, Fang RH, Copp J, Luk BT, Zhang L. Nat. Nanotechnol. 2013;8:336. doi: 10.1038/nnano.2013.54. [DOI] [PMC free article] [PubMed] [Google Scholar]
- 19.Hu CMJ, Fang RH, Luk BT, Zhang L. Nat. Nanotechnol. 2013;8:933. doi: 10.1038/nnano.2013.254. [DOI] [PMC free article] [PubMed] [Google Scholar]
- 20.Wei XL, Gao J, Wang F, Ying M, Angsantikul P, Kroll AV, Zhou JR, Gao W, Lu WY, Fang RH, Zhang L. Adv. Mater. 2017;29 doi: 10.1002/adma.201701644. [DOI] [PMC free article] [PubMed] [Google Scholar]
- 21.Wang F, Gao W, Thamphiwatana S, Luk BT, Angsantikul P, Zhang QZ, Hu CMJ, Fang RH, Copp JA, Pornpattananangkul D, Lu WY, Zhang L. Adv. Mater. 2015;27:3437. doi: 10.1002/adma.201501071. [DOI] [PMC free article] [PubMed] [Google Scholar]
- 22.Li LL, Xu JH, Qi GB, Zhao XZ, Yu FQ, Wang H. ACS Nano. 2014;8:4975. doi: 10.1021/nn501040h. [DOI] [PubMed] [Google Scholar]
- 23.Wu ZG, Li TL, Gao W, Xu TL, Jurado-Sanchez B, Li JX, Gao W, He Q, Zhang L, Wang J. Adv. Funct. Mater. 2015;25:3881. [Google Scholar]
- 24.Zhang JH, Gao W, Fang RH, Dong AJ, Zhang L. Small. 2015;11:4309. doi: 10.1002/smll.201500987. [DOI] [PMC free article] [PubMed] [Google Scholar]
- 25.Zhang Y, Zhang JH, Chen WS, Angsantikul P, Spiekermann KA, Fang RH, Gao W, Zhang L. J. Controlled Release. 2017;263:185. doi: 10.1016/j.jconrel.2017.01.016. [DOI] [PMC free article] [PubMed] [Google Scholar]
- 26.Zhang Y, Gao W, Chen Y, Escajadillo T, Ungerleider J, Fang R, Christman K, Nizet V, Zhang L. ACS Nano. 2017 doi: 10.1021/acsnano.7b06968. in press. [DOI] [PMC free article] [PubMed] [Google Scholar]
- 27.Gao W, Hu CMJ, Fang RH, Luk BT, Su J, Zhang L. Adv. Mater. 2013;25:3549. doi: 10.1002/adma.201300638. [DOI] [PMC free article] [PubMed] [Google Scholar]
- 28.Hoshino Y, Koide H, Furuya K, Haberaecker WW, Lee SH, Kodama T, Kanazawa H, Oku N, Shea KJ. Proc. Natl. Acad. Sci. U. S. A. 2012;109:33. doi: 10.1073/pnas.1112828109. [DOI] [PMC free article] [PubMed] [Google Scholar]
- 29.Grisotto LSD, Mendes GE, Castro I, Baptista M, Alves VA, Yu L, Burdmann EA. Toxicon. 2006;48:44. doi: 10.1016/j.toxicon.2006.04.016. [DOI] [PubMed] [Google Scholar]
- 30.Dempsey CE. Biochim. Biophys. Acta. 1990;1031:143. doi: 10.1016/0304-4157(90)90006-x. [DOI] [PubMed] [Google Scholar]
- 31.van den Bogaart G, Guzman JV, Mika JT, Poolman B. J. Biol. Chem. 2008;283:33854. doi: 10.1074/jbc.M805171200. [DOI] [PMC free article] [PubMed] [Google Scholar]
- 32.Bhakdi S, Tranumjensen J. Microbiol. Rev. 1991;55:733. doi: 10.1128/mr.55.4.733-751.1991. [DOI] [PMC free article] [PubMed] [Google Scholar]
- 33.Otto M. Curr. Opin. Microbiol. 2014;17:32. doi: 10.1016/j.mib.2013.11.004. [DOI] [PMC free article] [PubMed] [Google Scholar]
- 34.Bhakdi S, Tranumjensen J, Sziegoleit A. Infect. Immun. 1985;47:52. doi: 10.1128/iai.47.1.52-60.1985. [DOI] [PMC free article] [PubMed] [Google Scholar]
- 35.Glomski IJ, Gedde MM, Tsang AW, Swanson JA, Portnoy DA. J. Cell Biol. 2002;156:1029. doi: 10.1083/jcb.200201081. [DOI] [PMC free article] [PubMed] [Google Scholar]
- 36.Schuerch DW, Wilson-Kubalek EM, Tweten RK. Proc. Natl. Acad. Sci. U. S. A. 2005;102:12537. doi: 10.1073/pnas.0500558102. [DOI] [PMC free article] [PubMed] [Google Scholar]
- 37.Bhakdi S, Bayley H, Valeva A, Walev I, Walker B, Weller U, Kehoe M, Palmer M. Arch. Microbiol. 1996;165:73. doi: 10.1007/s002030050300. [DOI] [PubMed] [Google Scholar]
- 38.Hu Z, Van Rooijen N, Yang YG. Blood. 2011;118:5938. doi: 10.1182/blood-2010-11-321414. [DOI] [PMC free article] [PubMed] [Google Scholar]
- 39.Rao L, Bu LL, Xu JH, Cai B, Yu GT, Yu XL, He ZB, Huang QQ, Li A, Guo SS, Zhang WF, Liu W, Sun ZJ, Wang H, Wang TH, Zhao XZ. Small. 2015;11:6225. doi: 10.1002/smll.201502388. [DOI] [PubMed] [Google Scholar]